Every chart.
A different perspective.
PeerLogix’s dashboard brings title demand rankings, weekly Top 10s and viewing changes into one research workspace. Explore platform patterns, audience relationships and talent through 74 interactive charts. Published data tables and metric definitions connect each chart to the evidence behind its findings.
The chart library
From question to evidence
What do you want to learn from the charts?
Explore original PeerLogix evidence, then put the same viewing expertise to work on your titles, catalog or market.
What should we investigate for acquisition?
Compare a catalog’s dependence on its hits with the audience demand attached to earlier premieres and rising library titles.
Catalog concentration ↗Demand for older premieres ↗Older titles gaining share ↗Which audience or territory fits?
Use within-market story preferences and geographic breadth to make a title shortlist specific to the people and places you need to serve.
Subgenre preferences by market ↗Title demand and geographic breadth ↗Anime titles and availability ↗Which changes deserve attention now?
Read the size, direction and duration of a title’s movement, then bring a defined title set and period to a PeerLogix evaluation.
Weekly TV demand ↗Recent title surges ↗Check data coverage ↗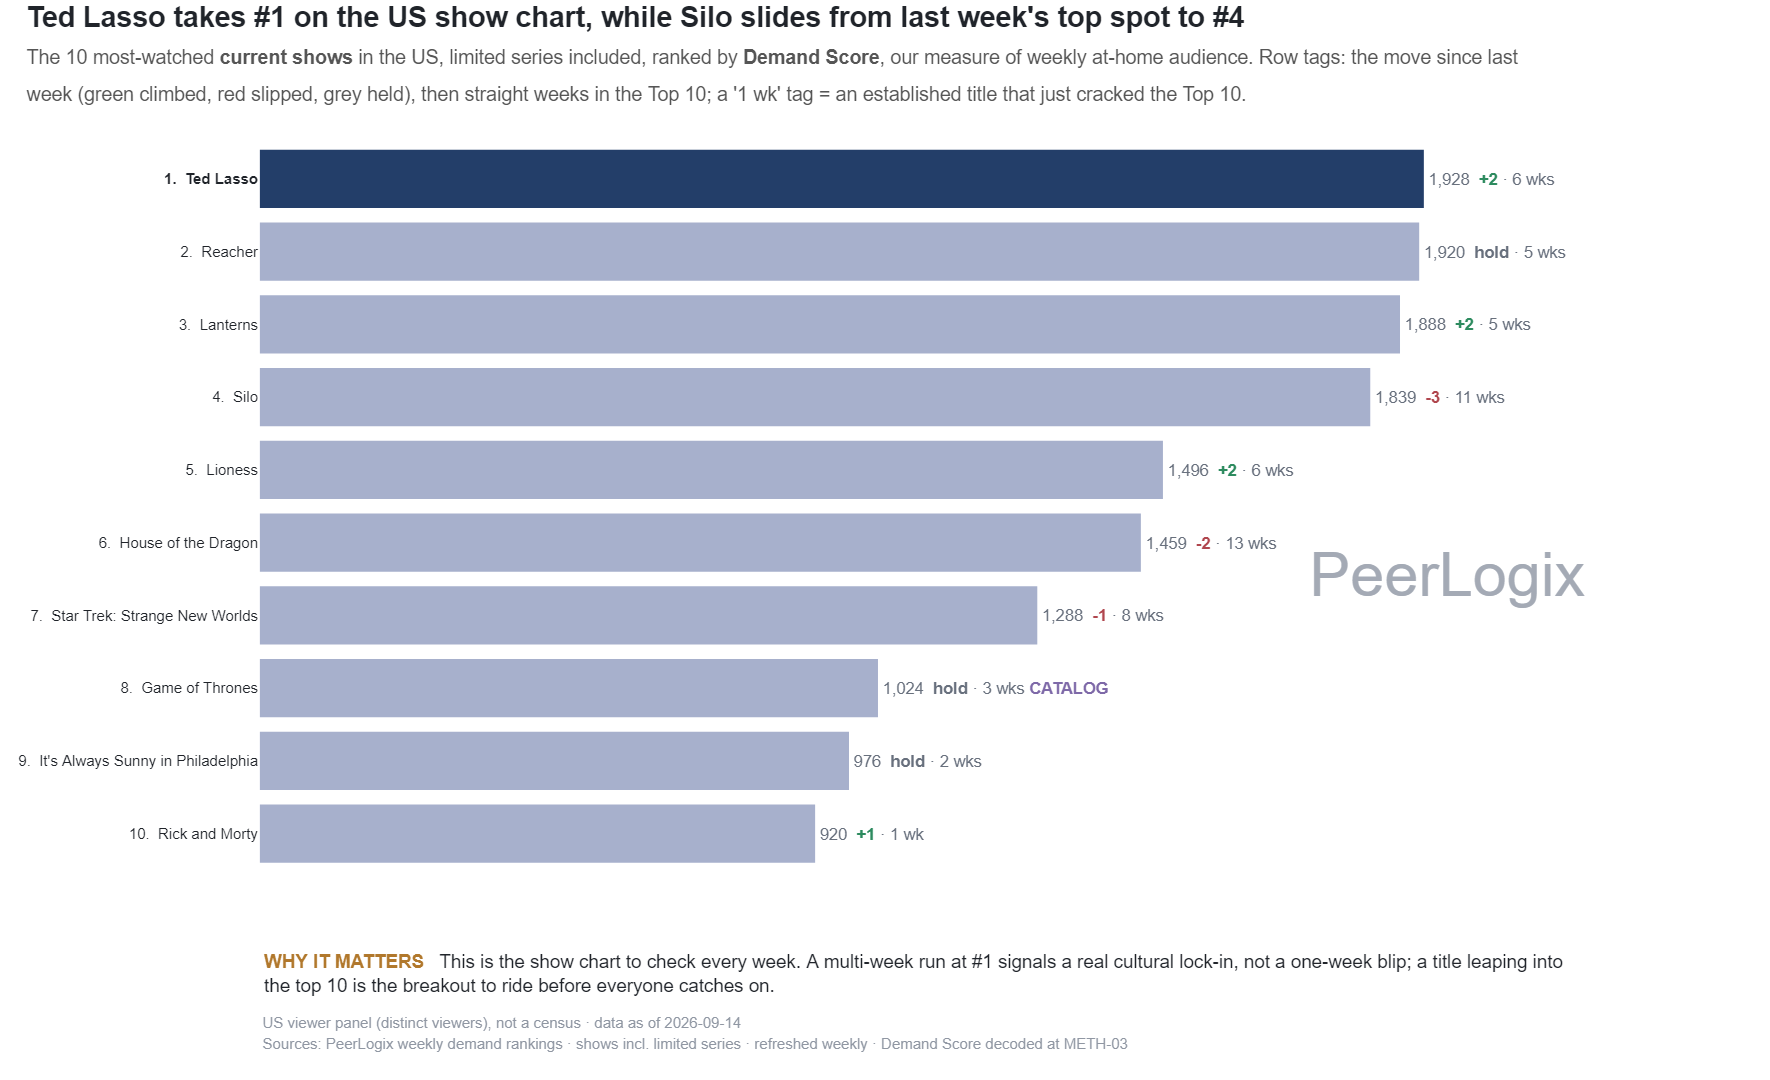
Trackers & Standings weekly
Weekly TV rankings in the PeerLogix U.S. panel
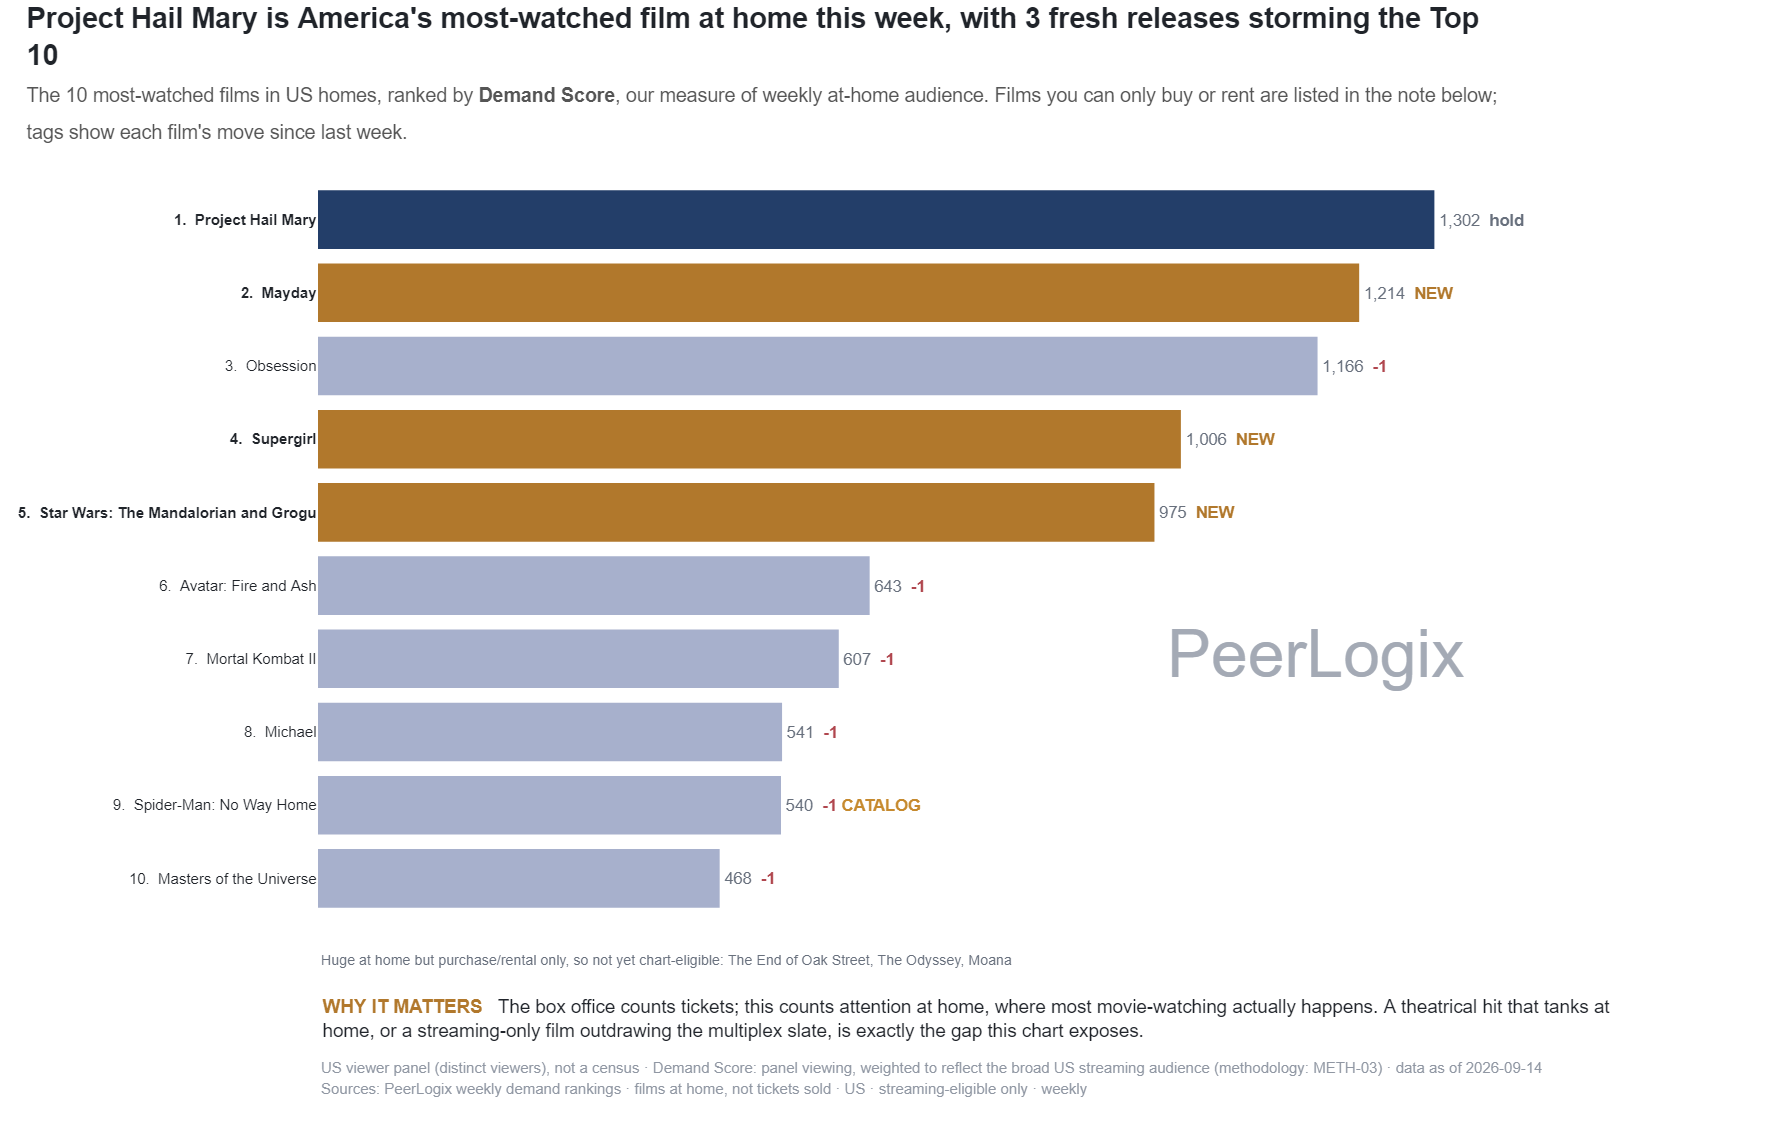
Trackers & Standings weekly
Weekly movie rankings in the PeerLogix U.S. panel
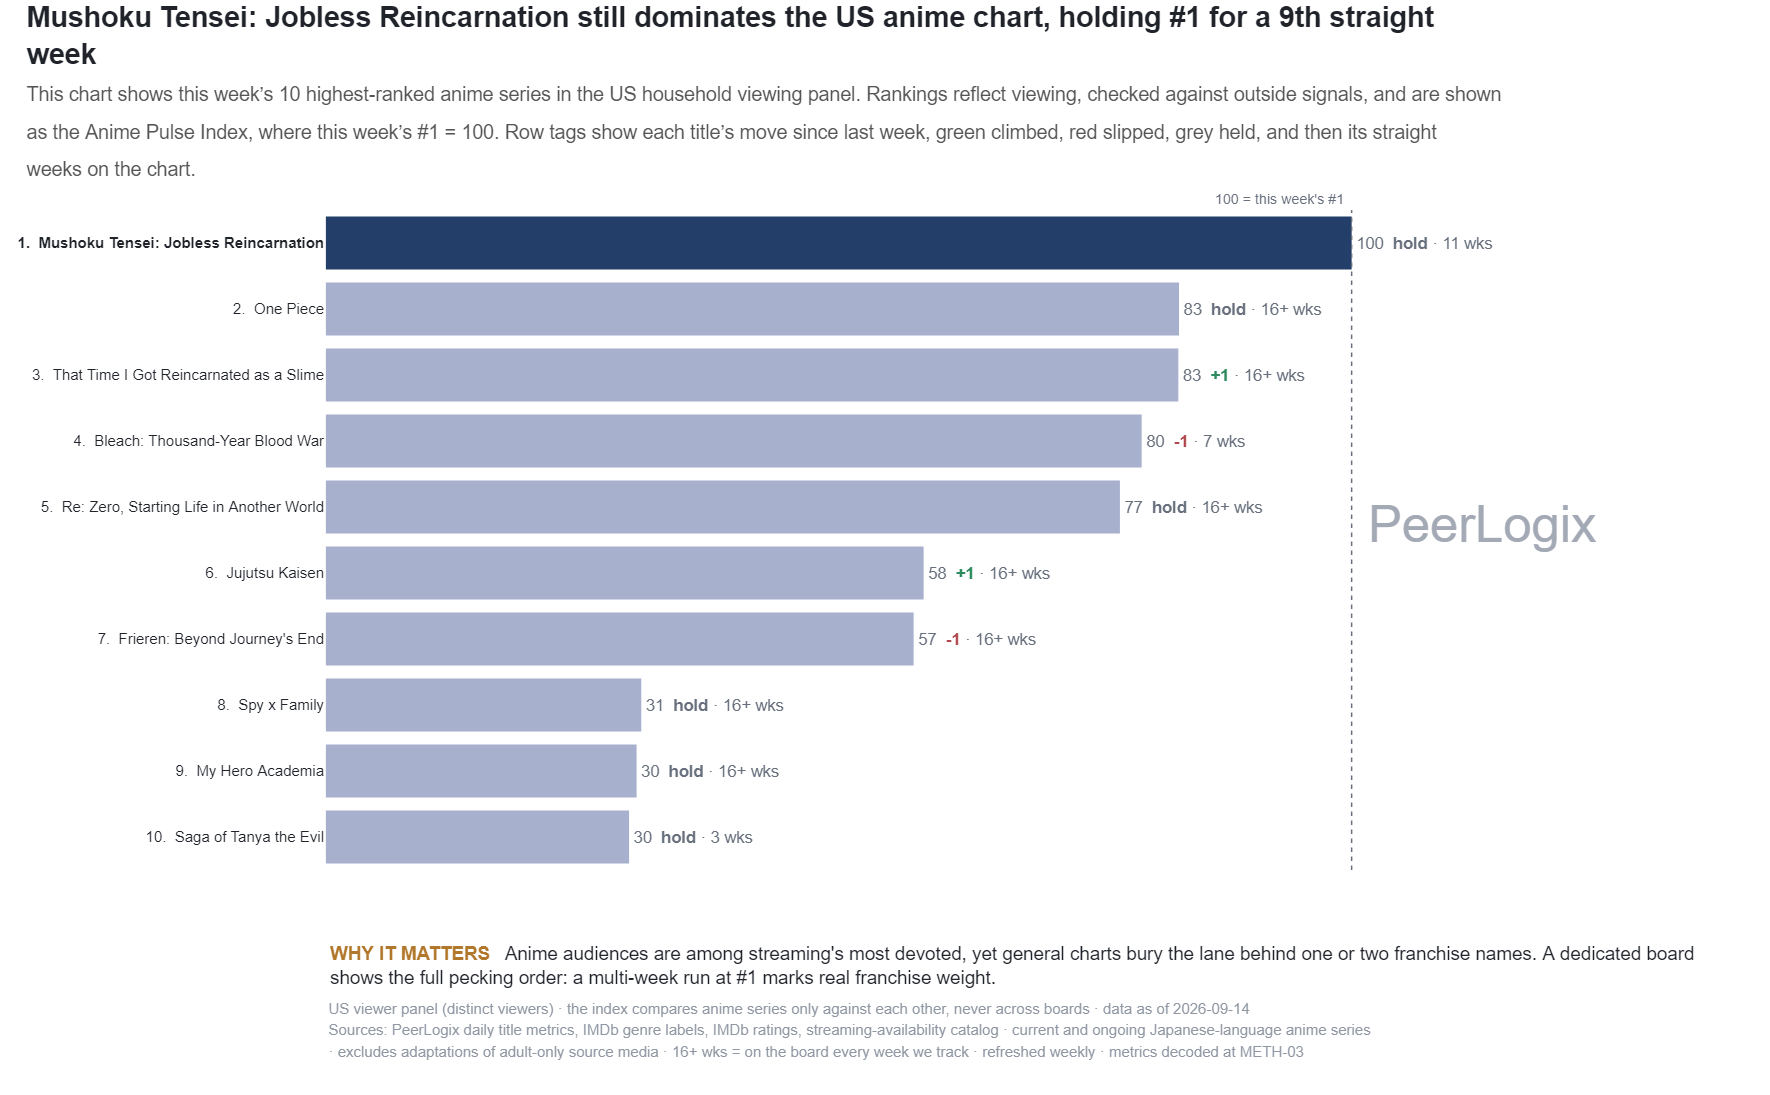
Anime Pulse weekly
Anime streaming rankings: the Anime Pulse index
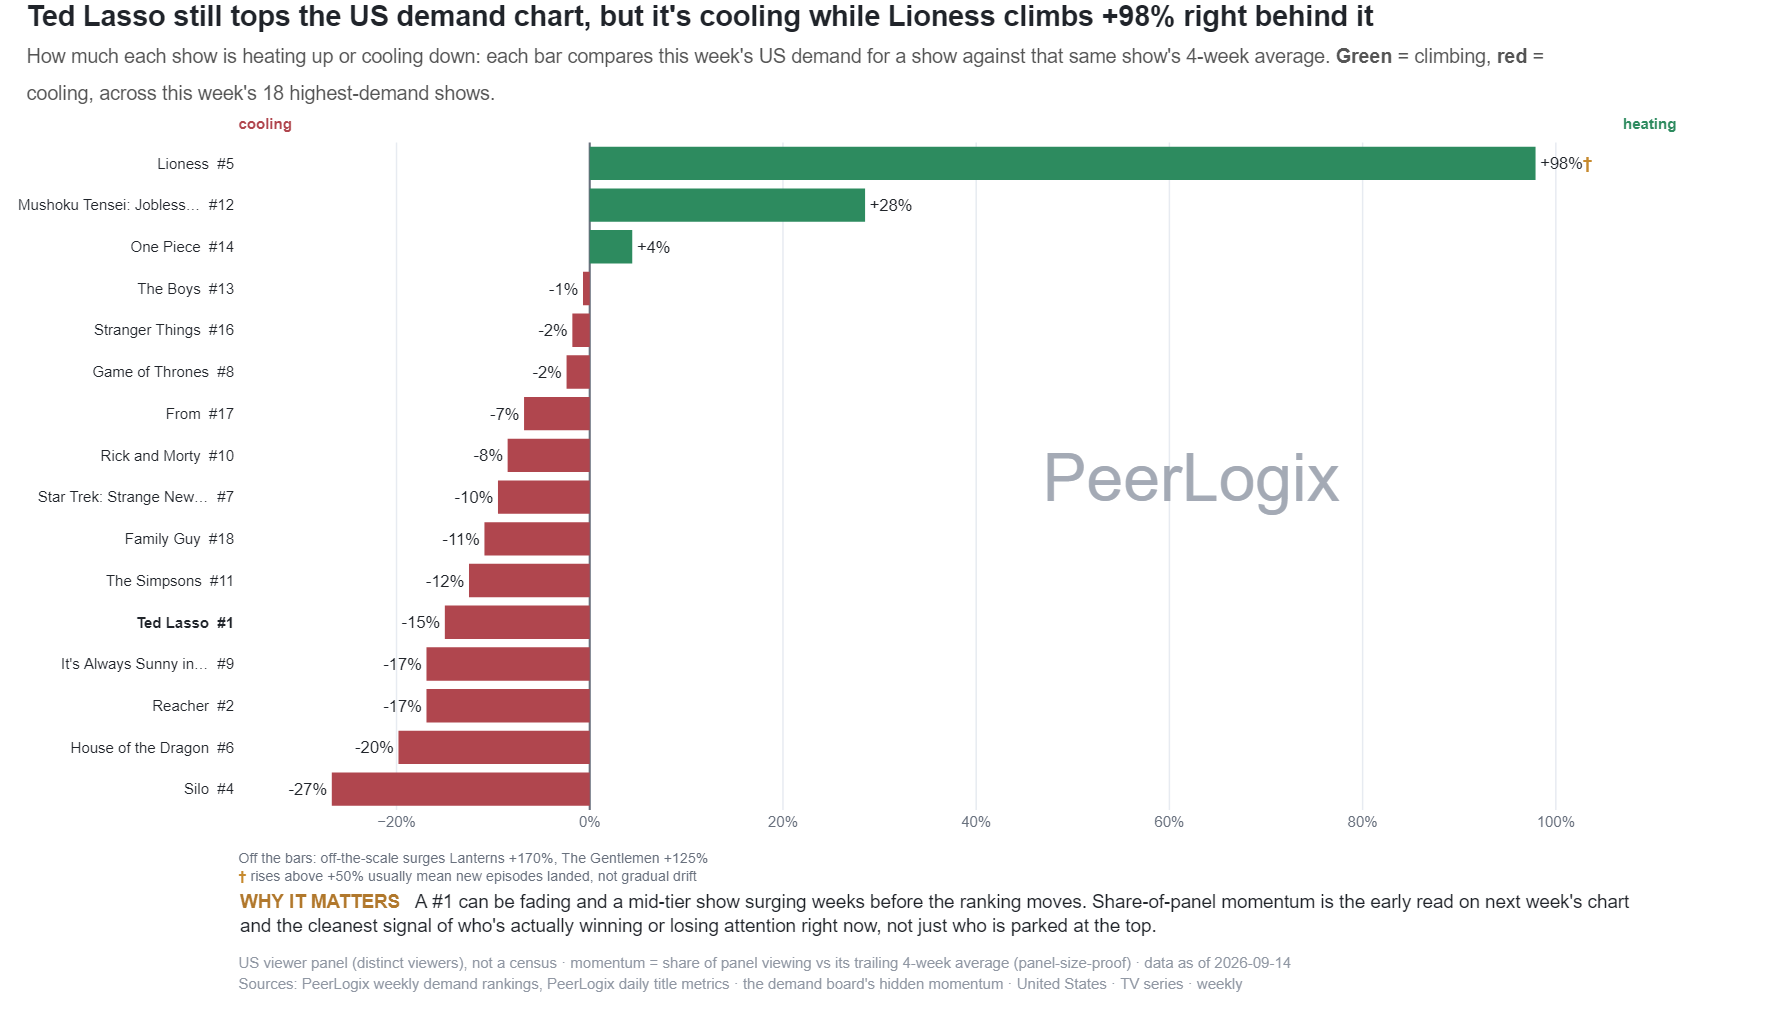
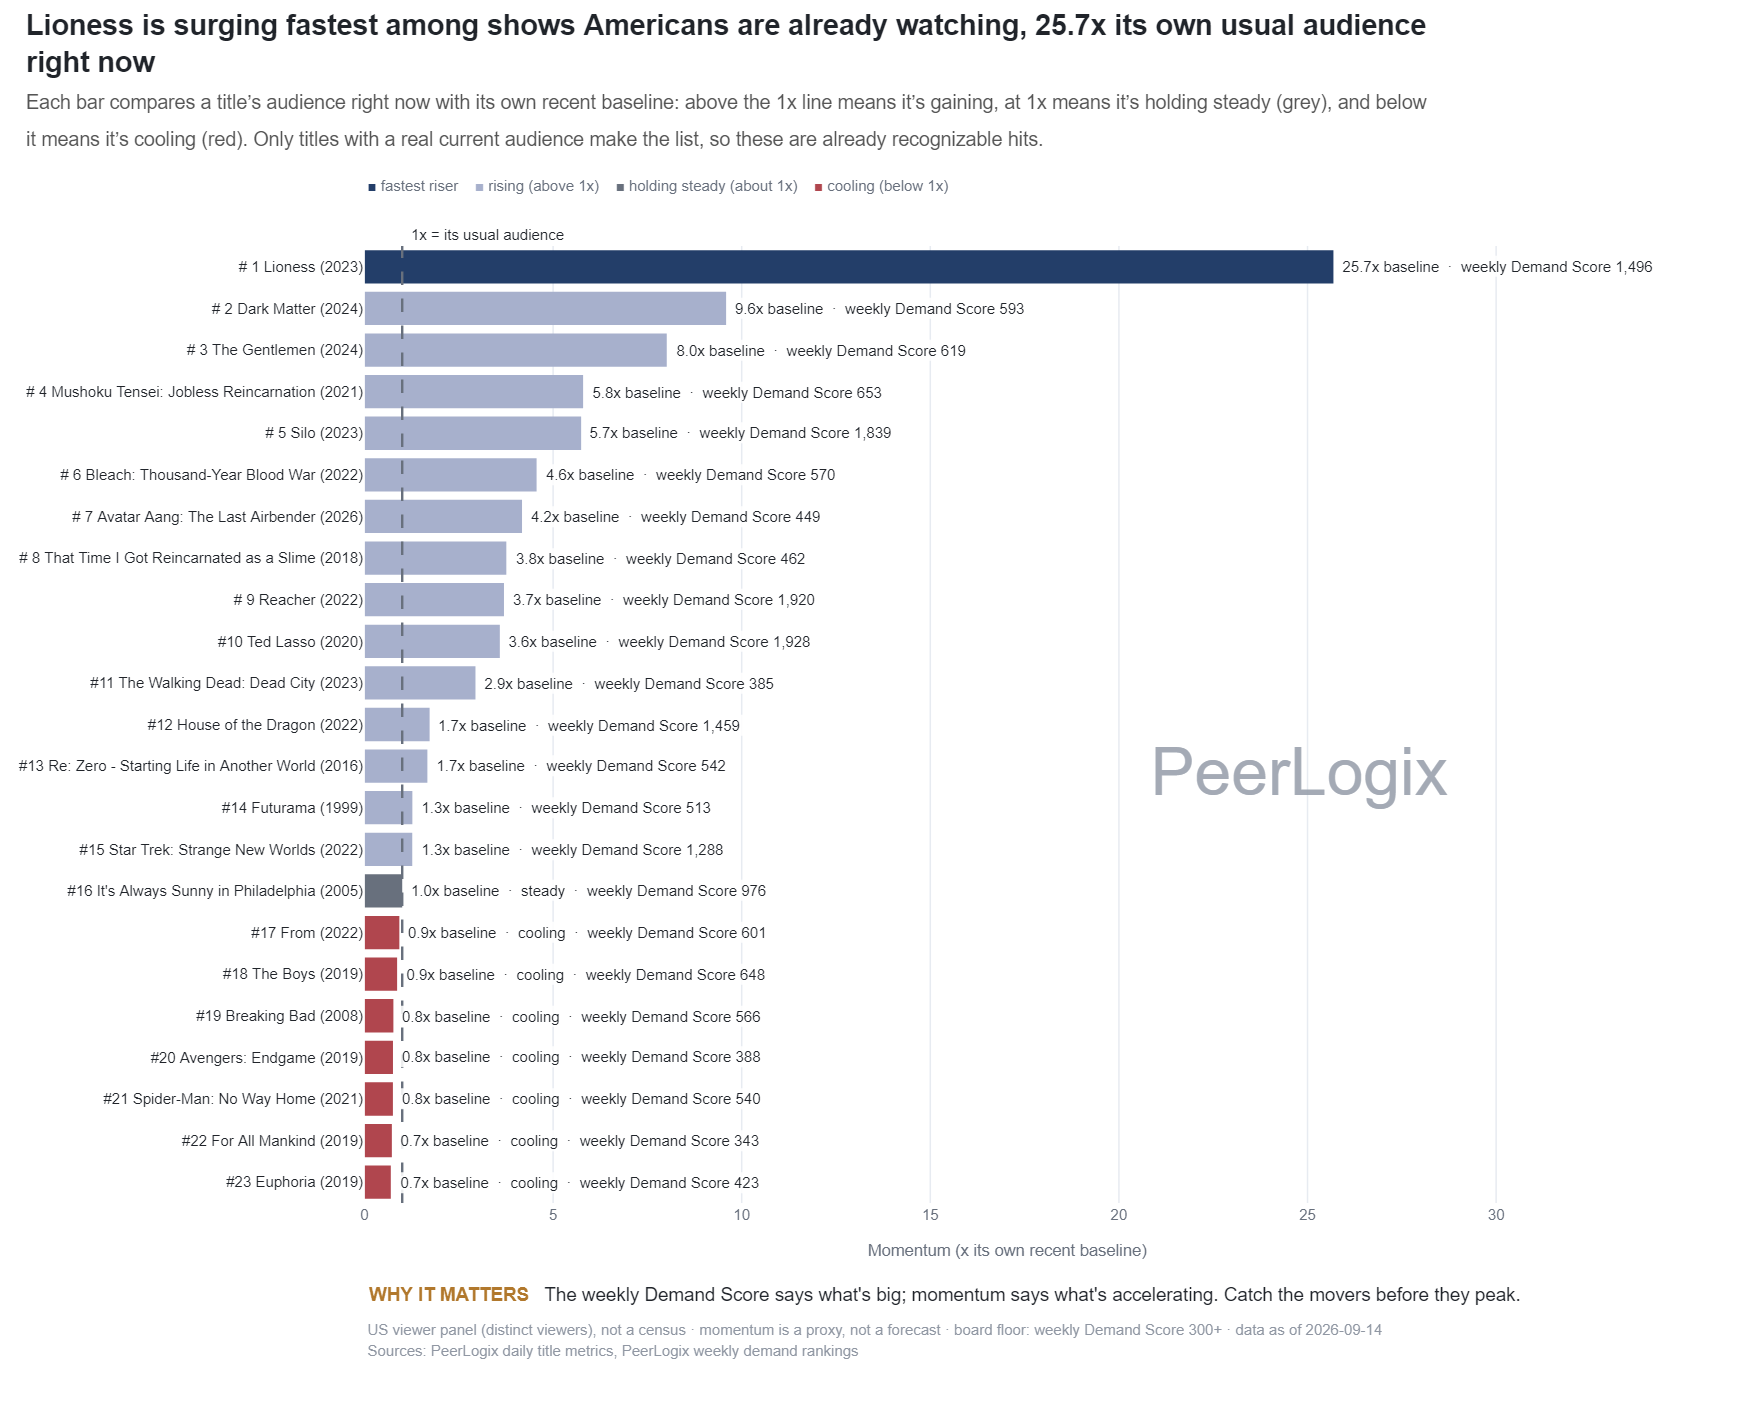
Trackers & Standings weekly
TV shows gaining or losing momentum in the U.S. panel
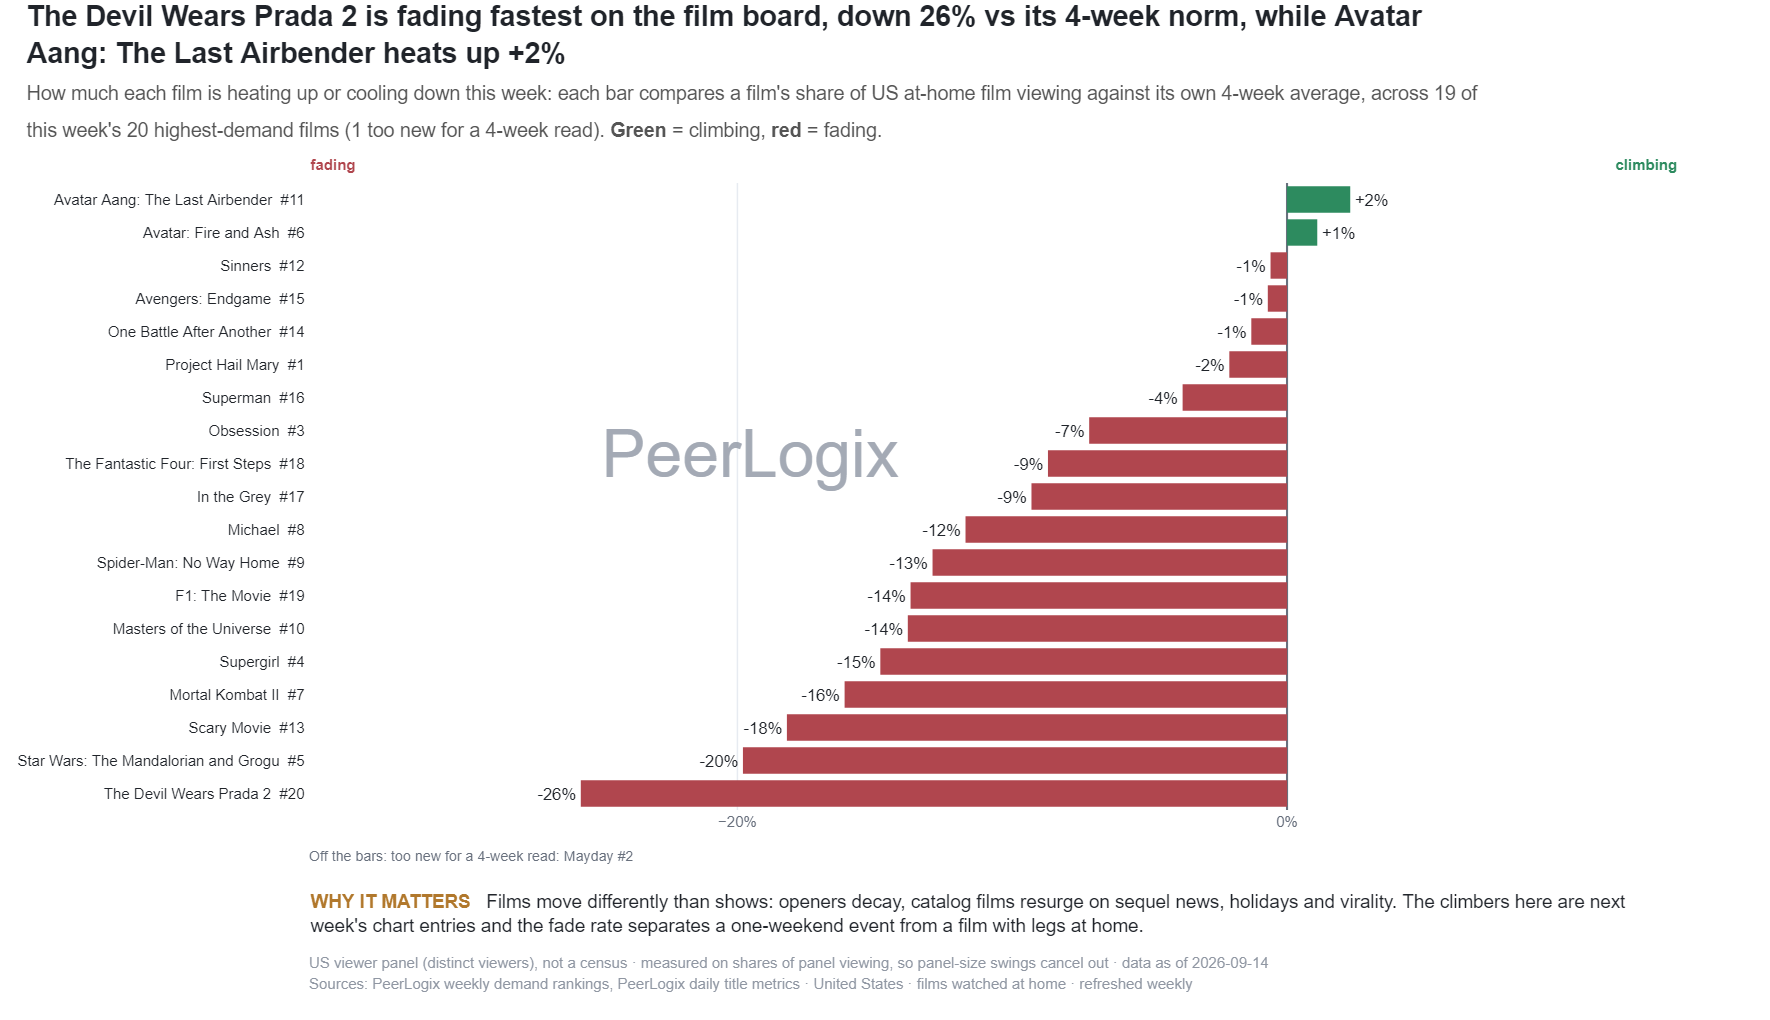
Trackers & Standings weekly
Movies gaining or losing momentum in the U.S. panel
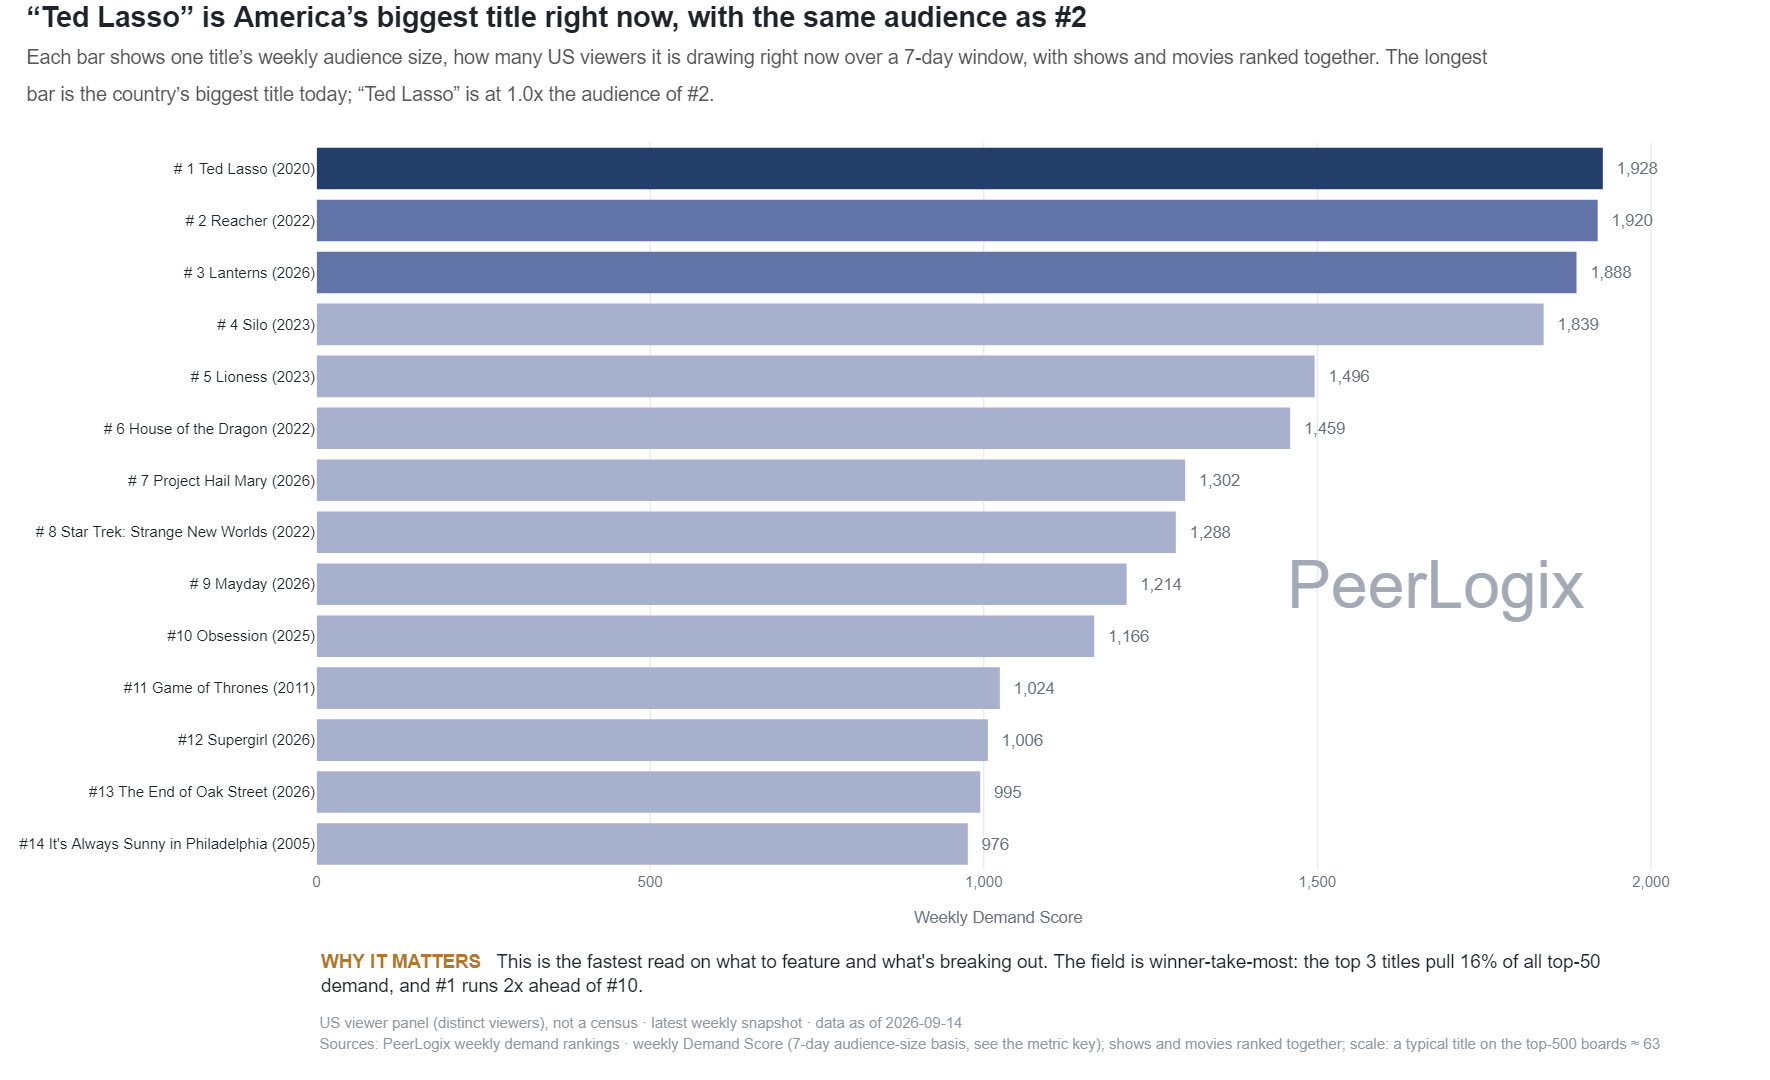
Demand & Momentum daily
Weekly movie and TV demand rankings in the U.S. panel
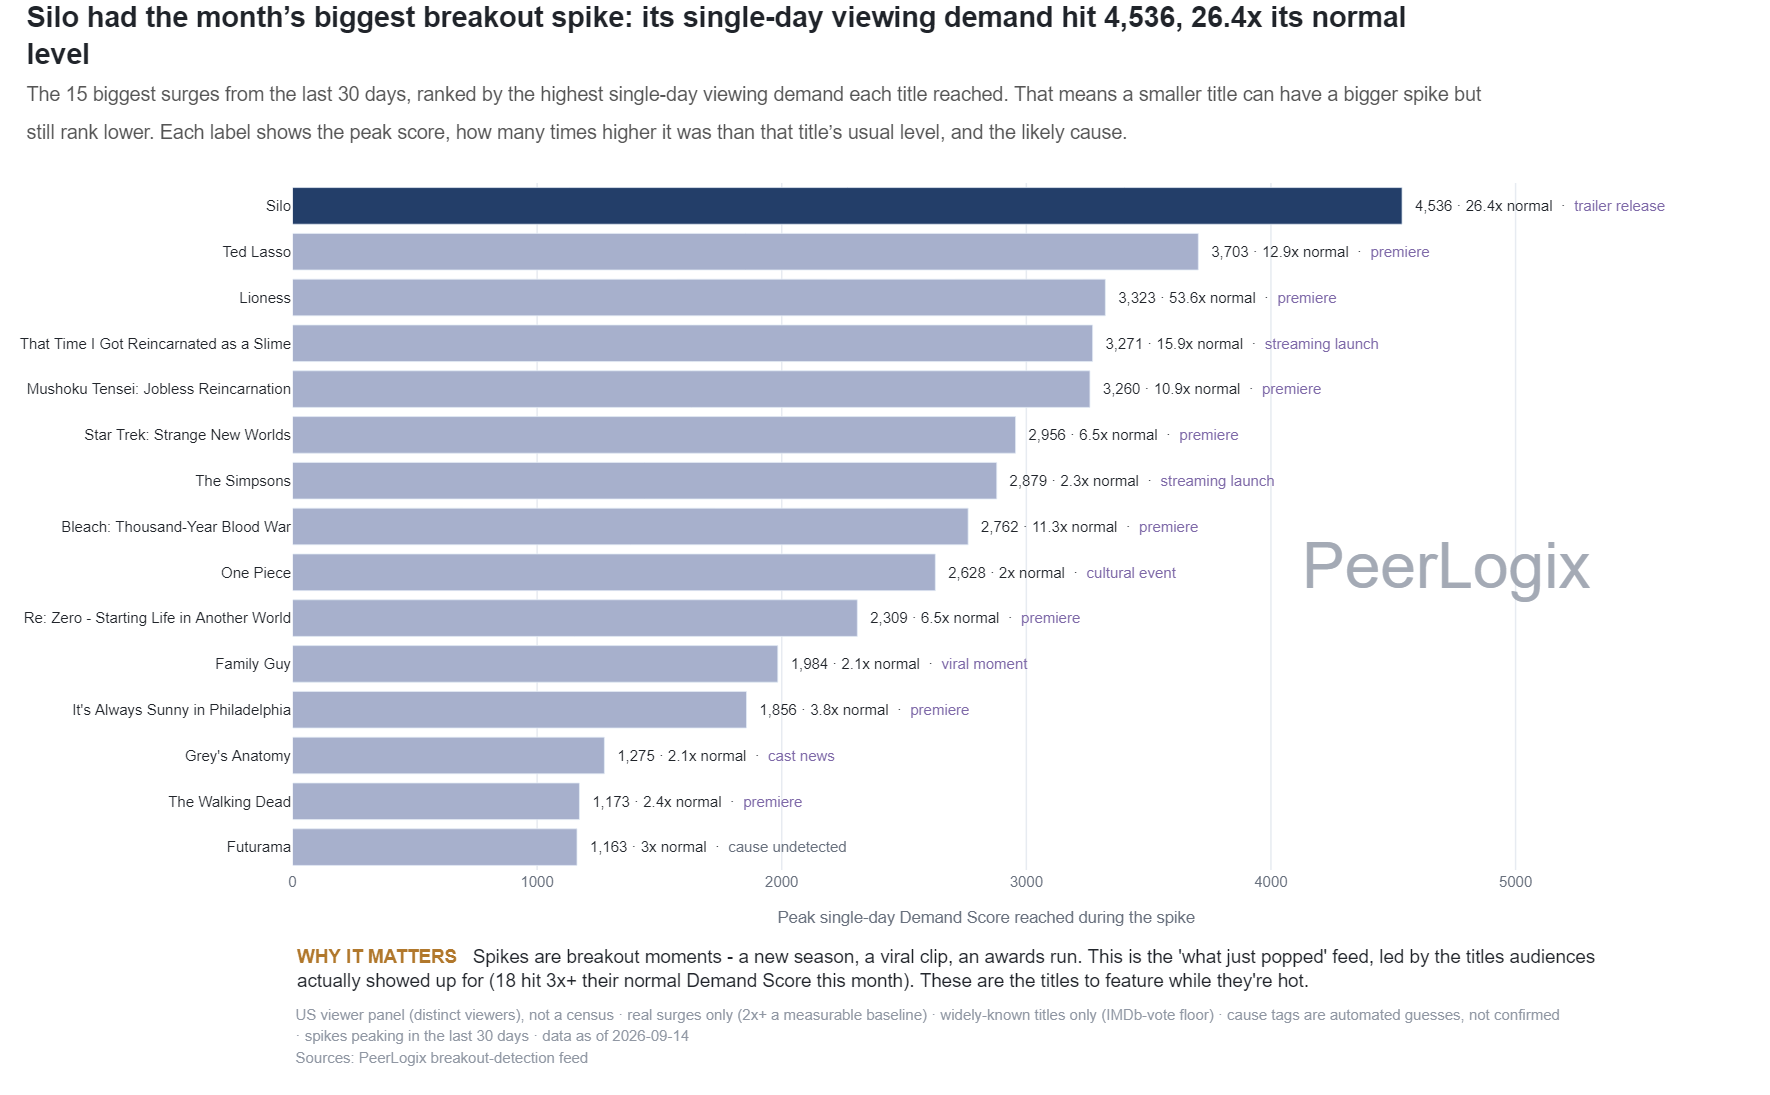
Spikes & Breakouts daily
Streaming title surges: the largest recent peak scores
Demand & Momentum daily
SI with DI Floor
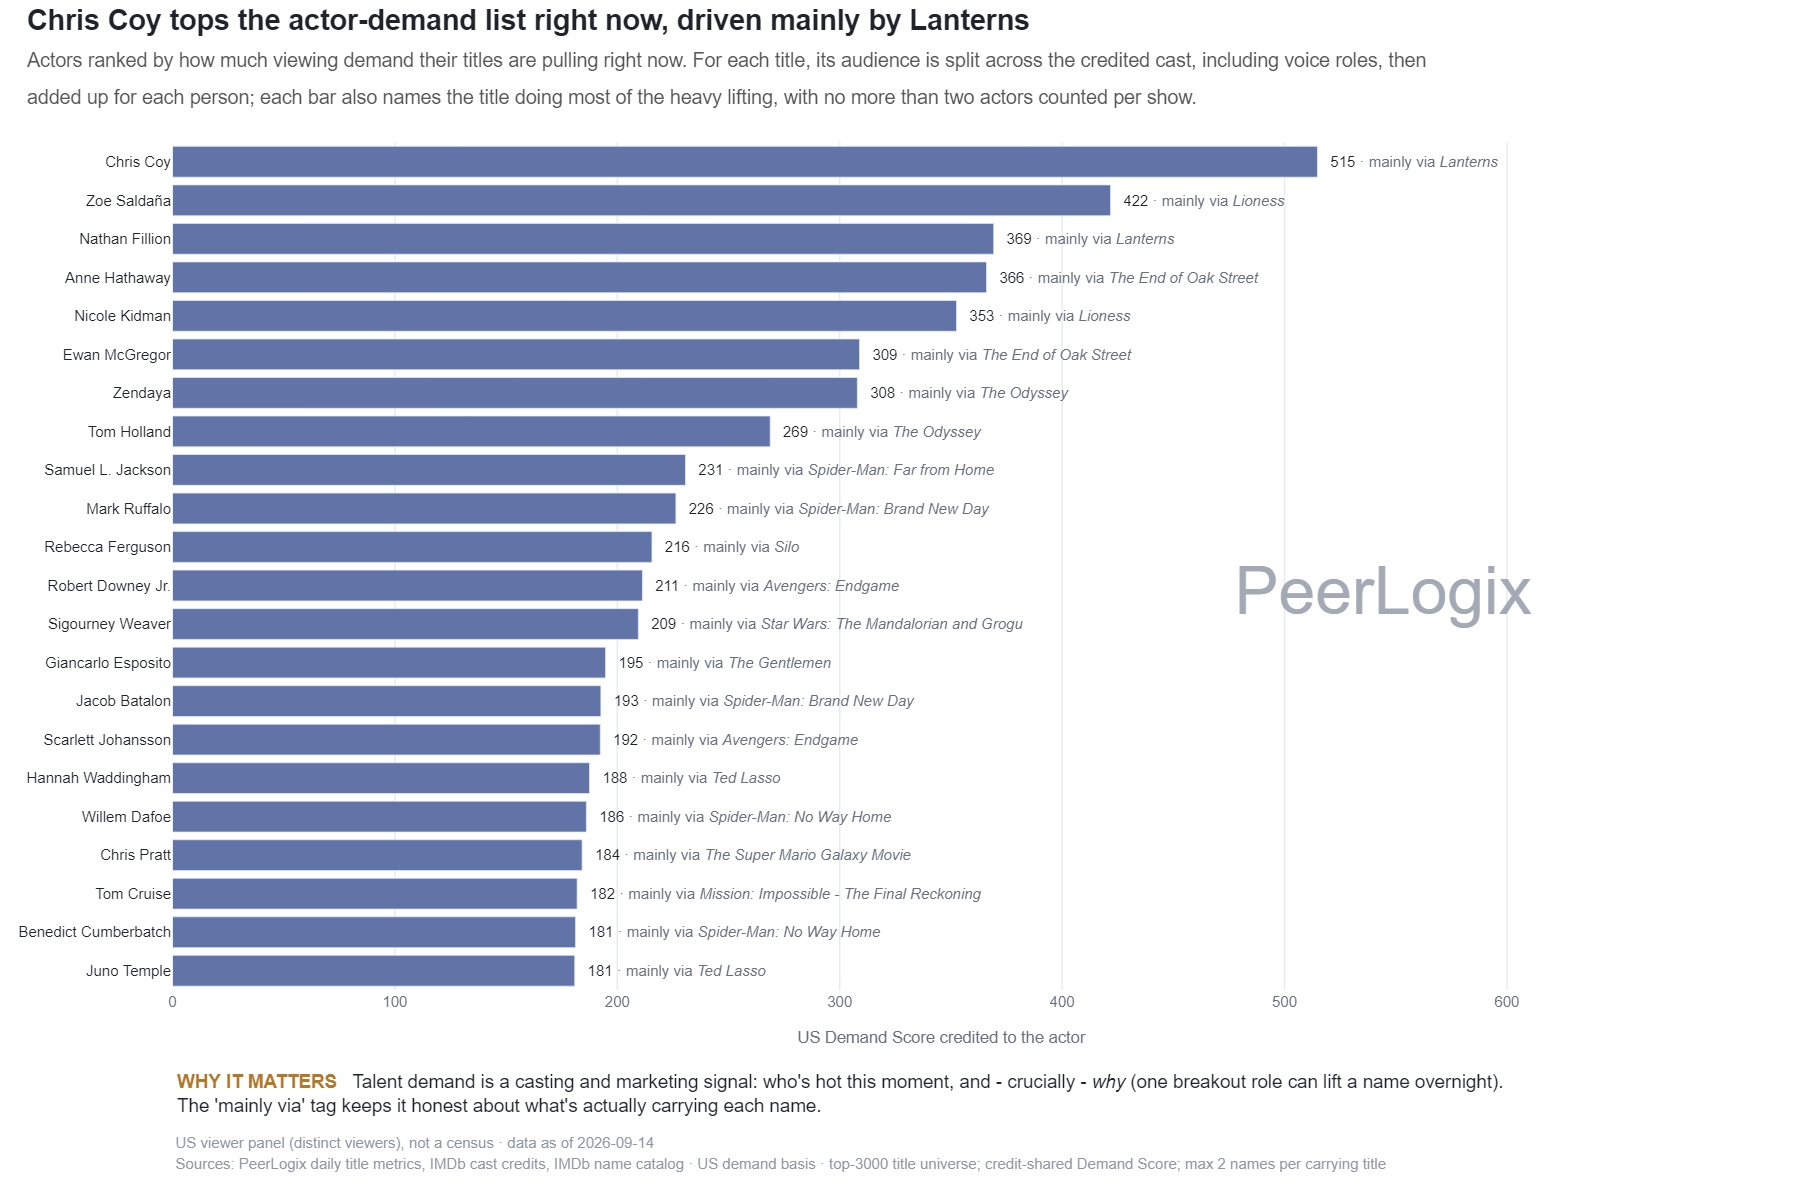
Talent & Studios weekly
Actor rankings from allocated title demand
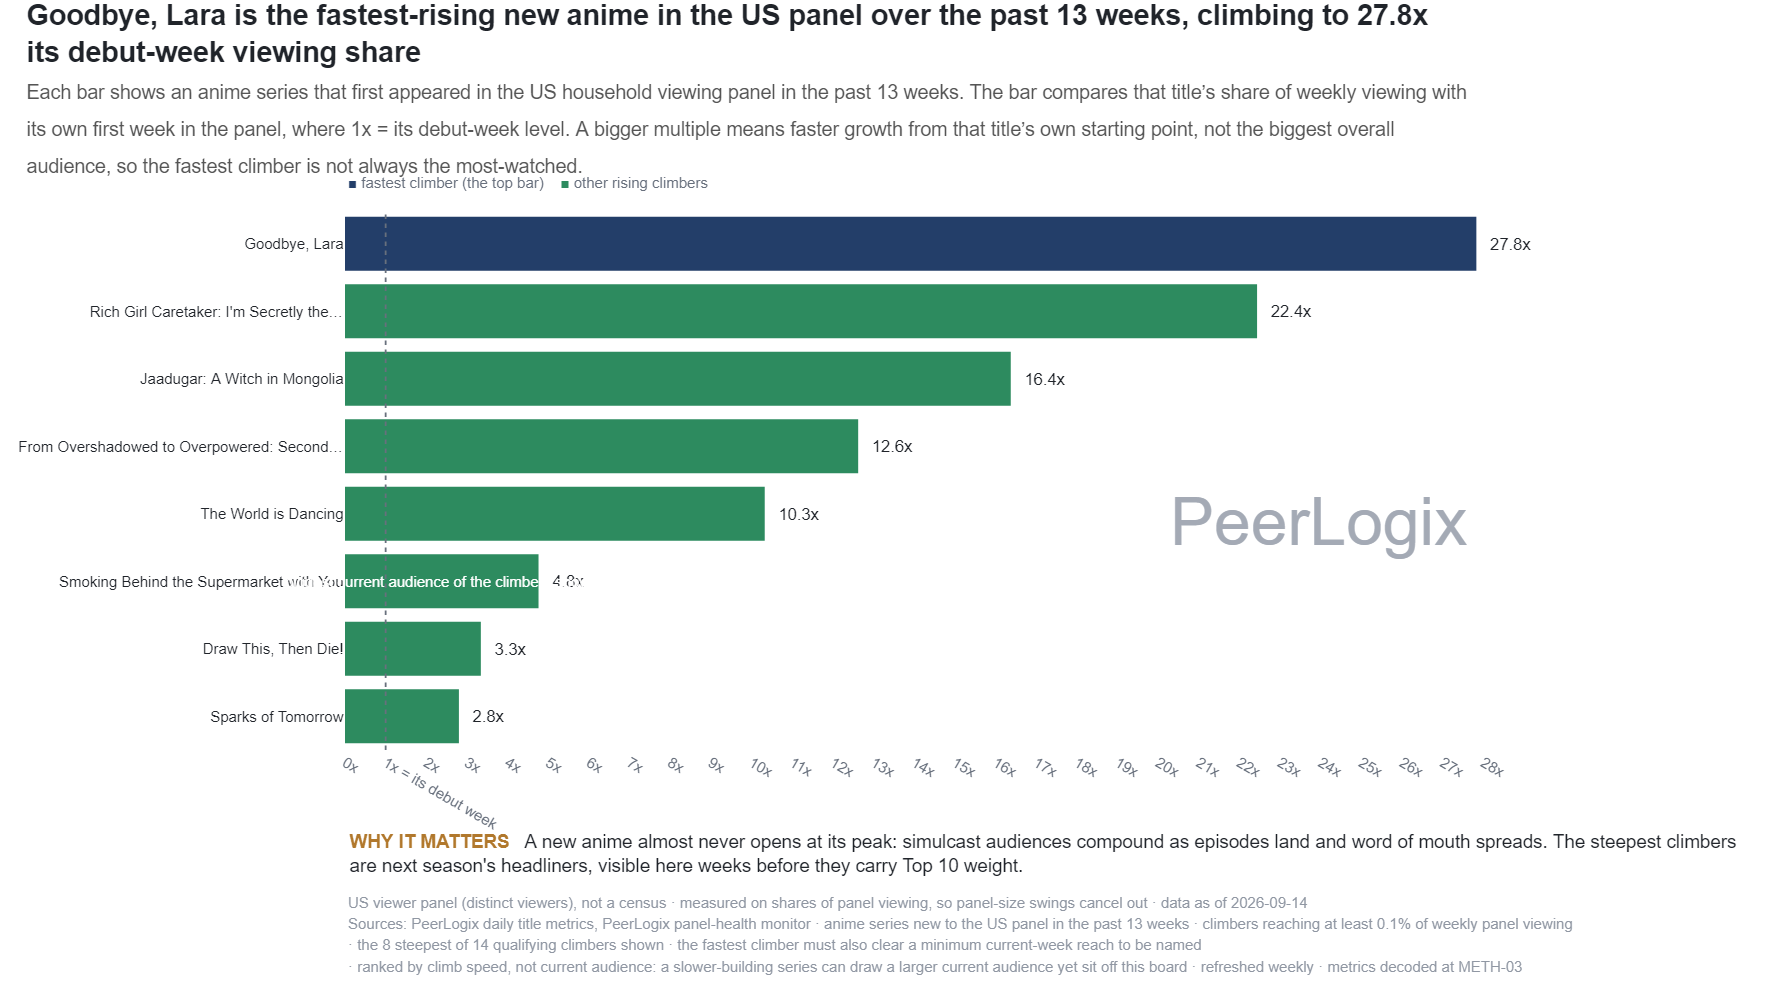
Anime Pulse weekly
Anime viewing momentum relative to its first observed week
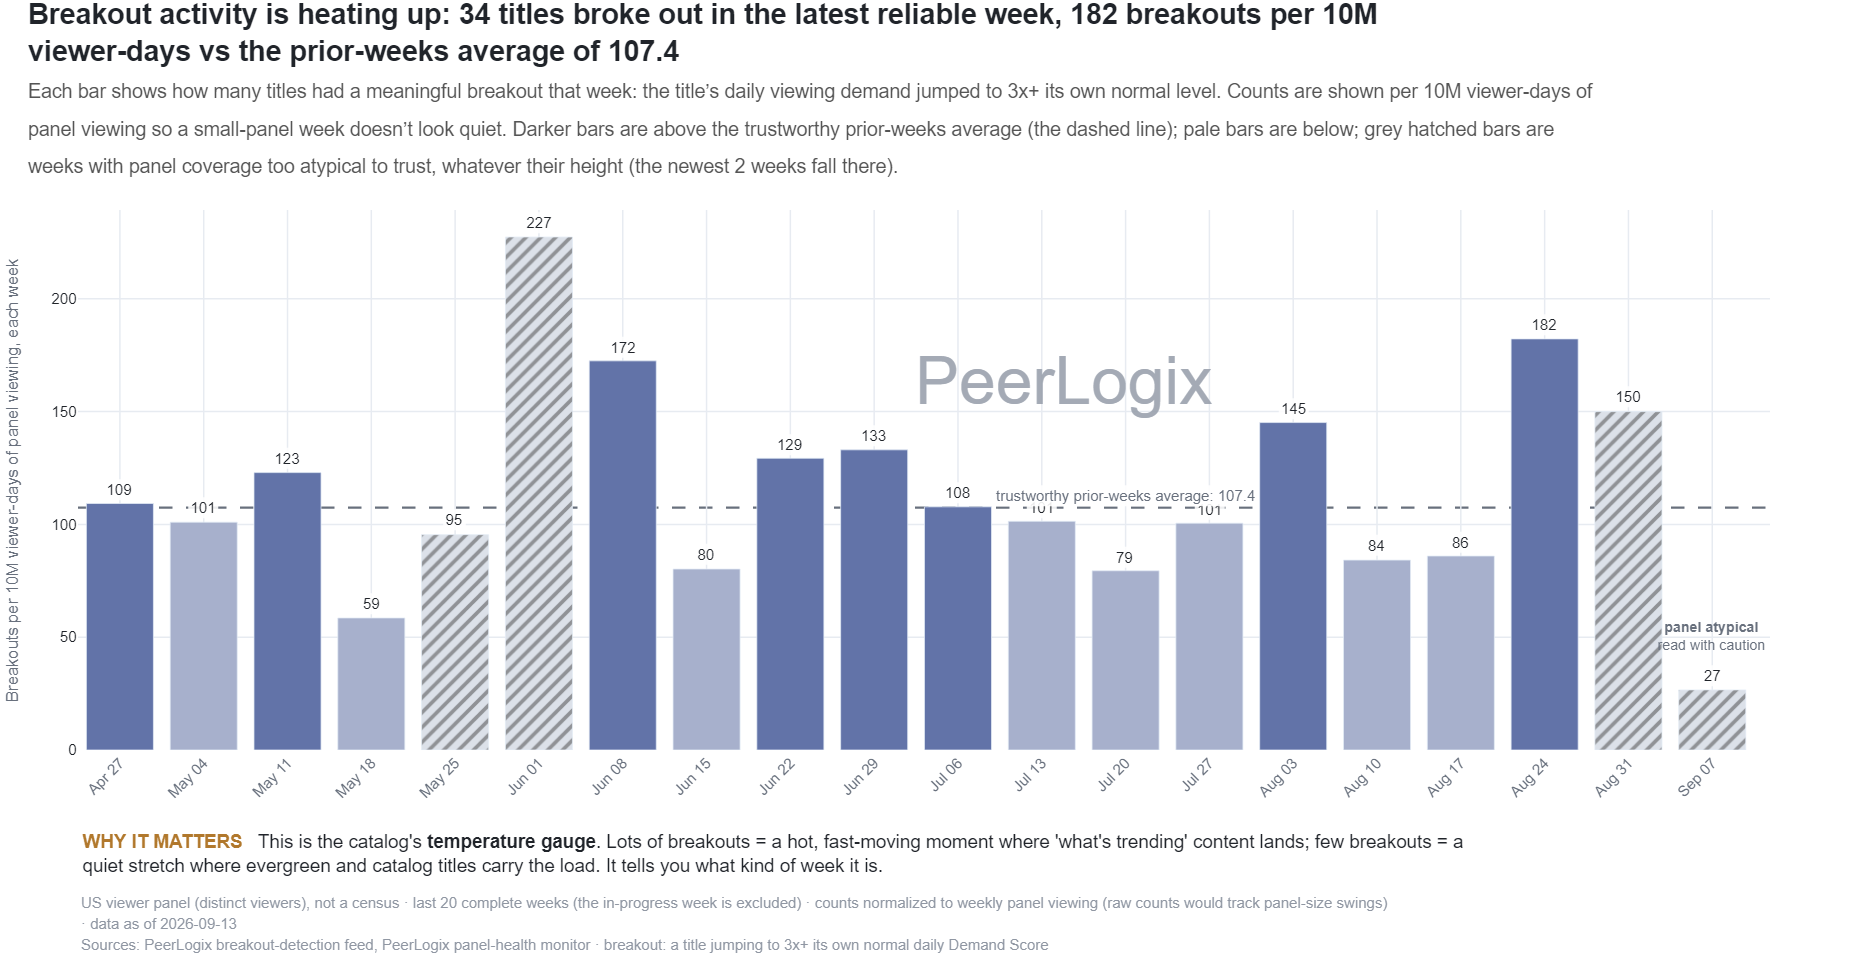
Spikes & Breakouts weekly
Detected streaming breakouts by week
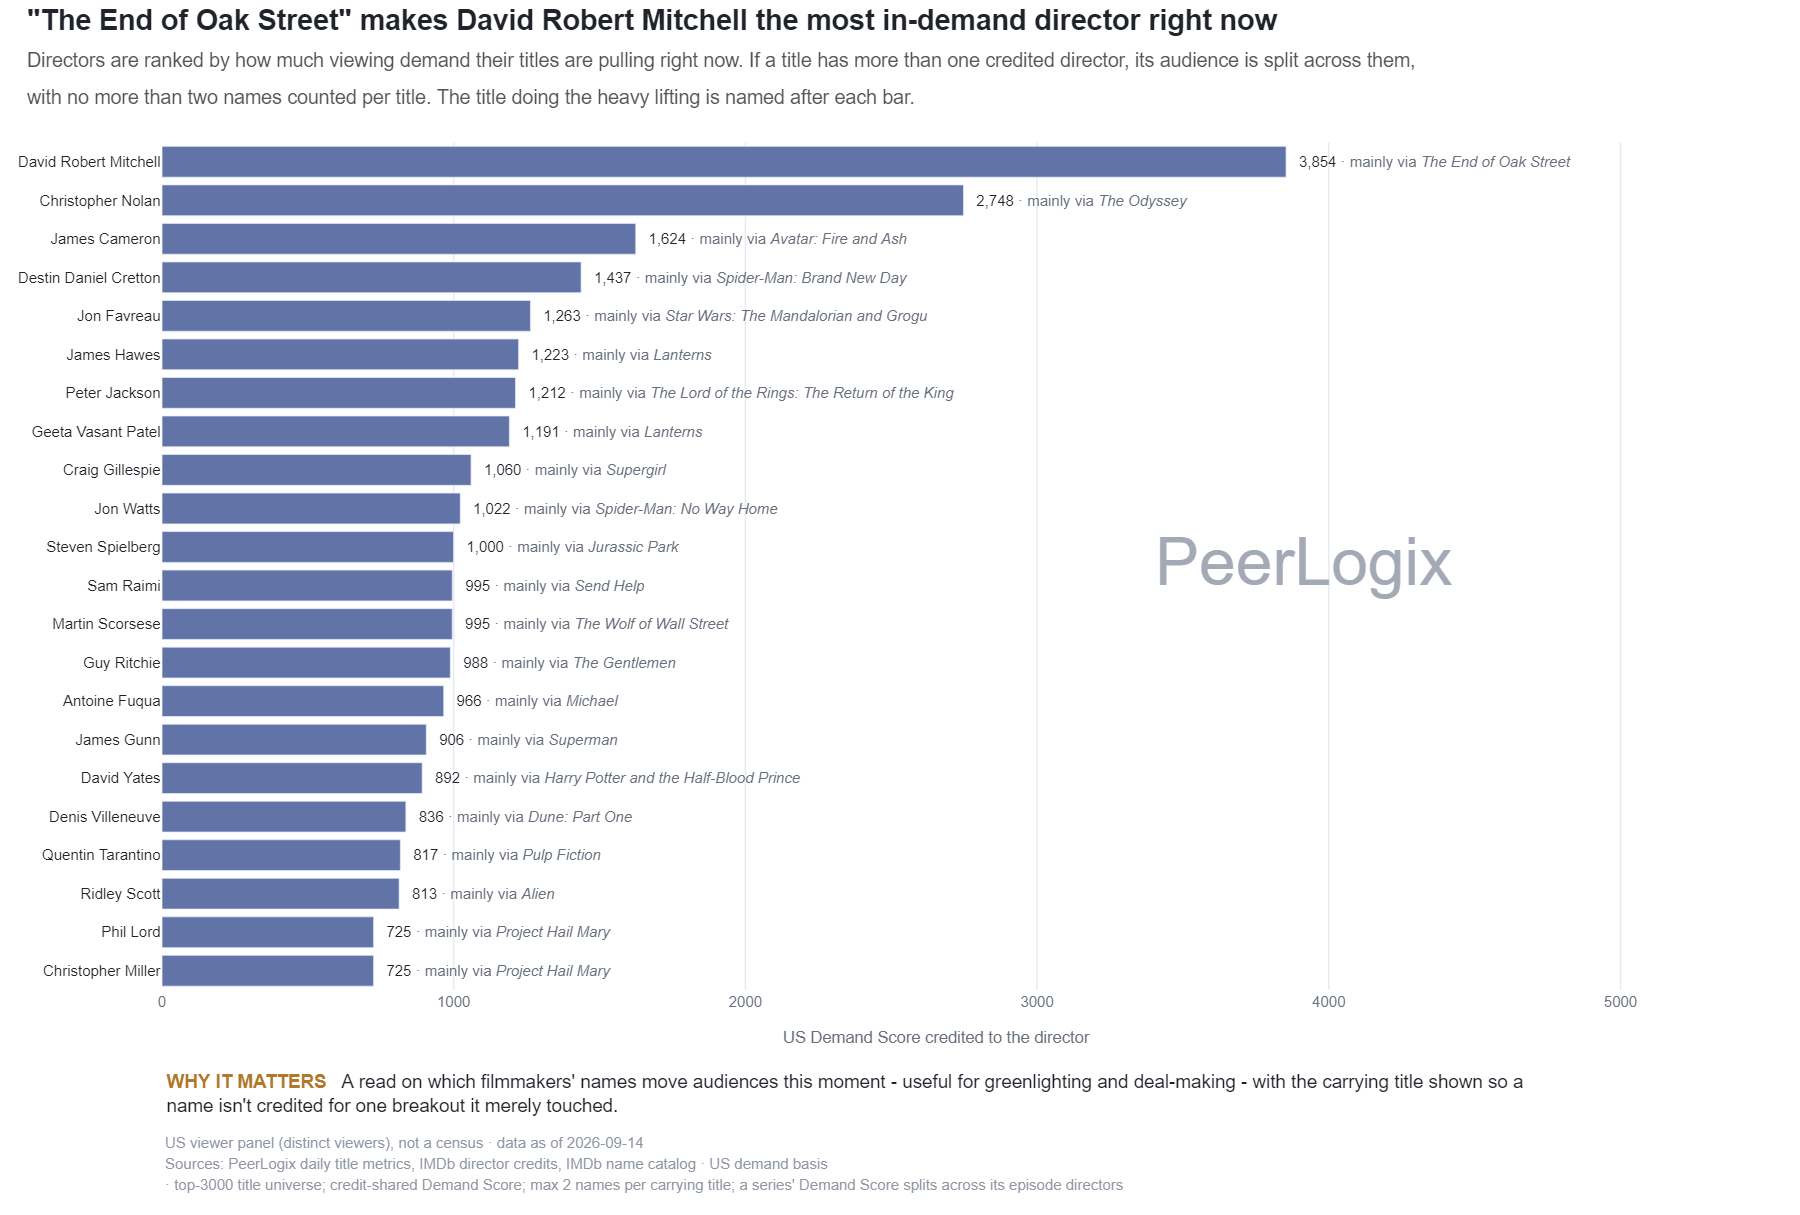
Talent & Studios weekly
Director rankings from allocated title demand
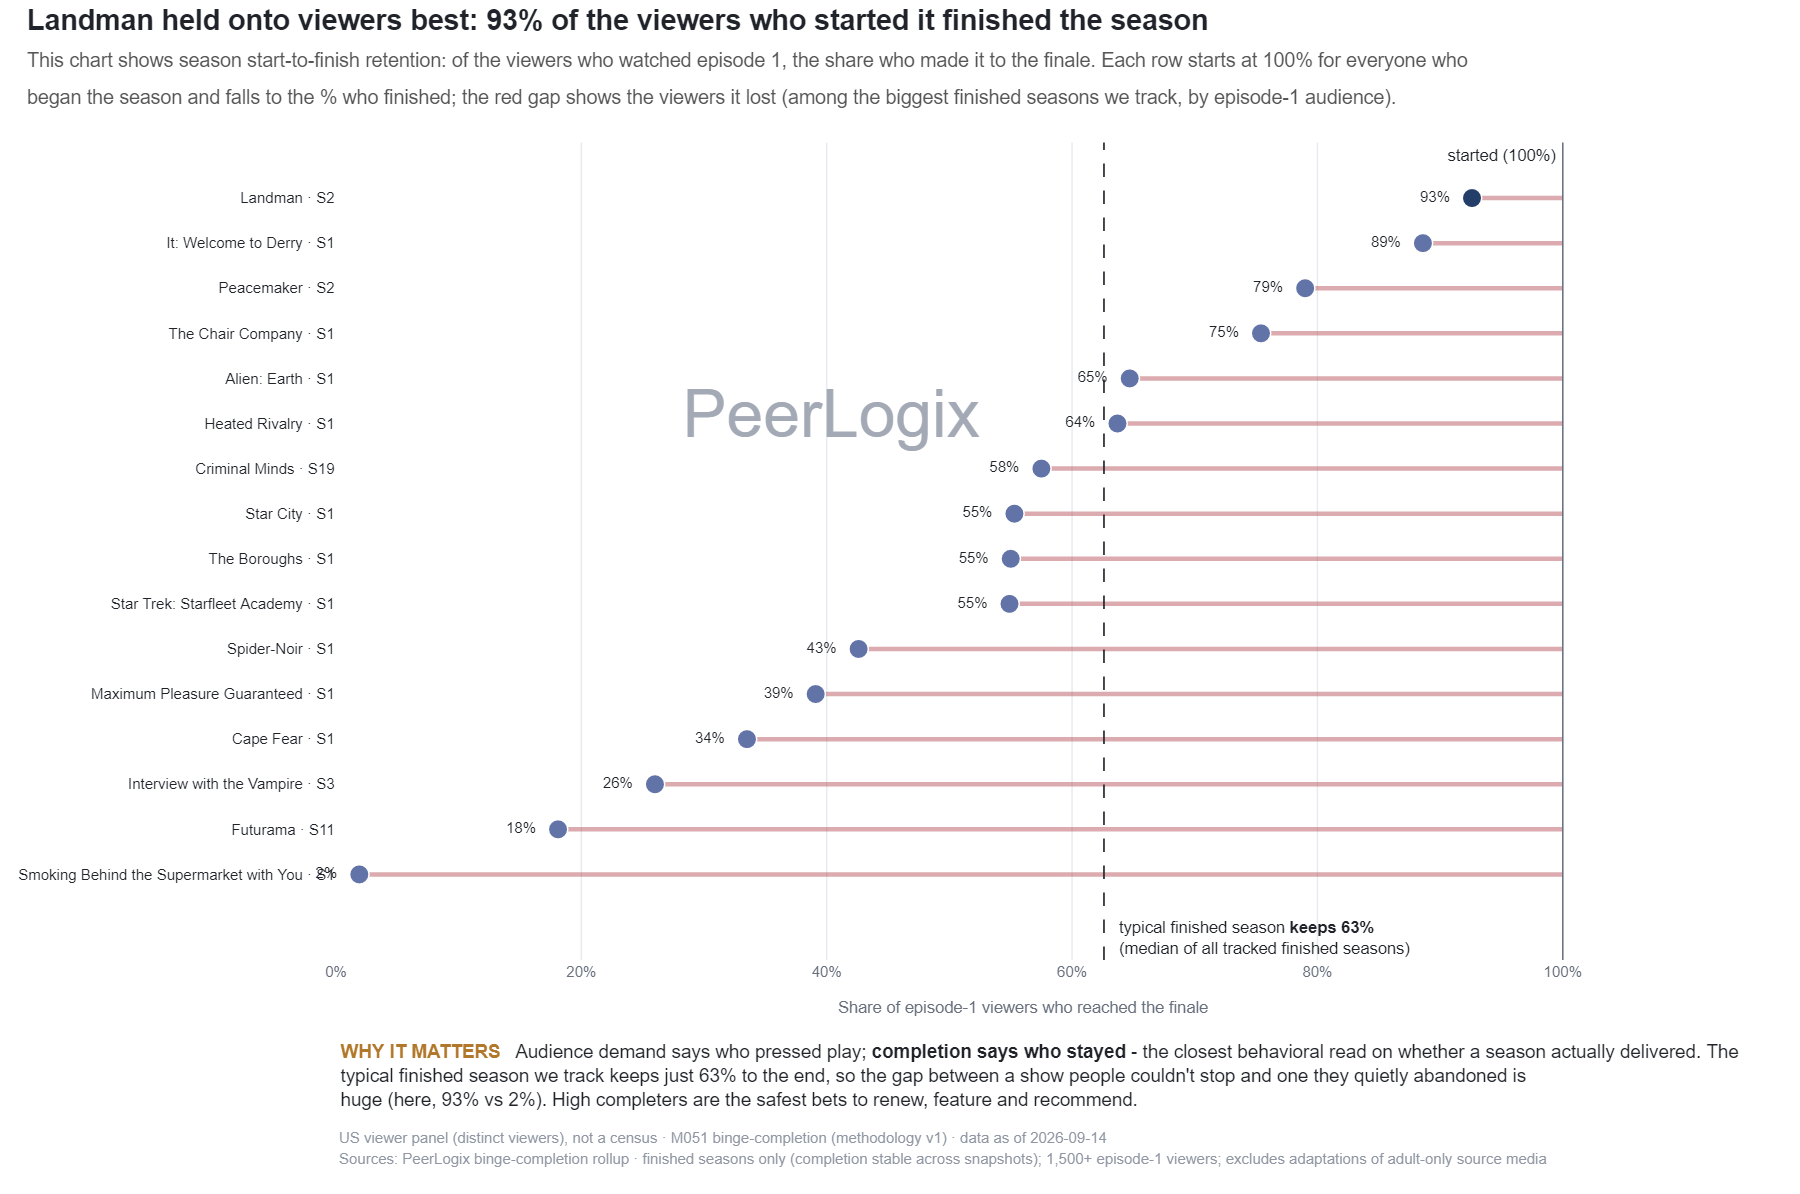
Engagement & Stickiness weekly
Episode-one to finale viewing ratios for selected seasons
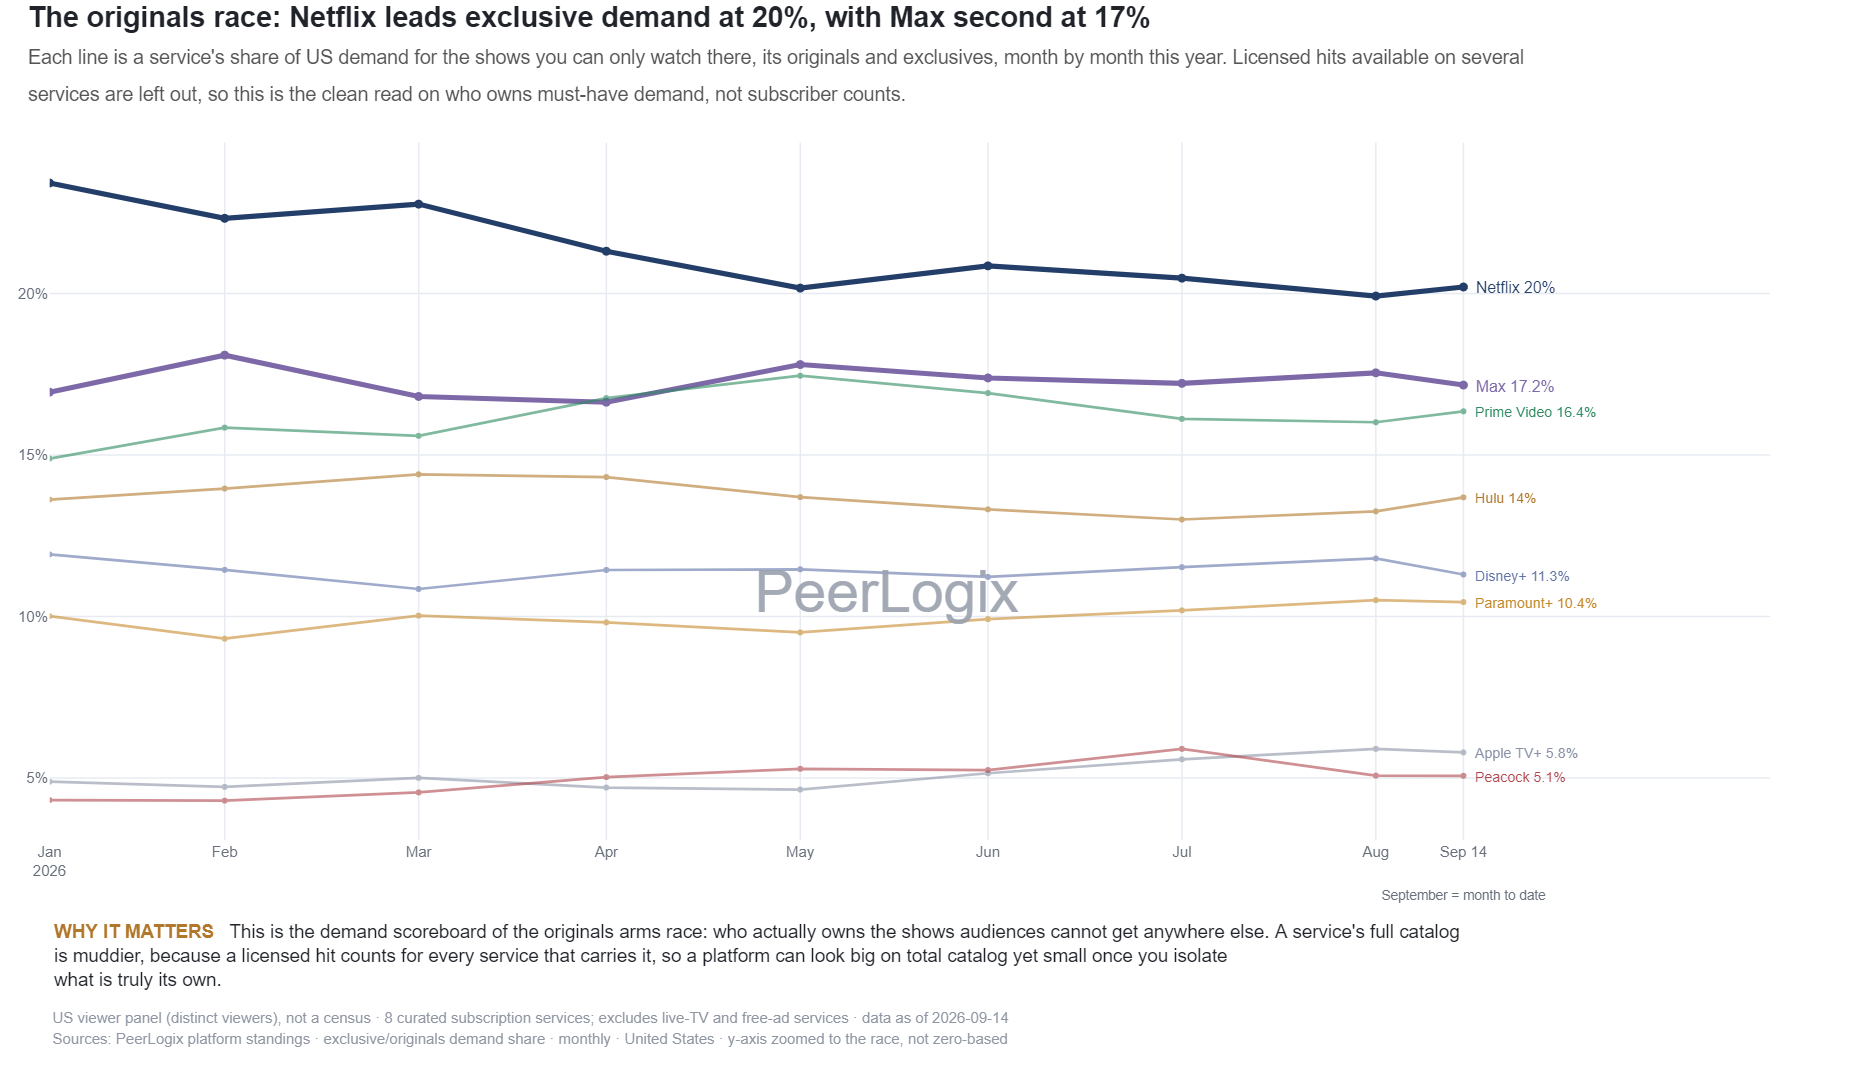
Trackers & Standings weekly
Exclusive-title viewing demand across eight streaming catalogs
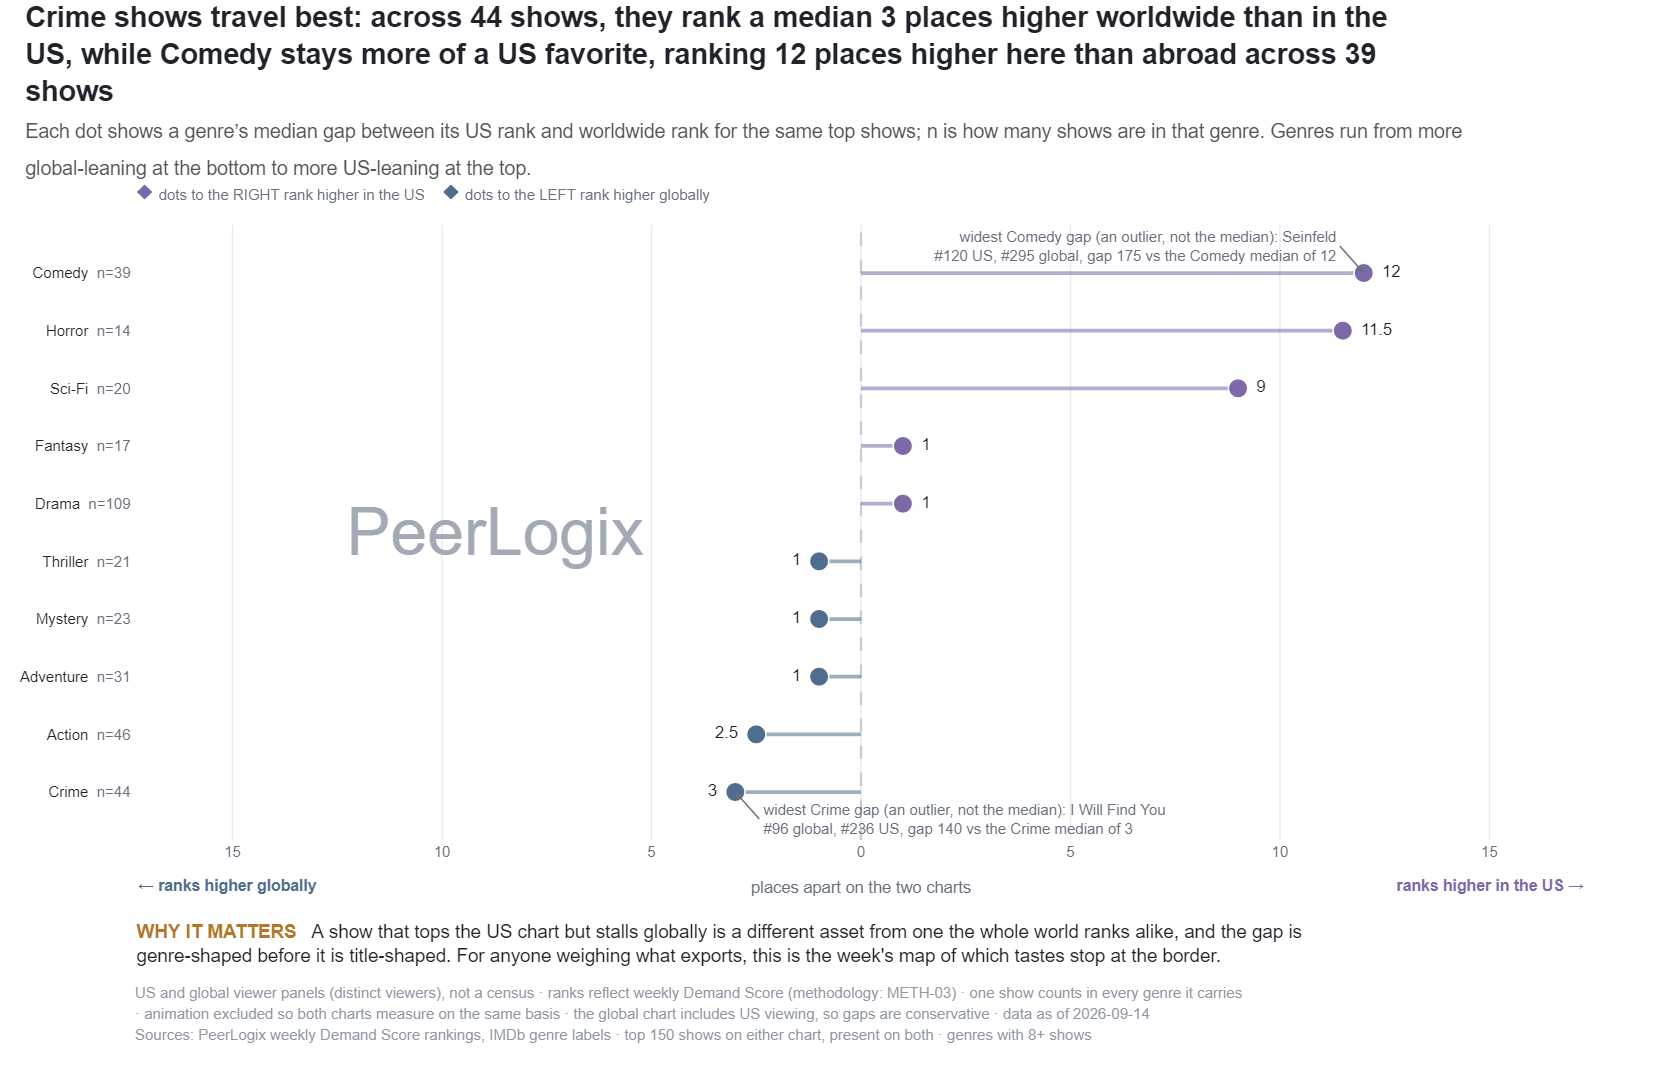
Global & Local Demand weekly
Genre differences between U.S. and global title ranks
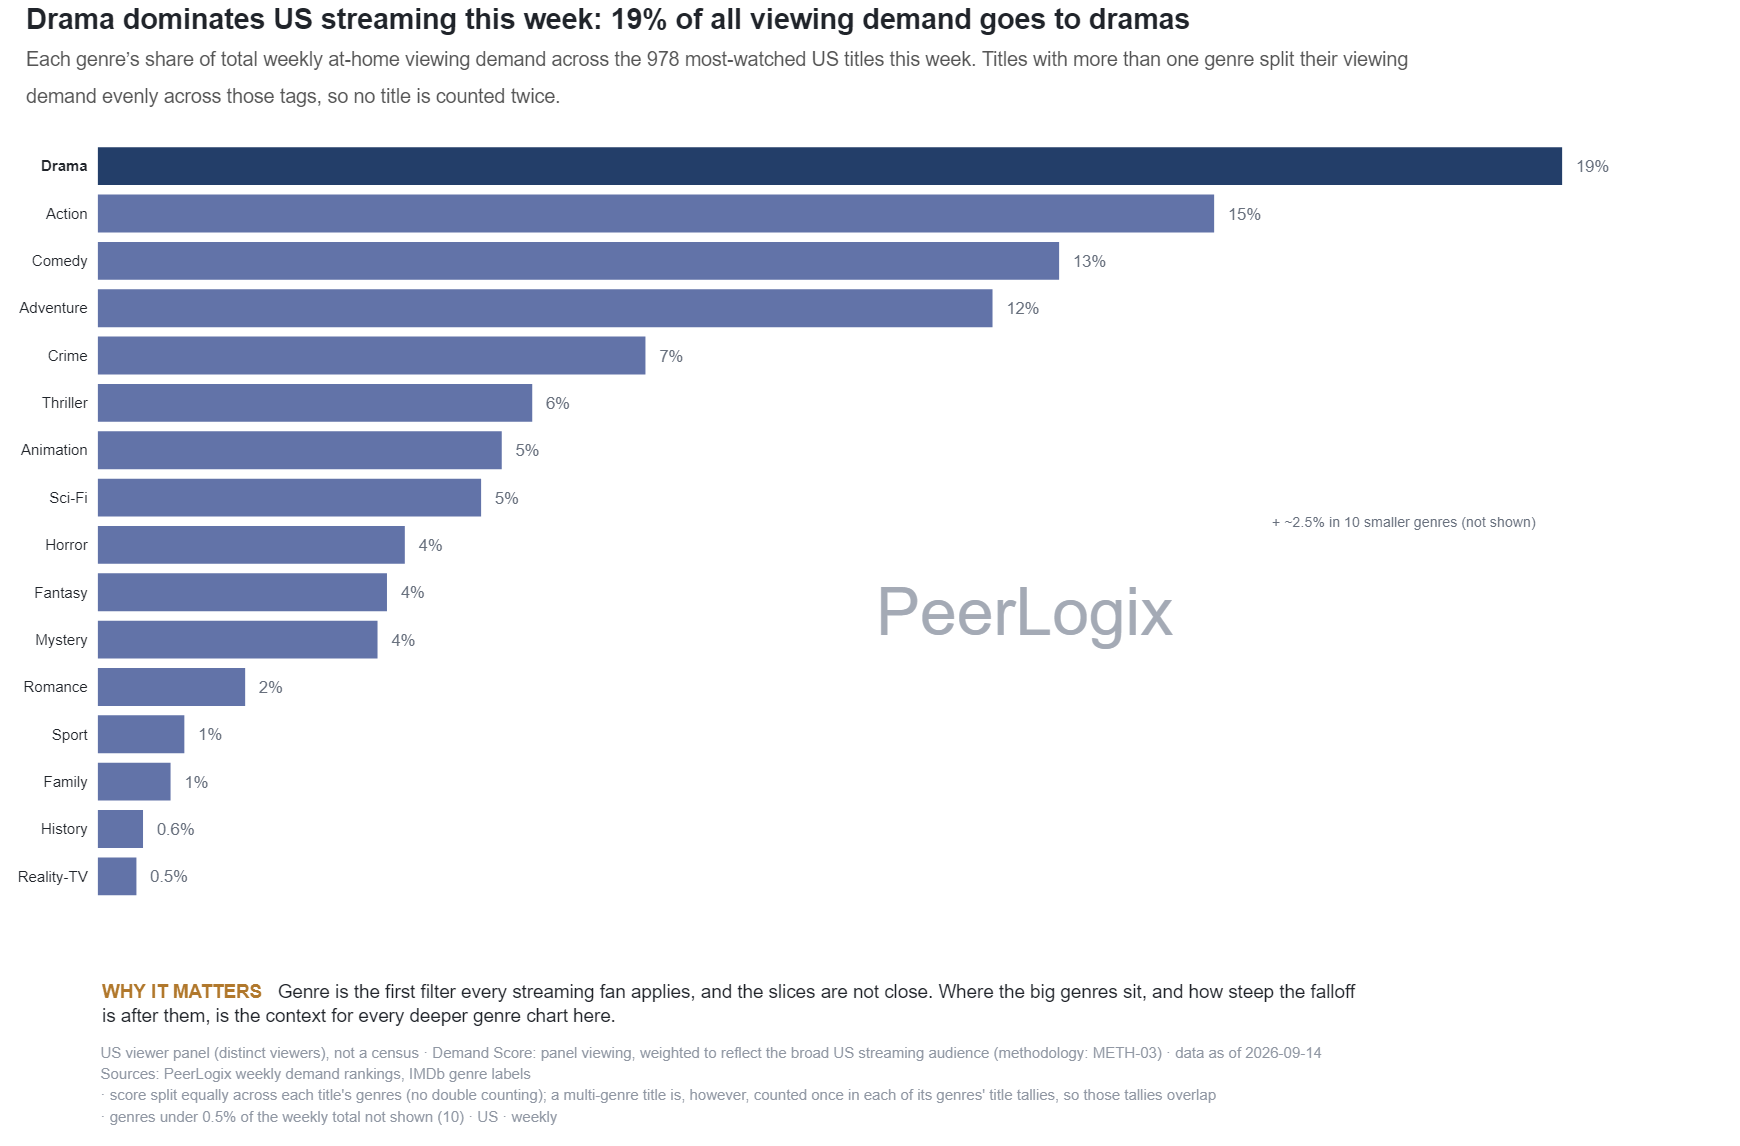
Genres & Taste weekly
Genre shares of weekly U.S. panel demand
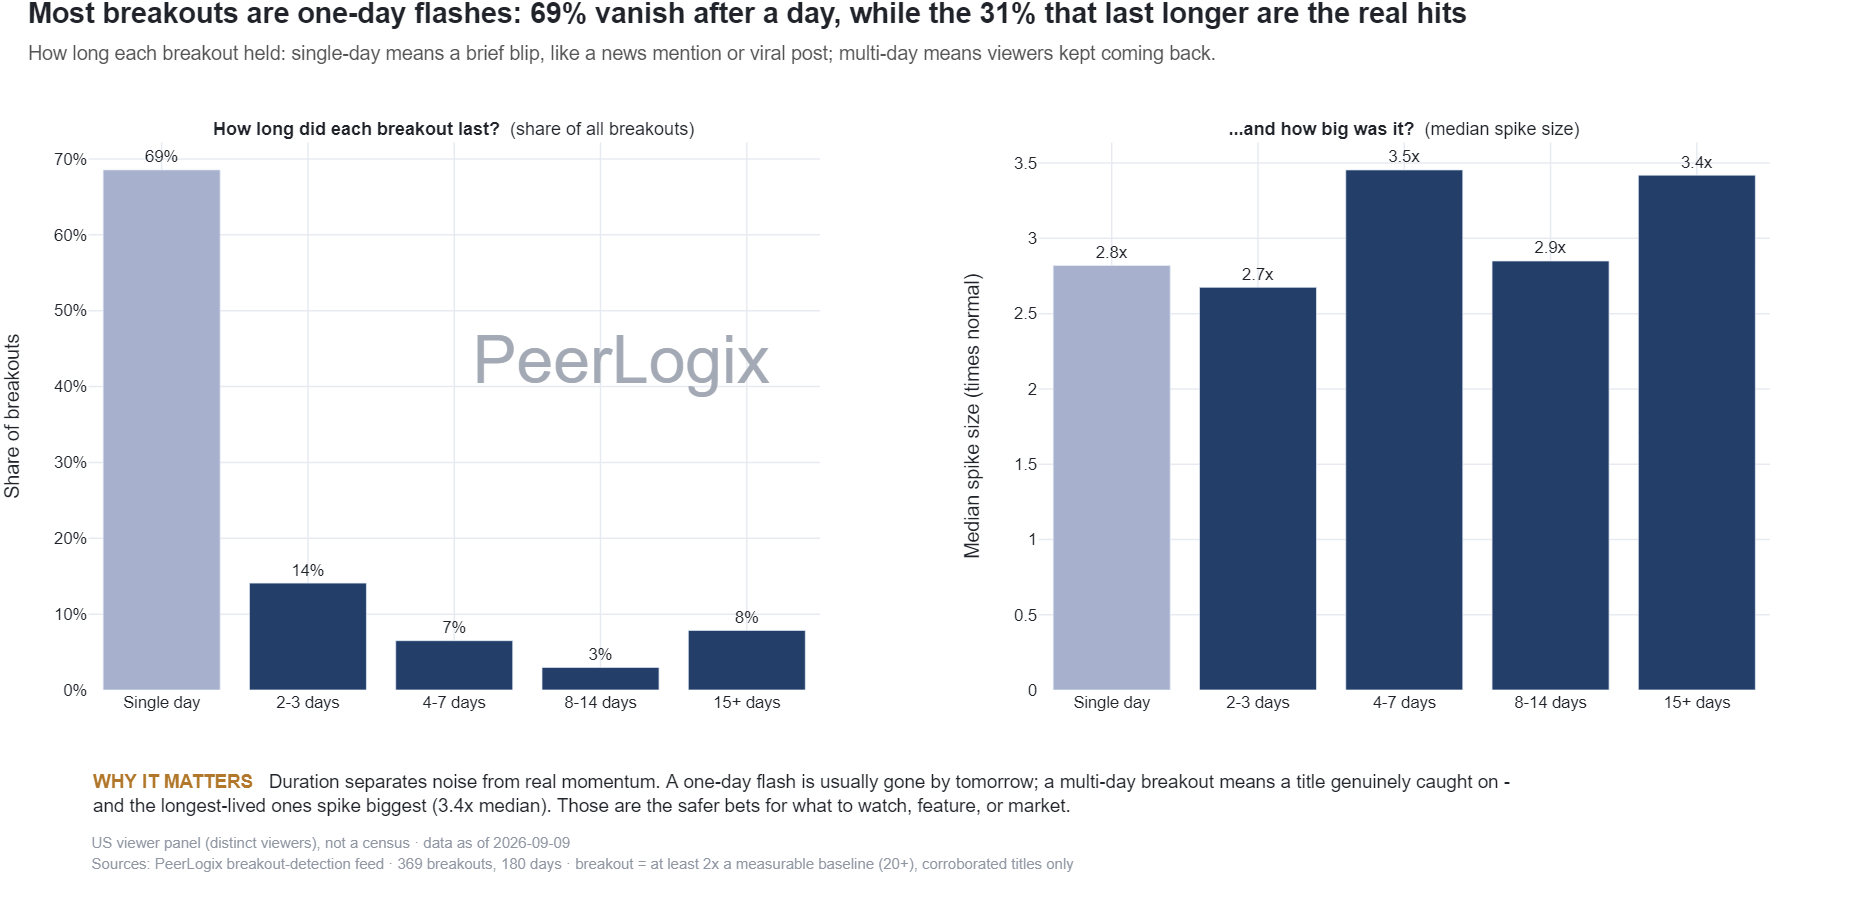
Spikes & Breakouts weekly
How long detected streaming breakouts last
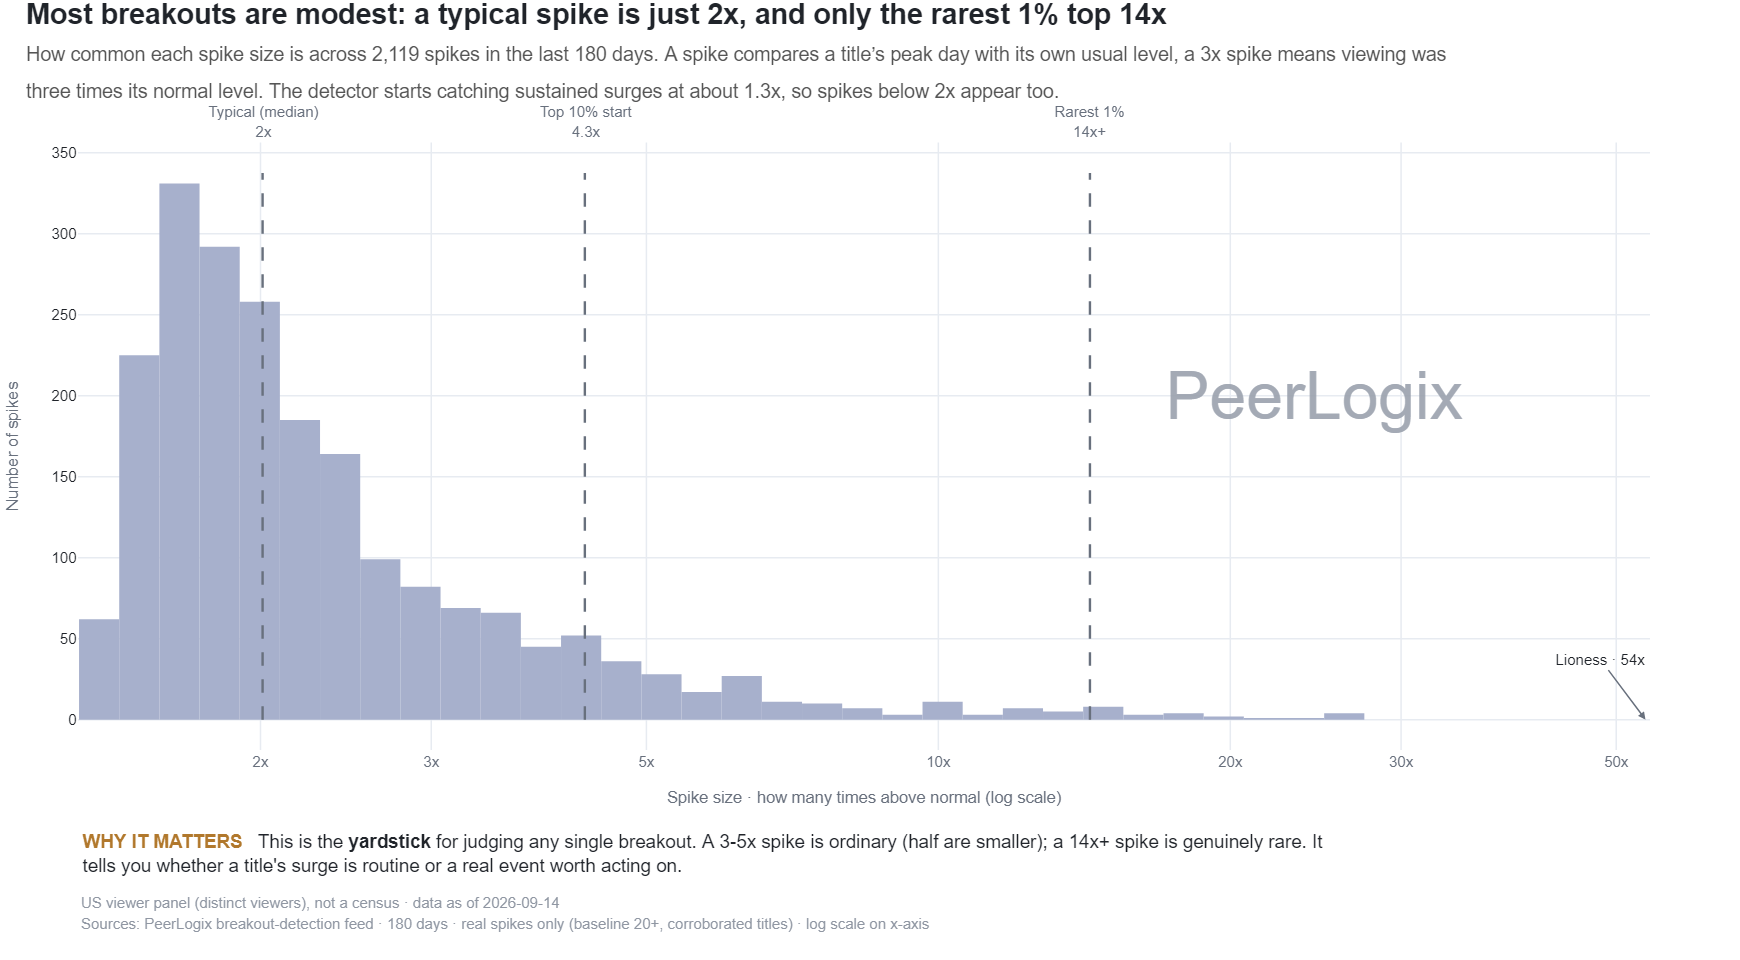
Spikes & Breakouts weekly
How often different sizes of streaming spike occur
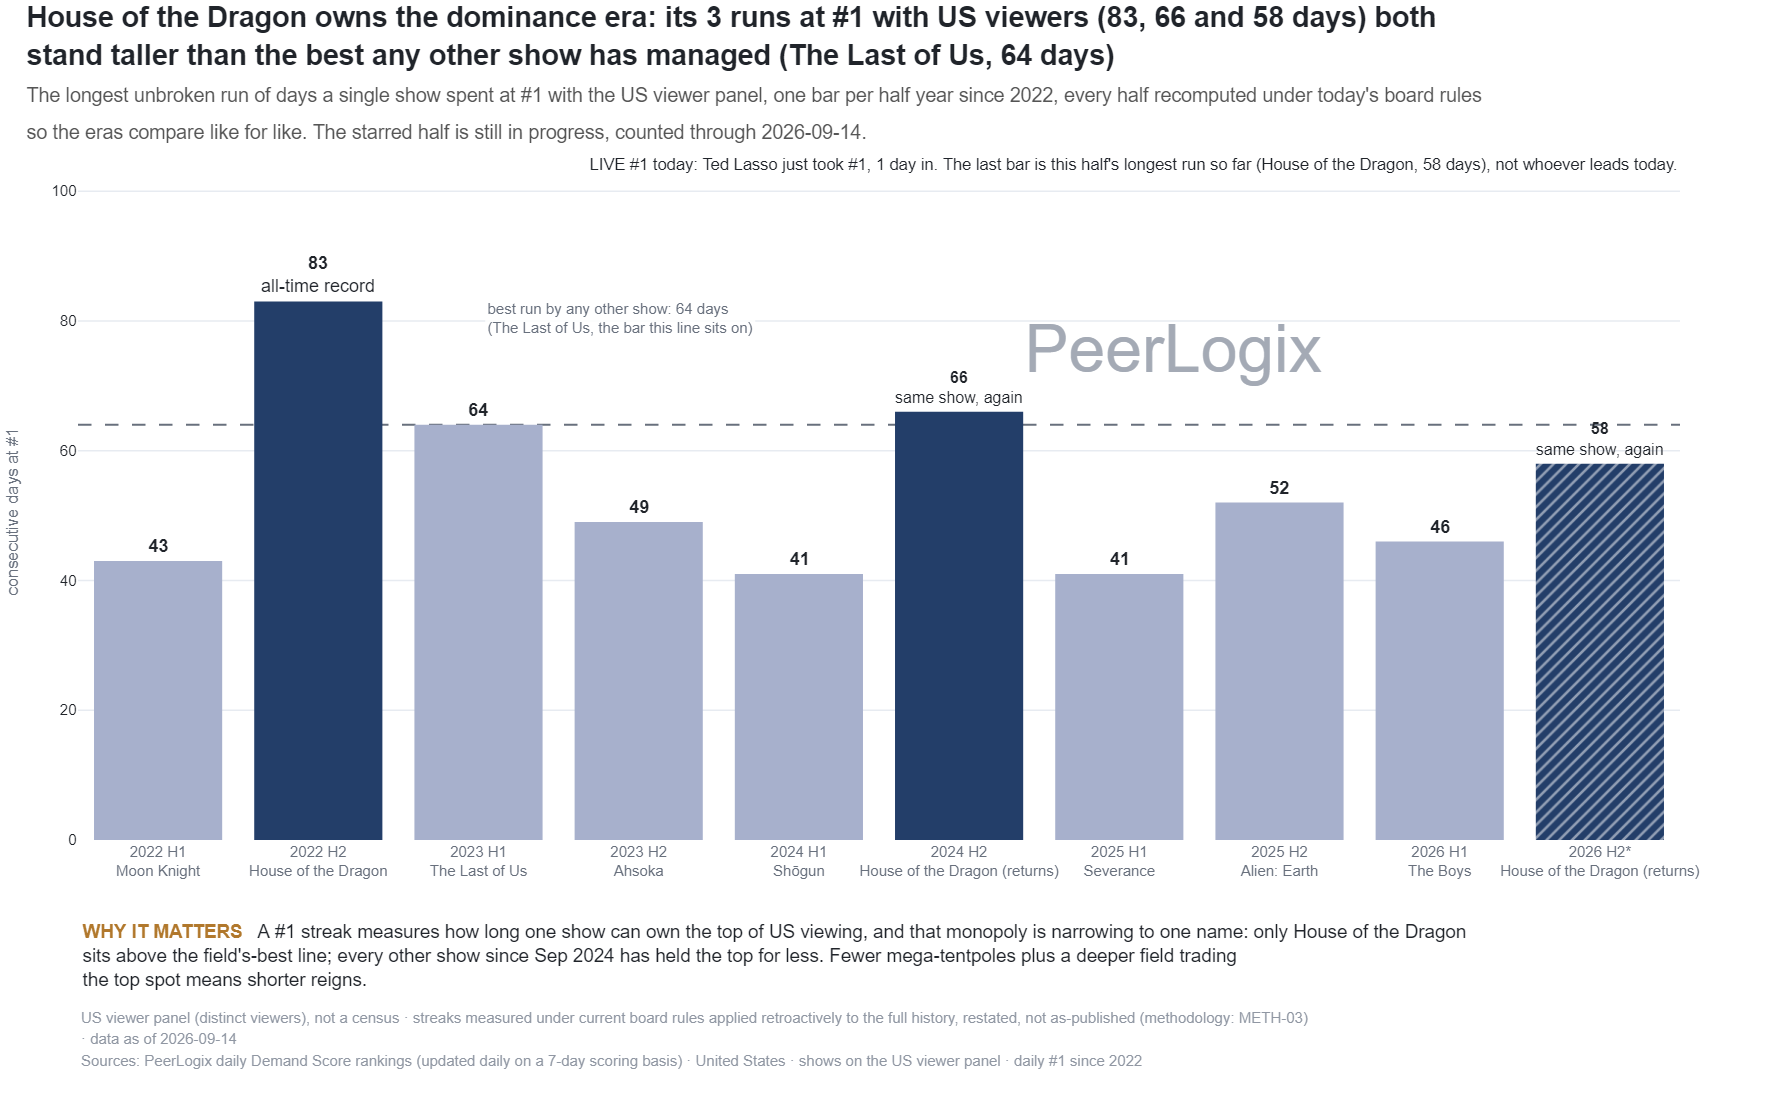
Trackers & Standings weekly
Longest runs at number one in the U.S. panel
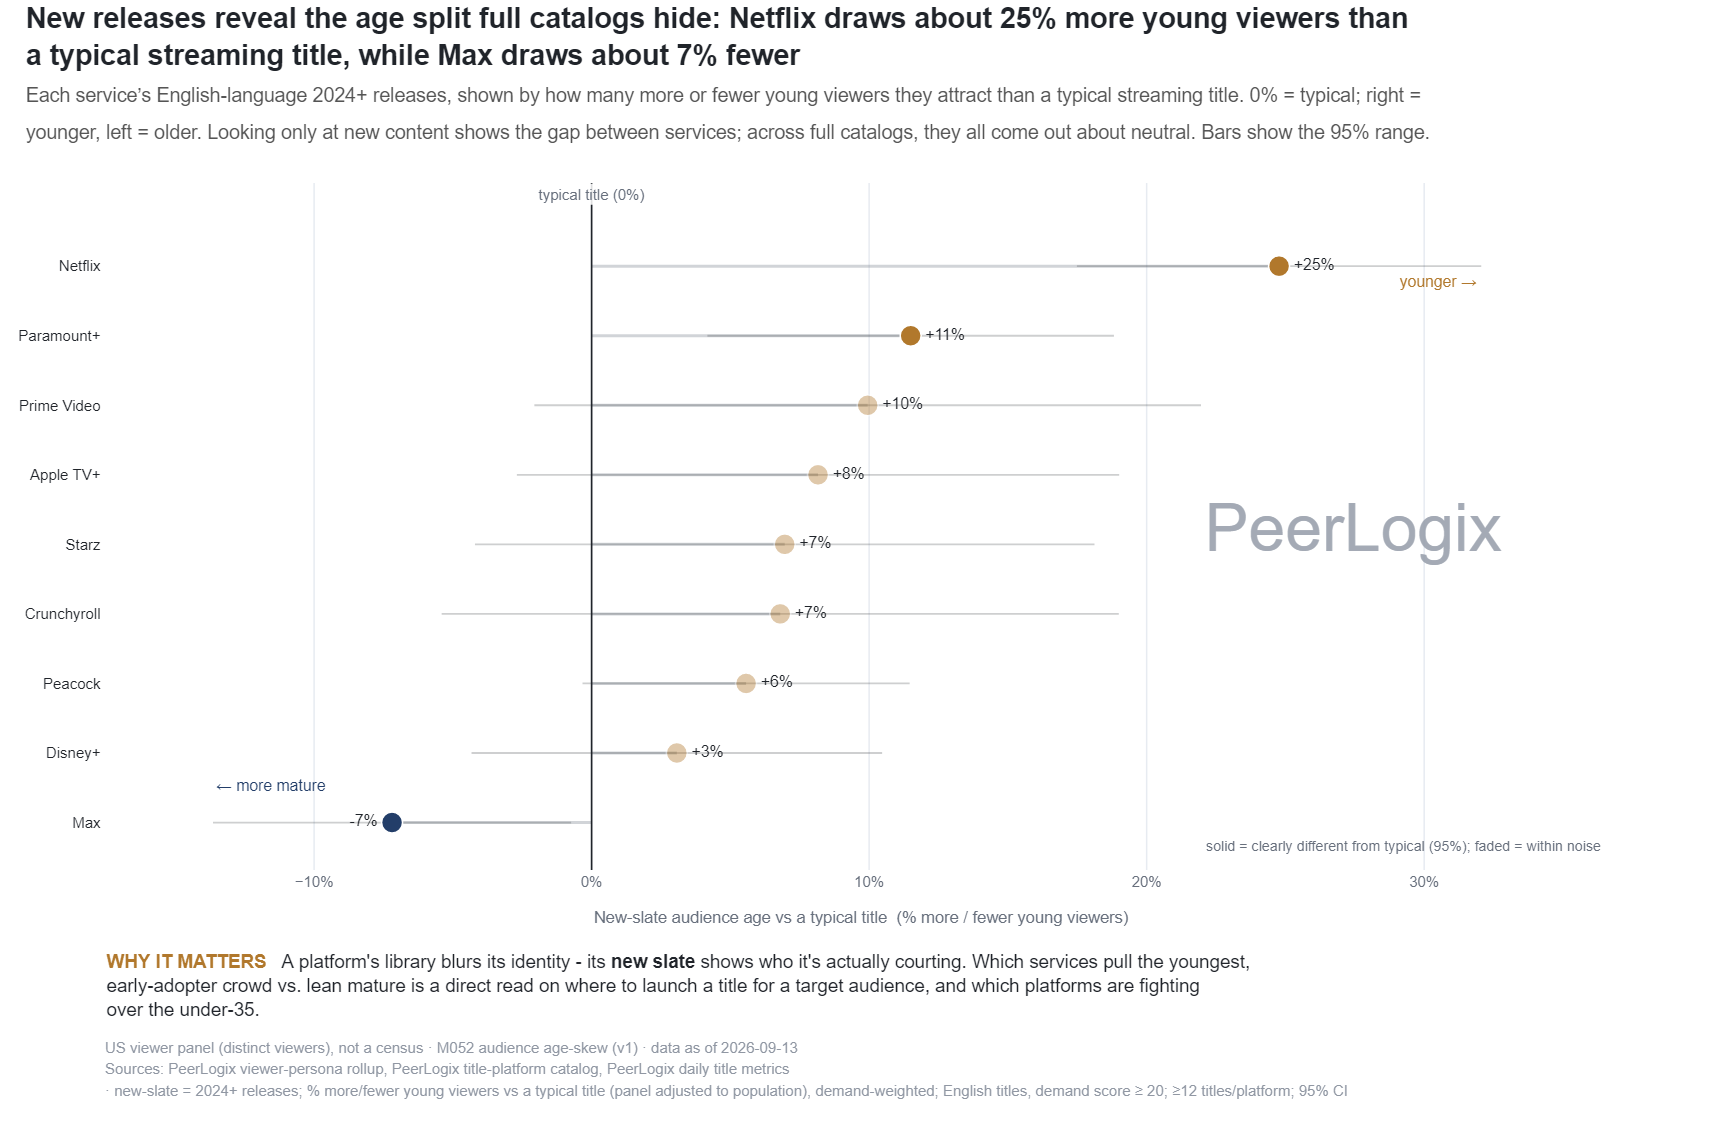
Audience & Demographics weekly
Modeled age skew of recent streaming catalog releases
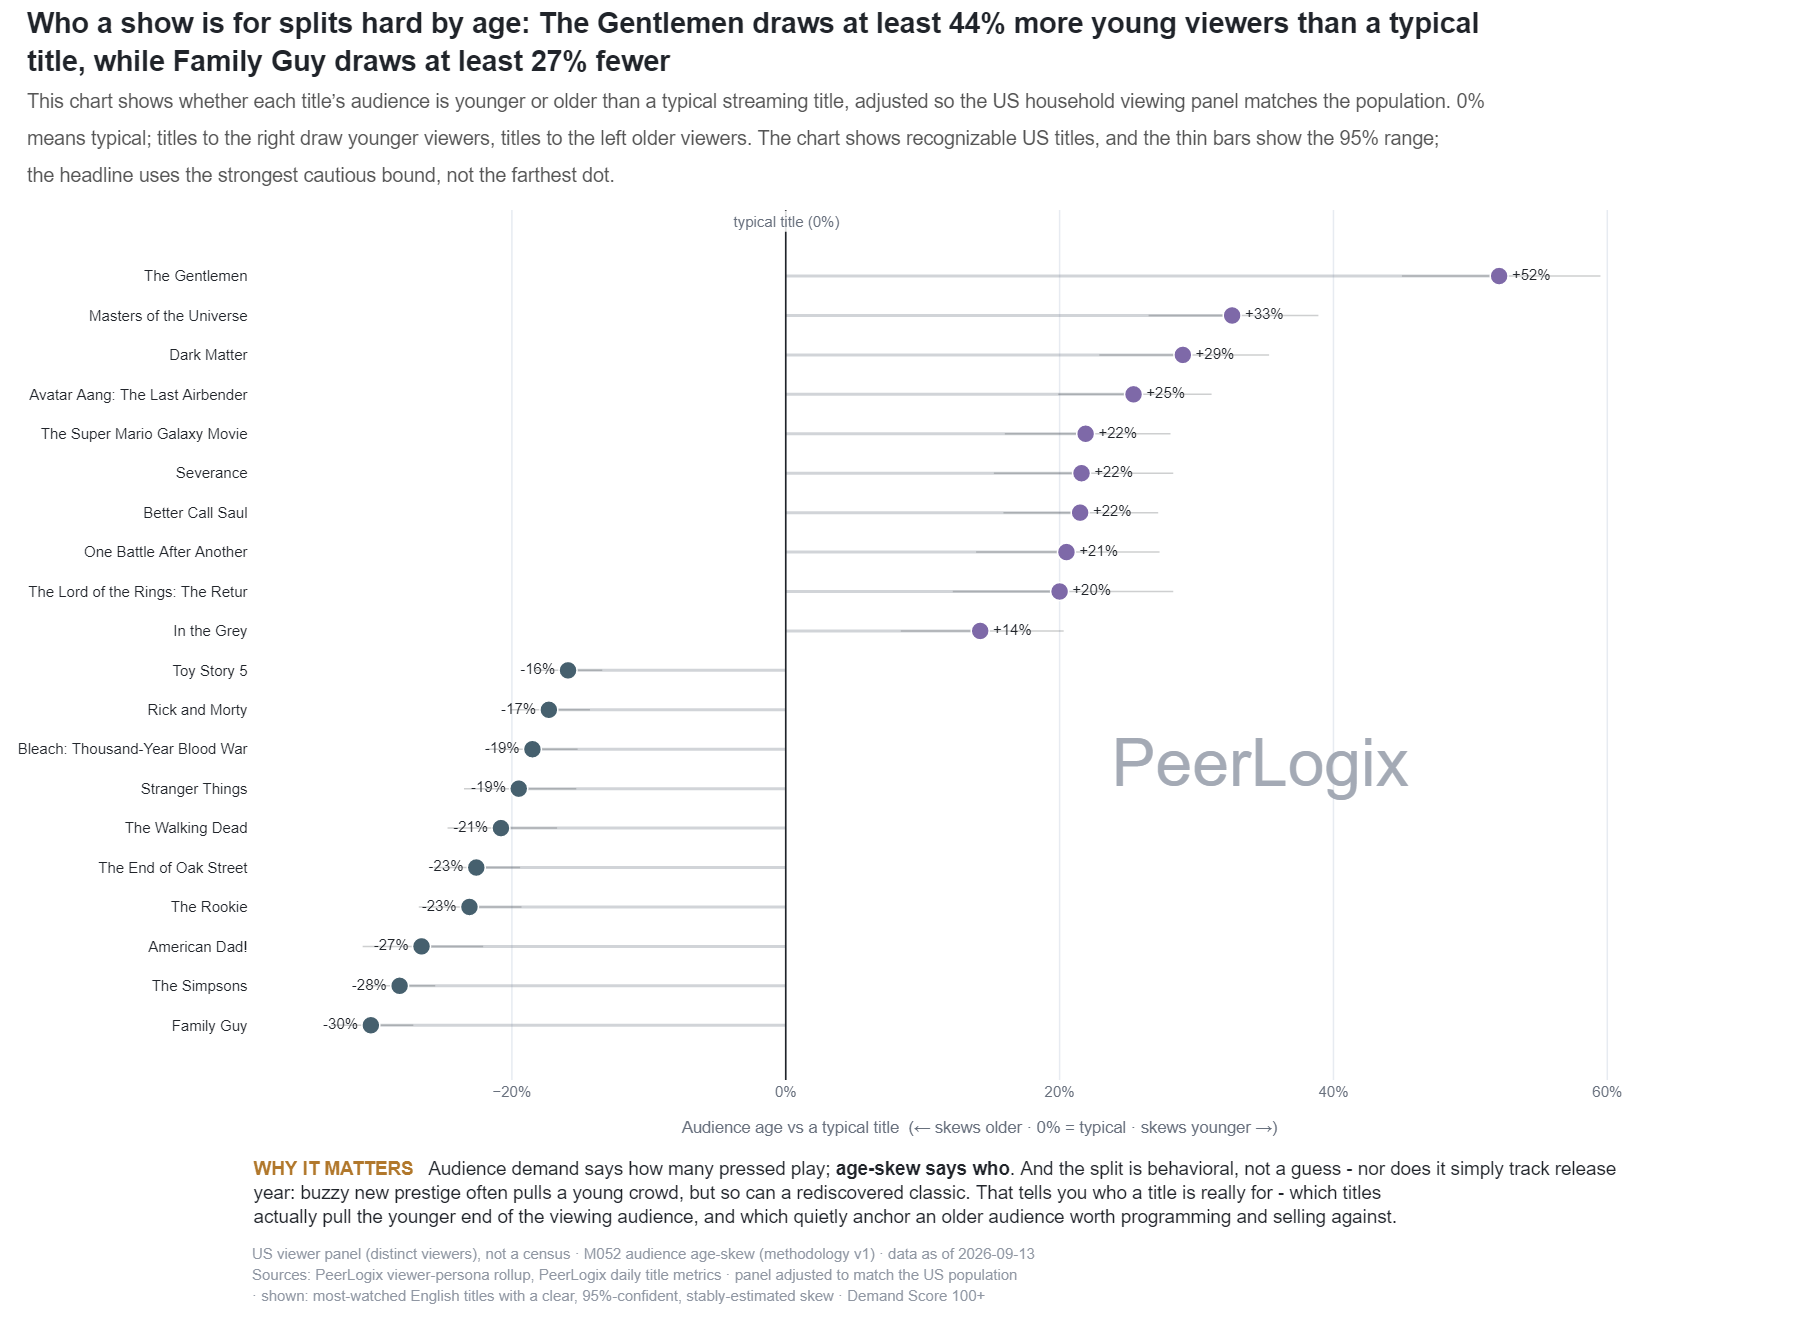
Audience & Demographics weekly
Modeled audience age skew for selected streaming titles
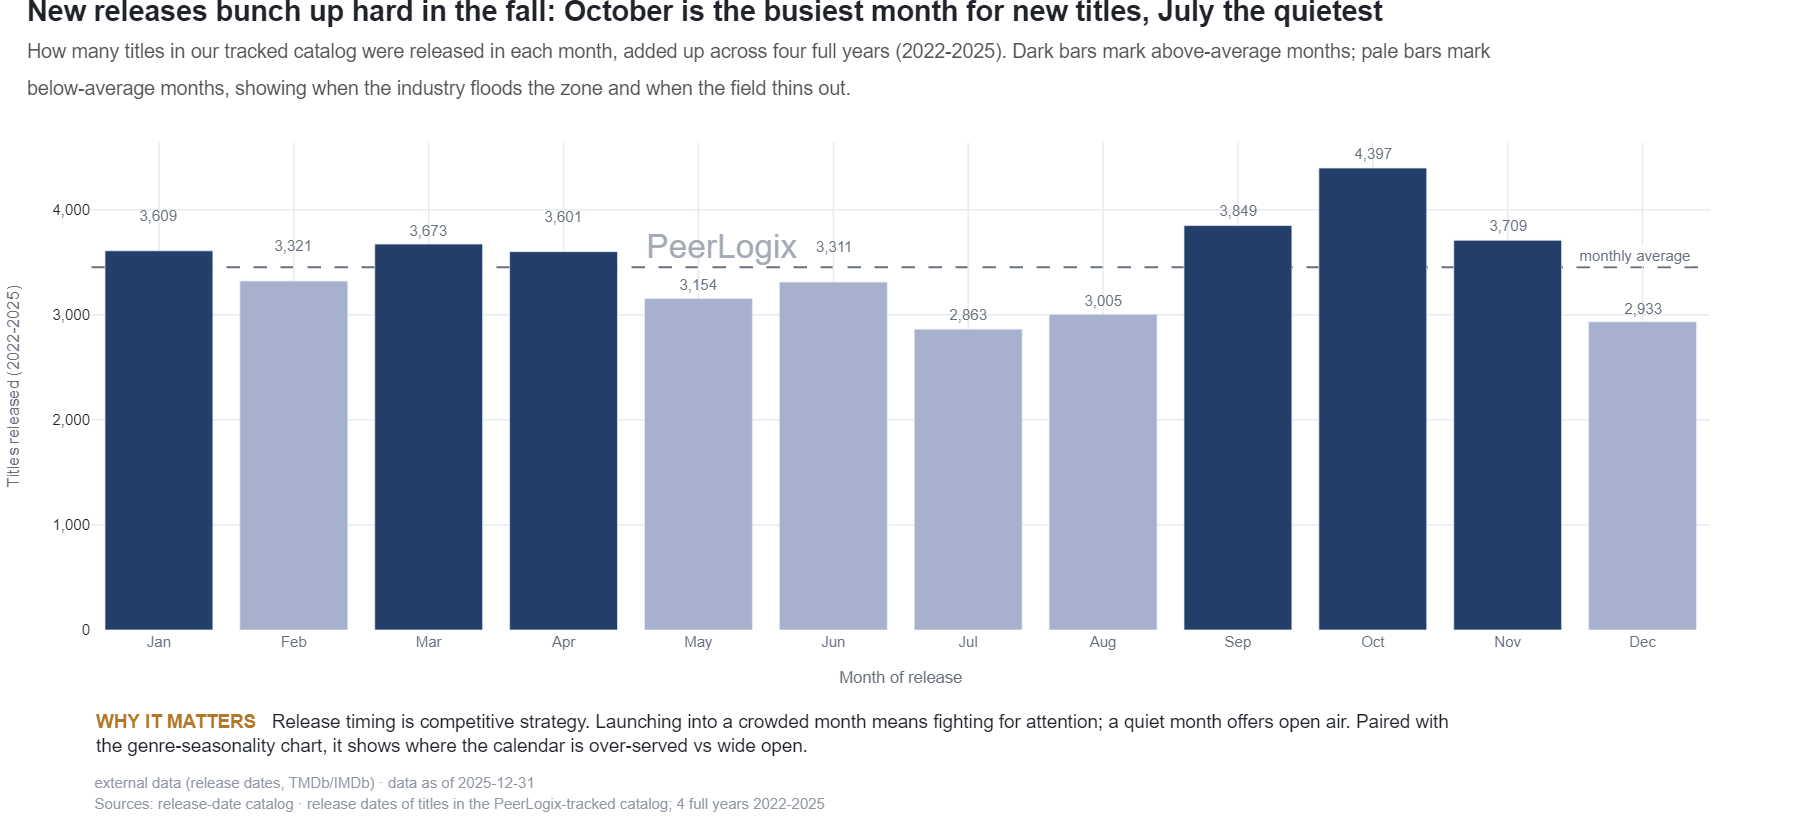
Calendar & Seasonality weekly
Monthly movie and TV release counts, 2022–2025
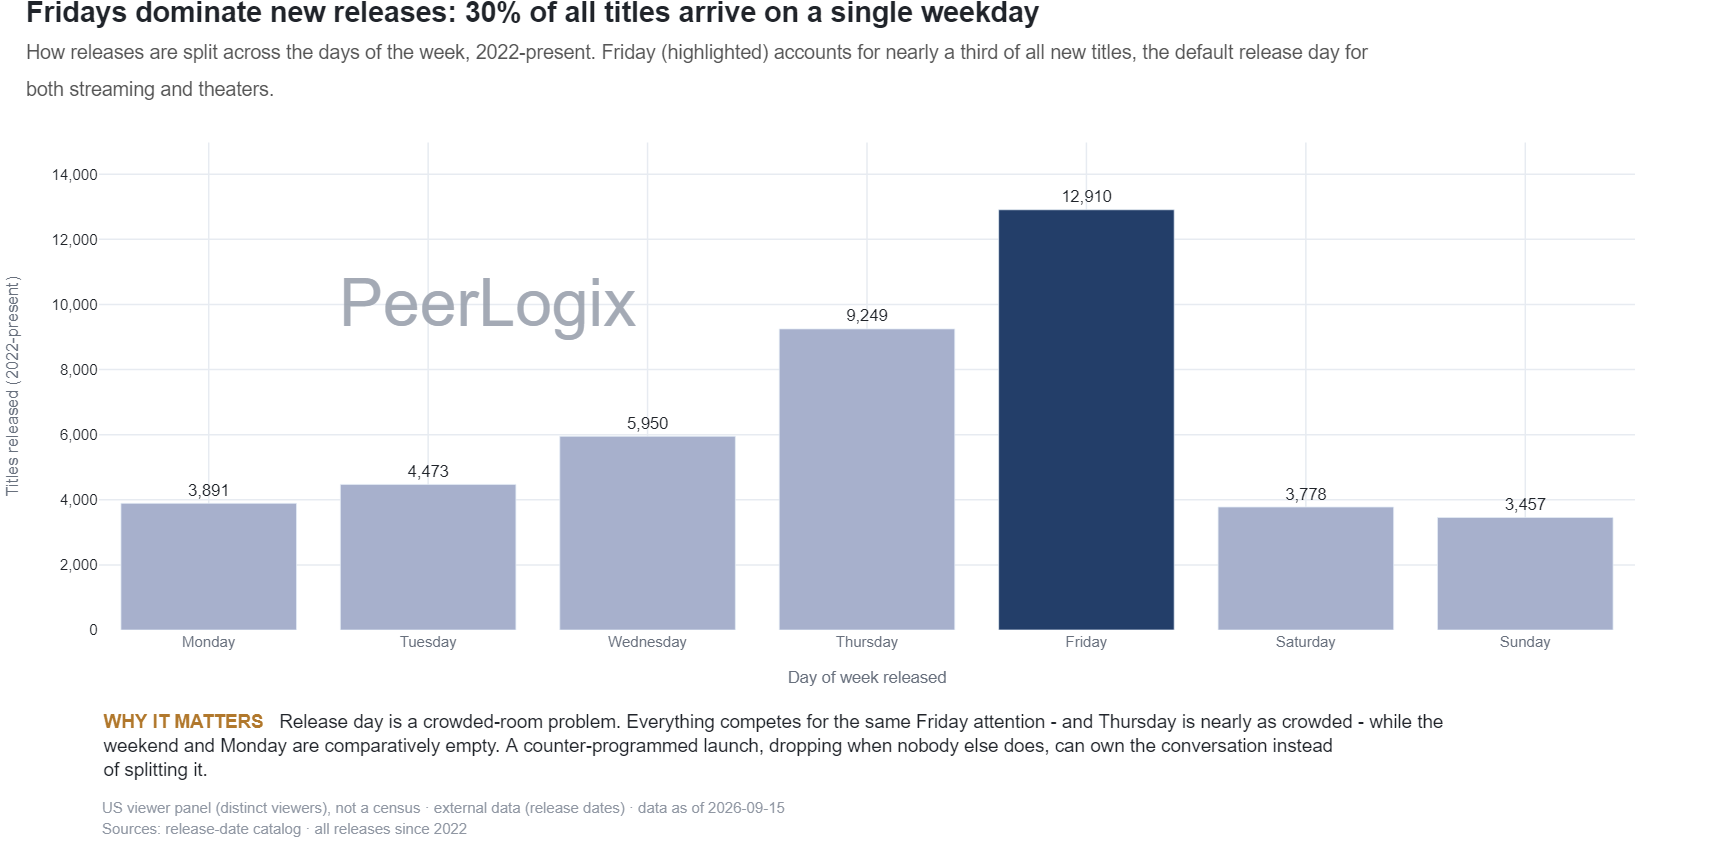
Calendar & Seasonality weekly
Movie and TV release days in the tracked catalog
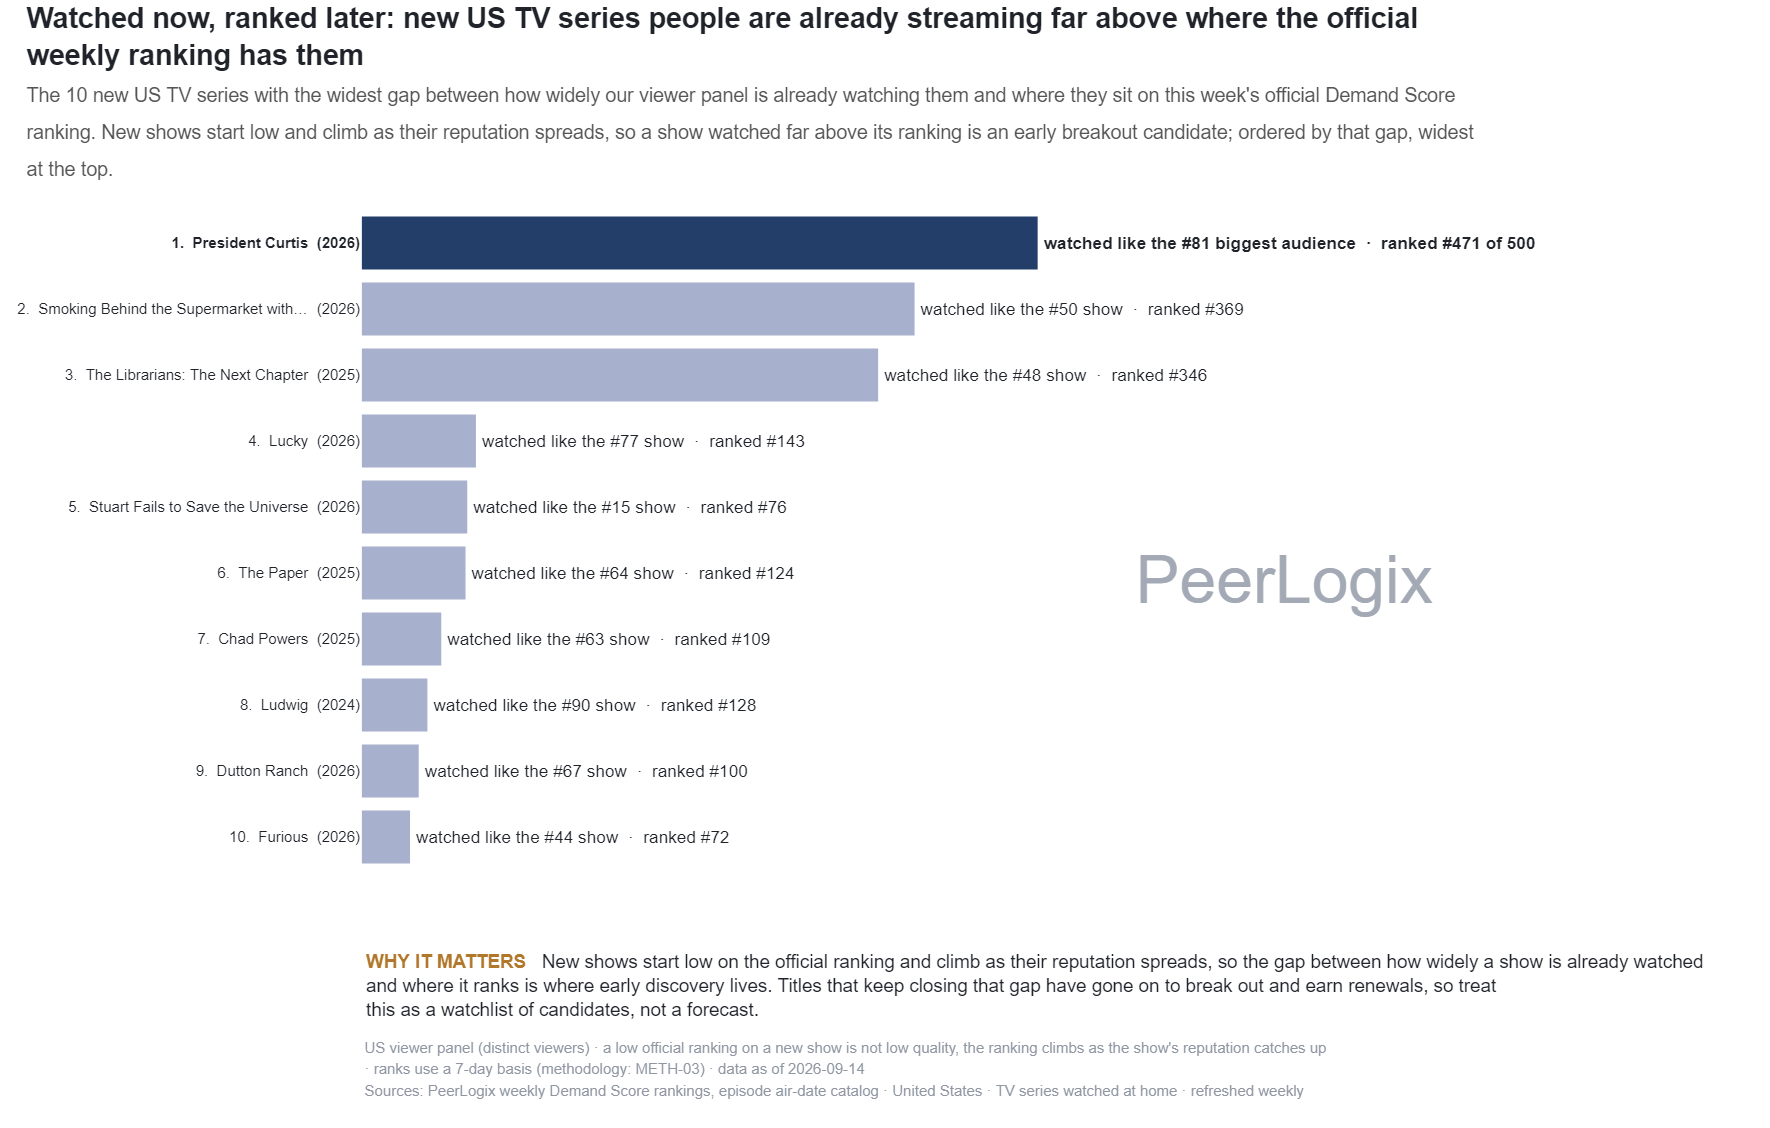
Trackers & Standings weekly
New shows: audience-based rank compared with Demand Score
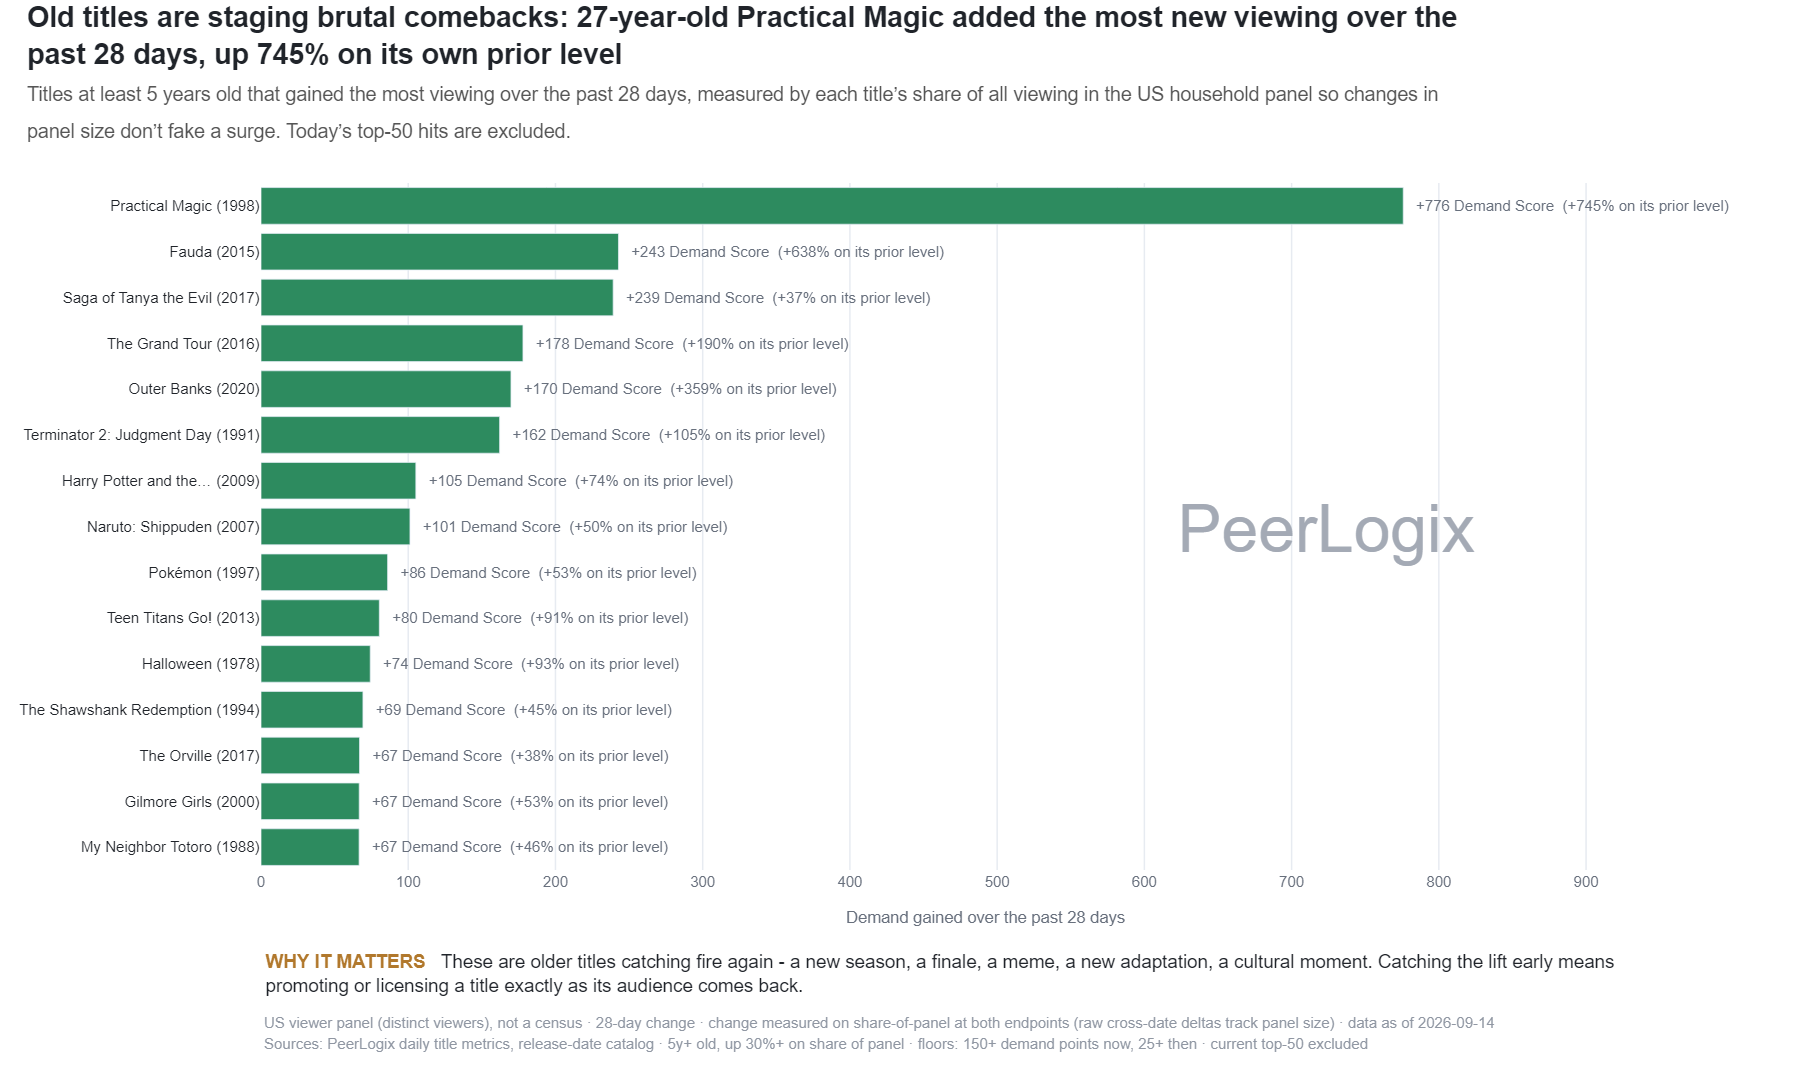
Spikes & Breakouts weekly
Older titles with recent gains in observed viewing share
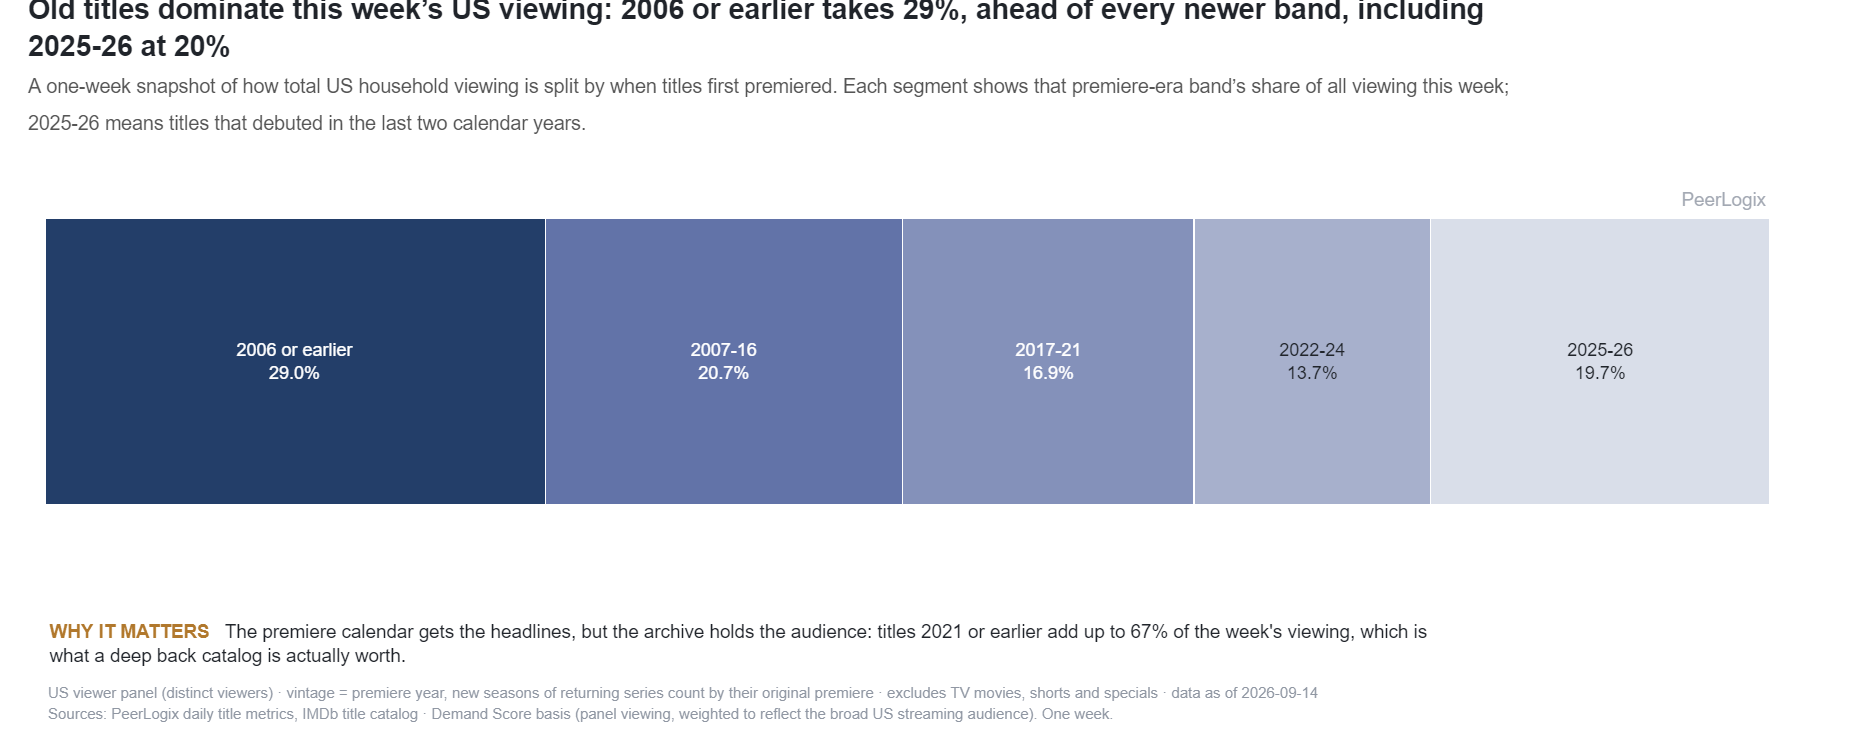
Evergreen & The Long Tail weekly
Streaming demand for older movies and TV shows
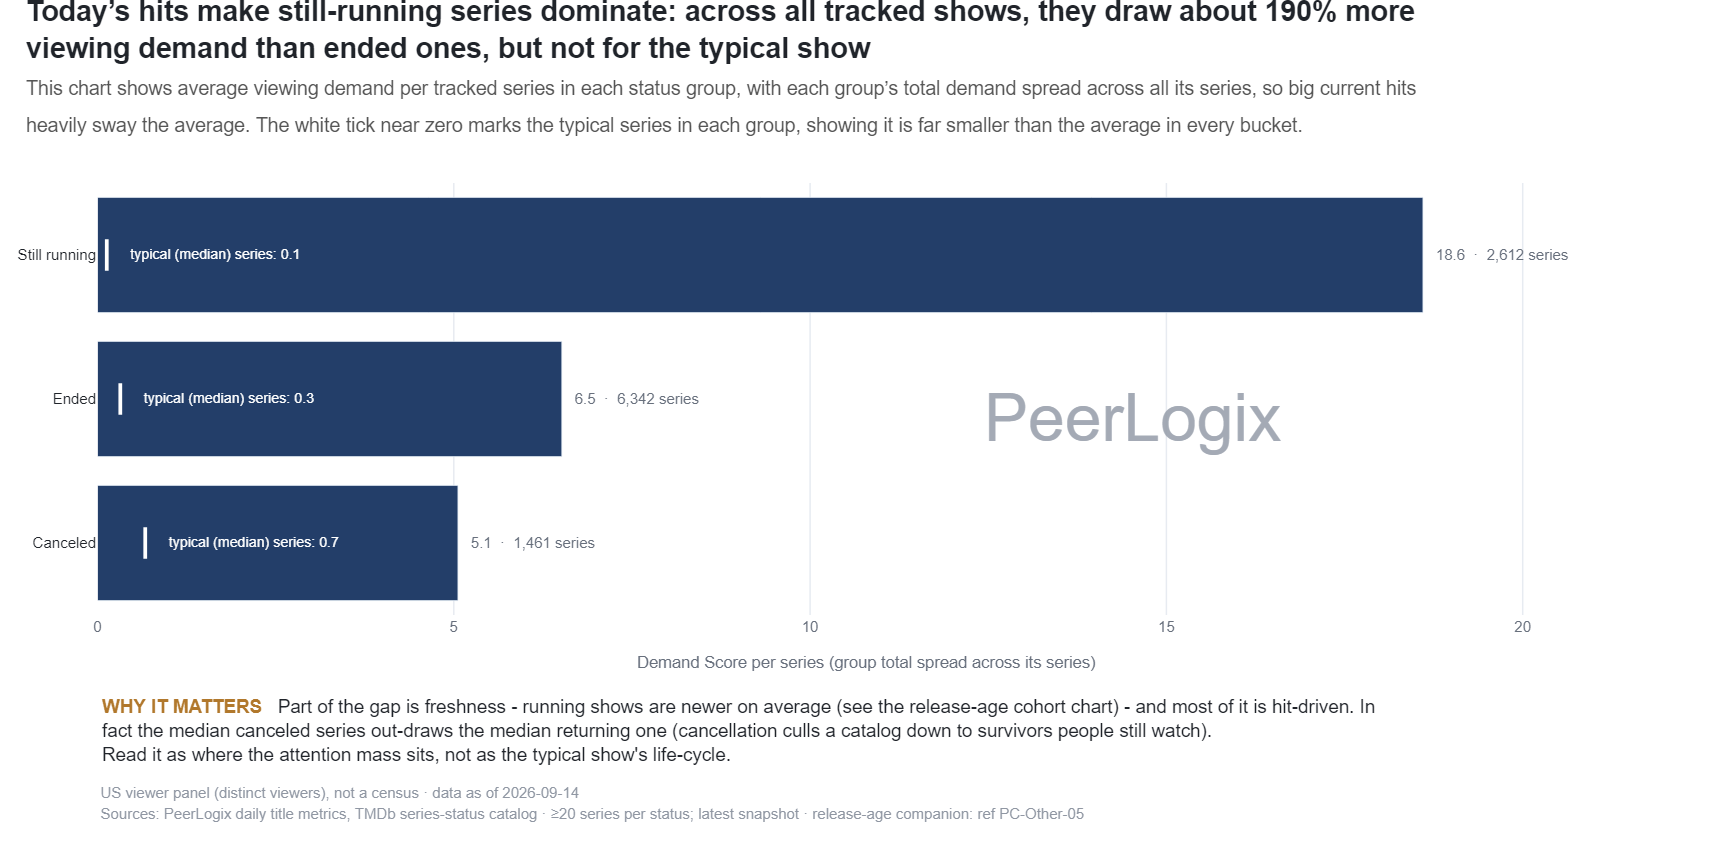
Calendar & Seasonality weekly
Viewing demand for running and ended TV series
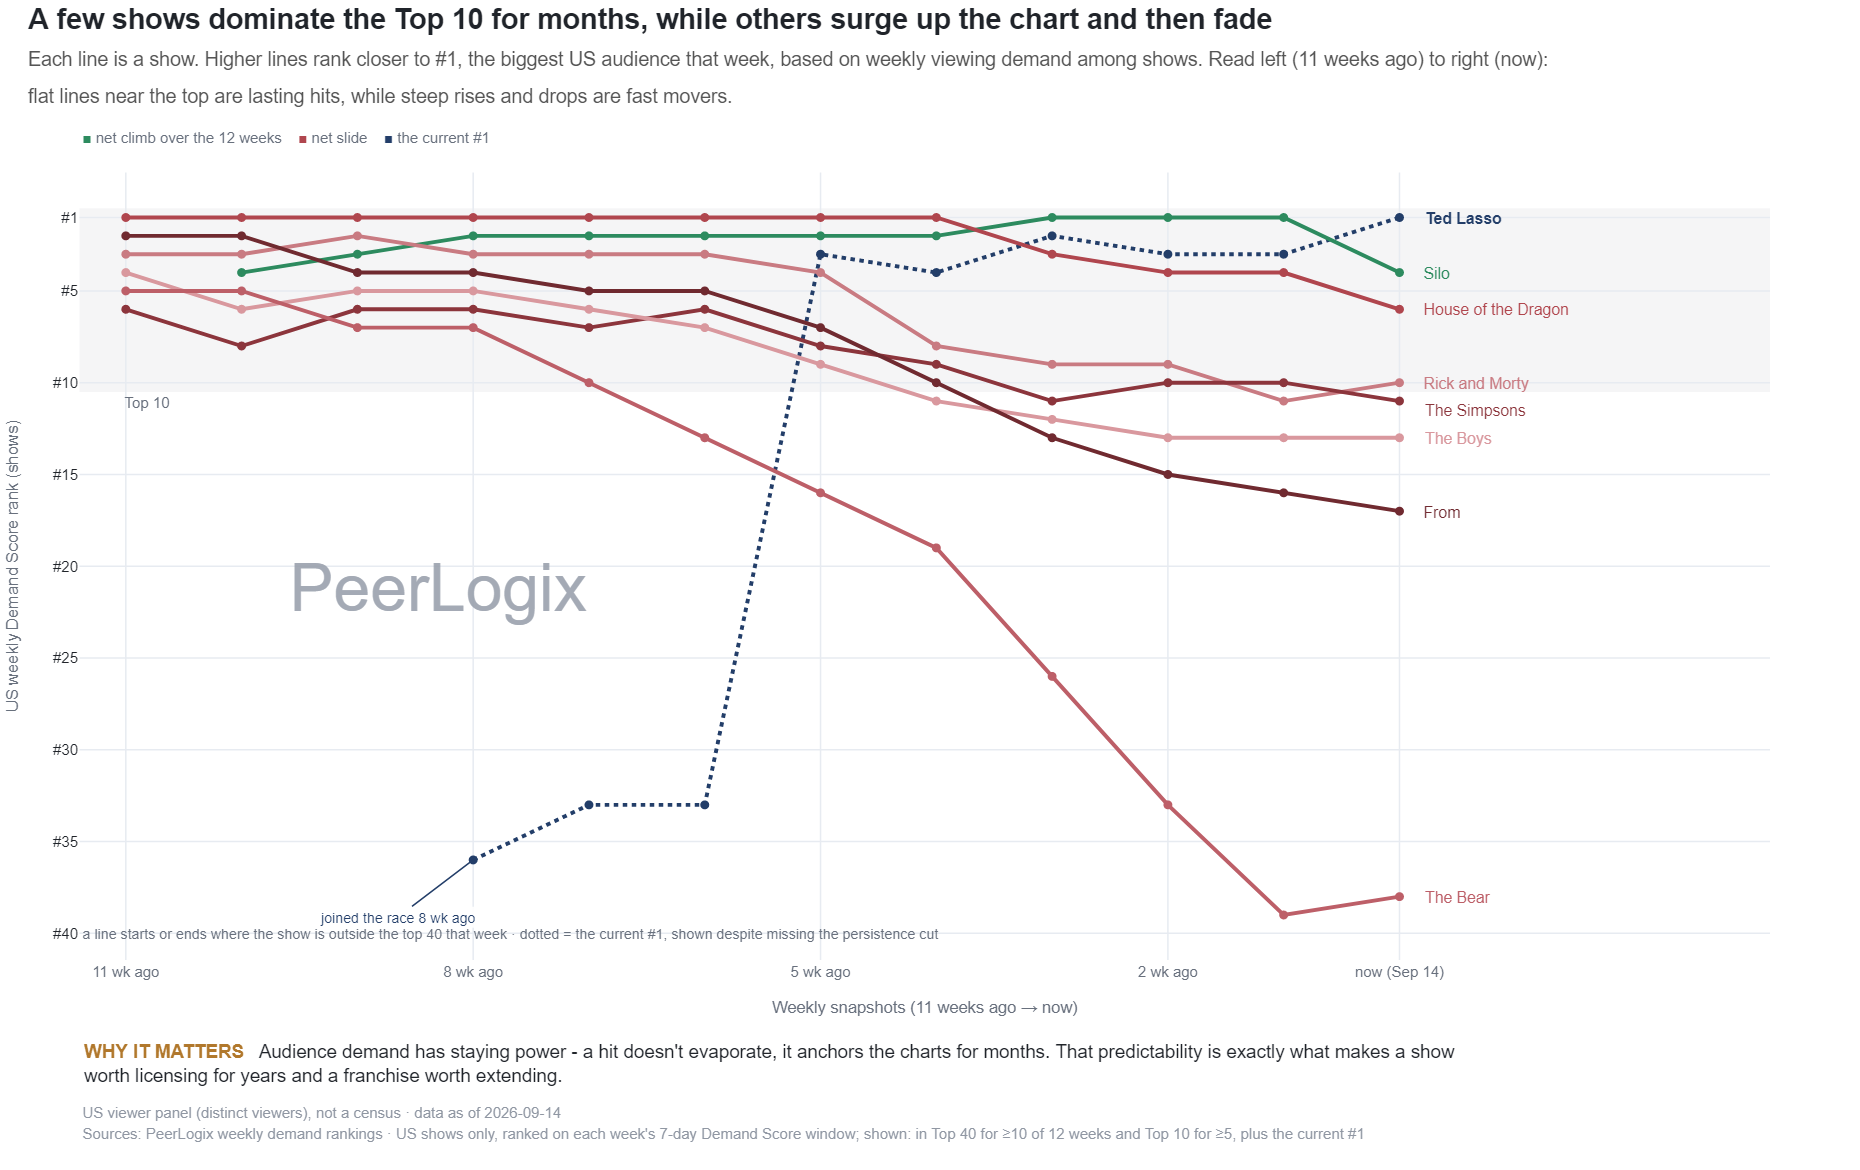
Demand & Momentum weekly
Weekly TV-title rank changes in the U.S. panel
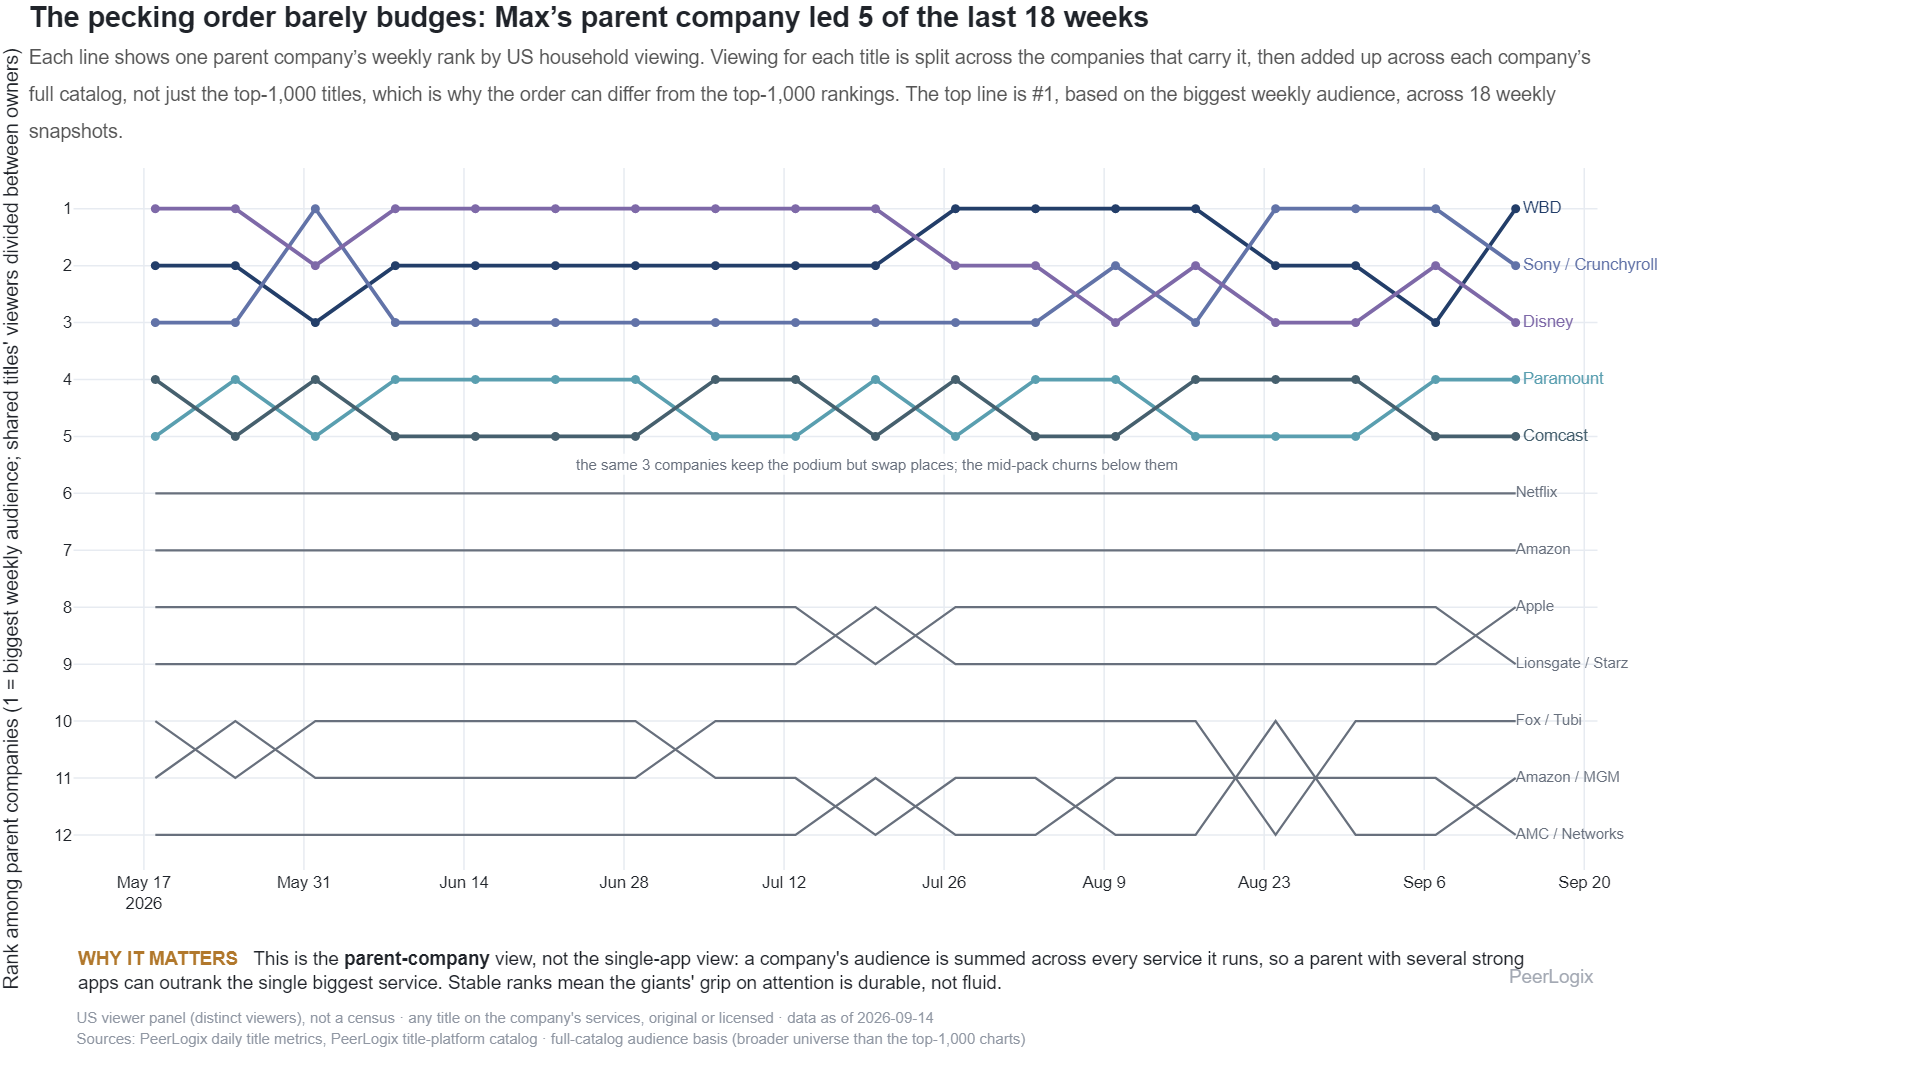
Platforms & Streaming Strategy weekly
Weekly parent-company ranks by allocated title reach
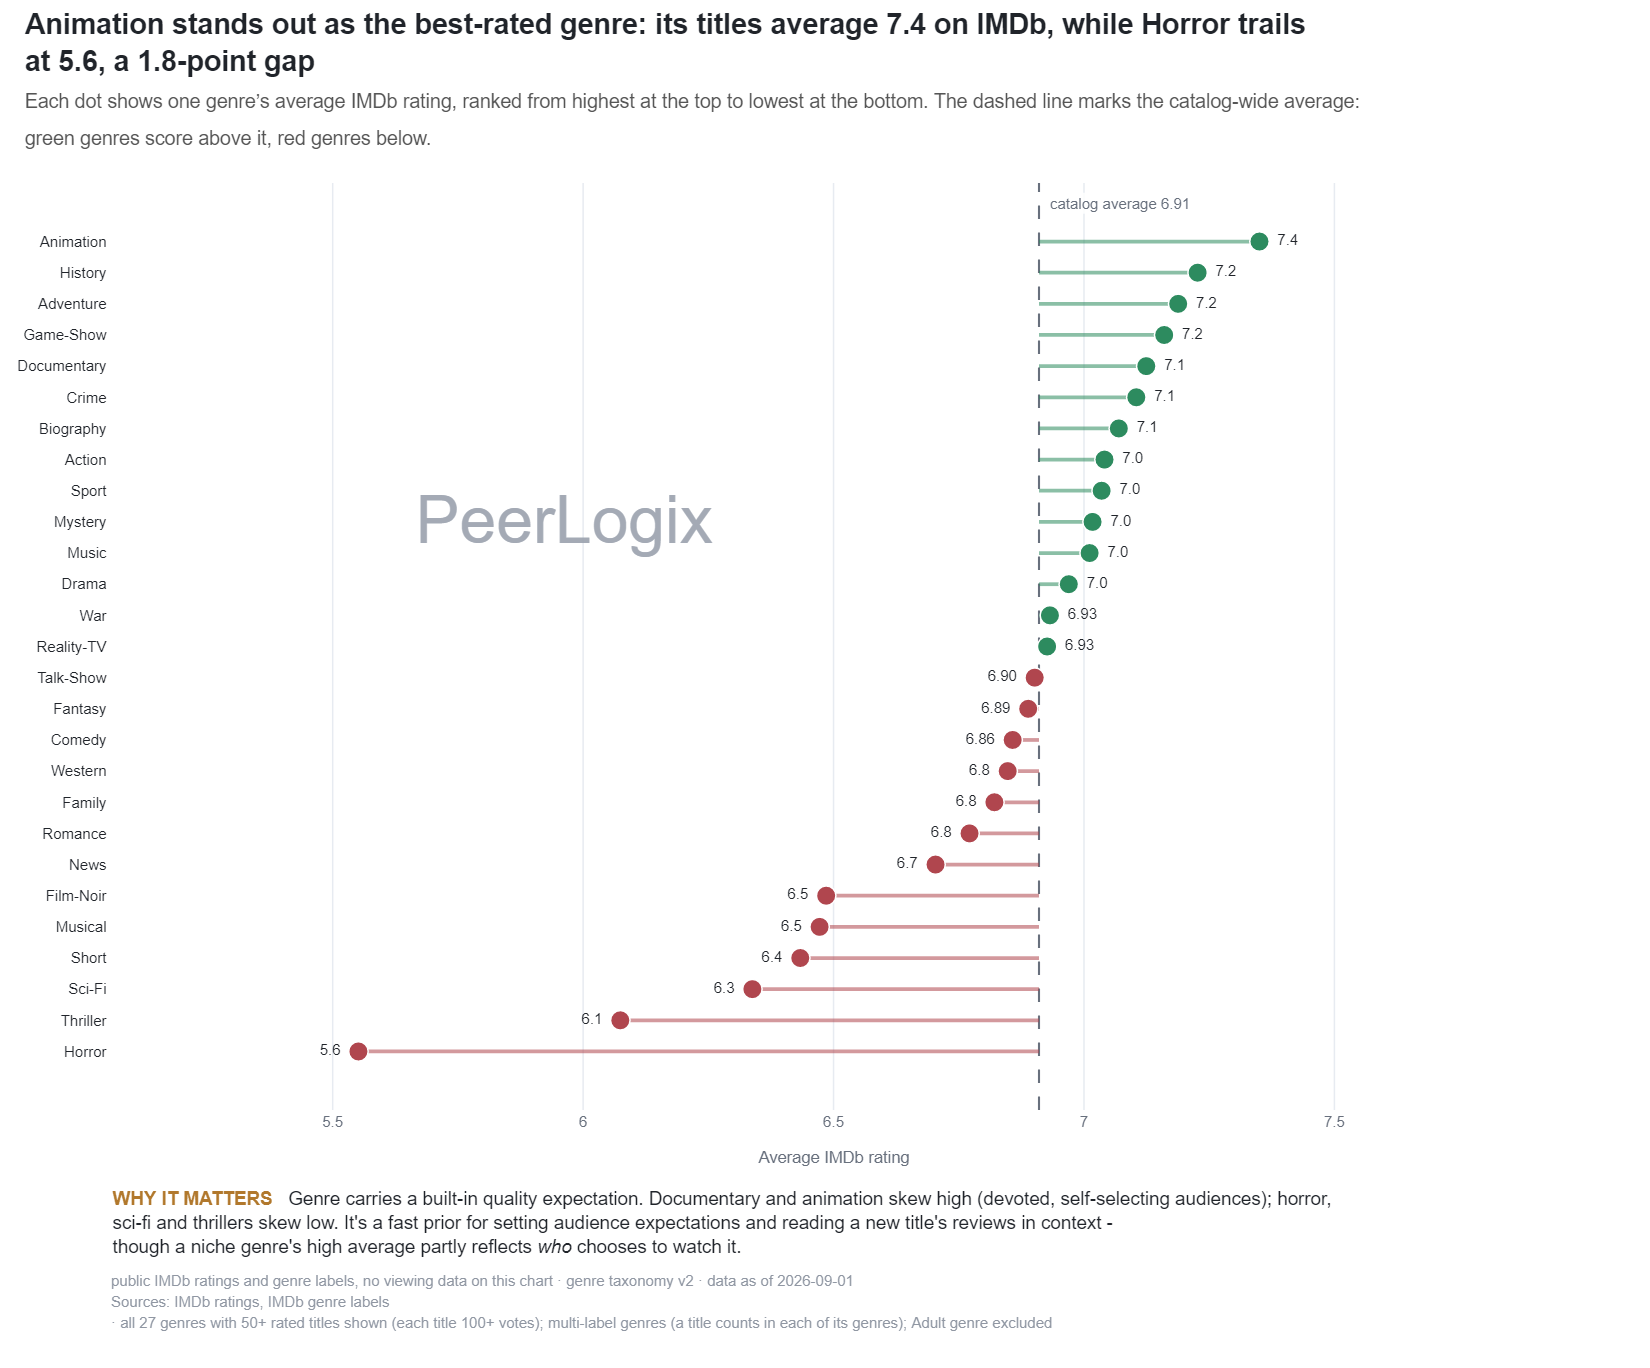
Quality & Reception monthly
Average IMDb ratings by genre
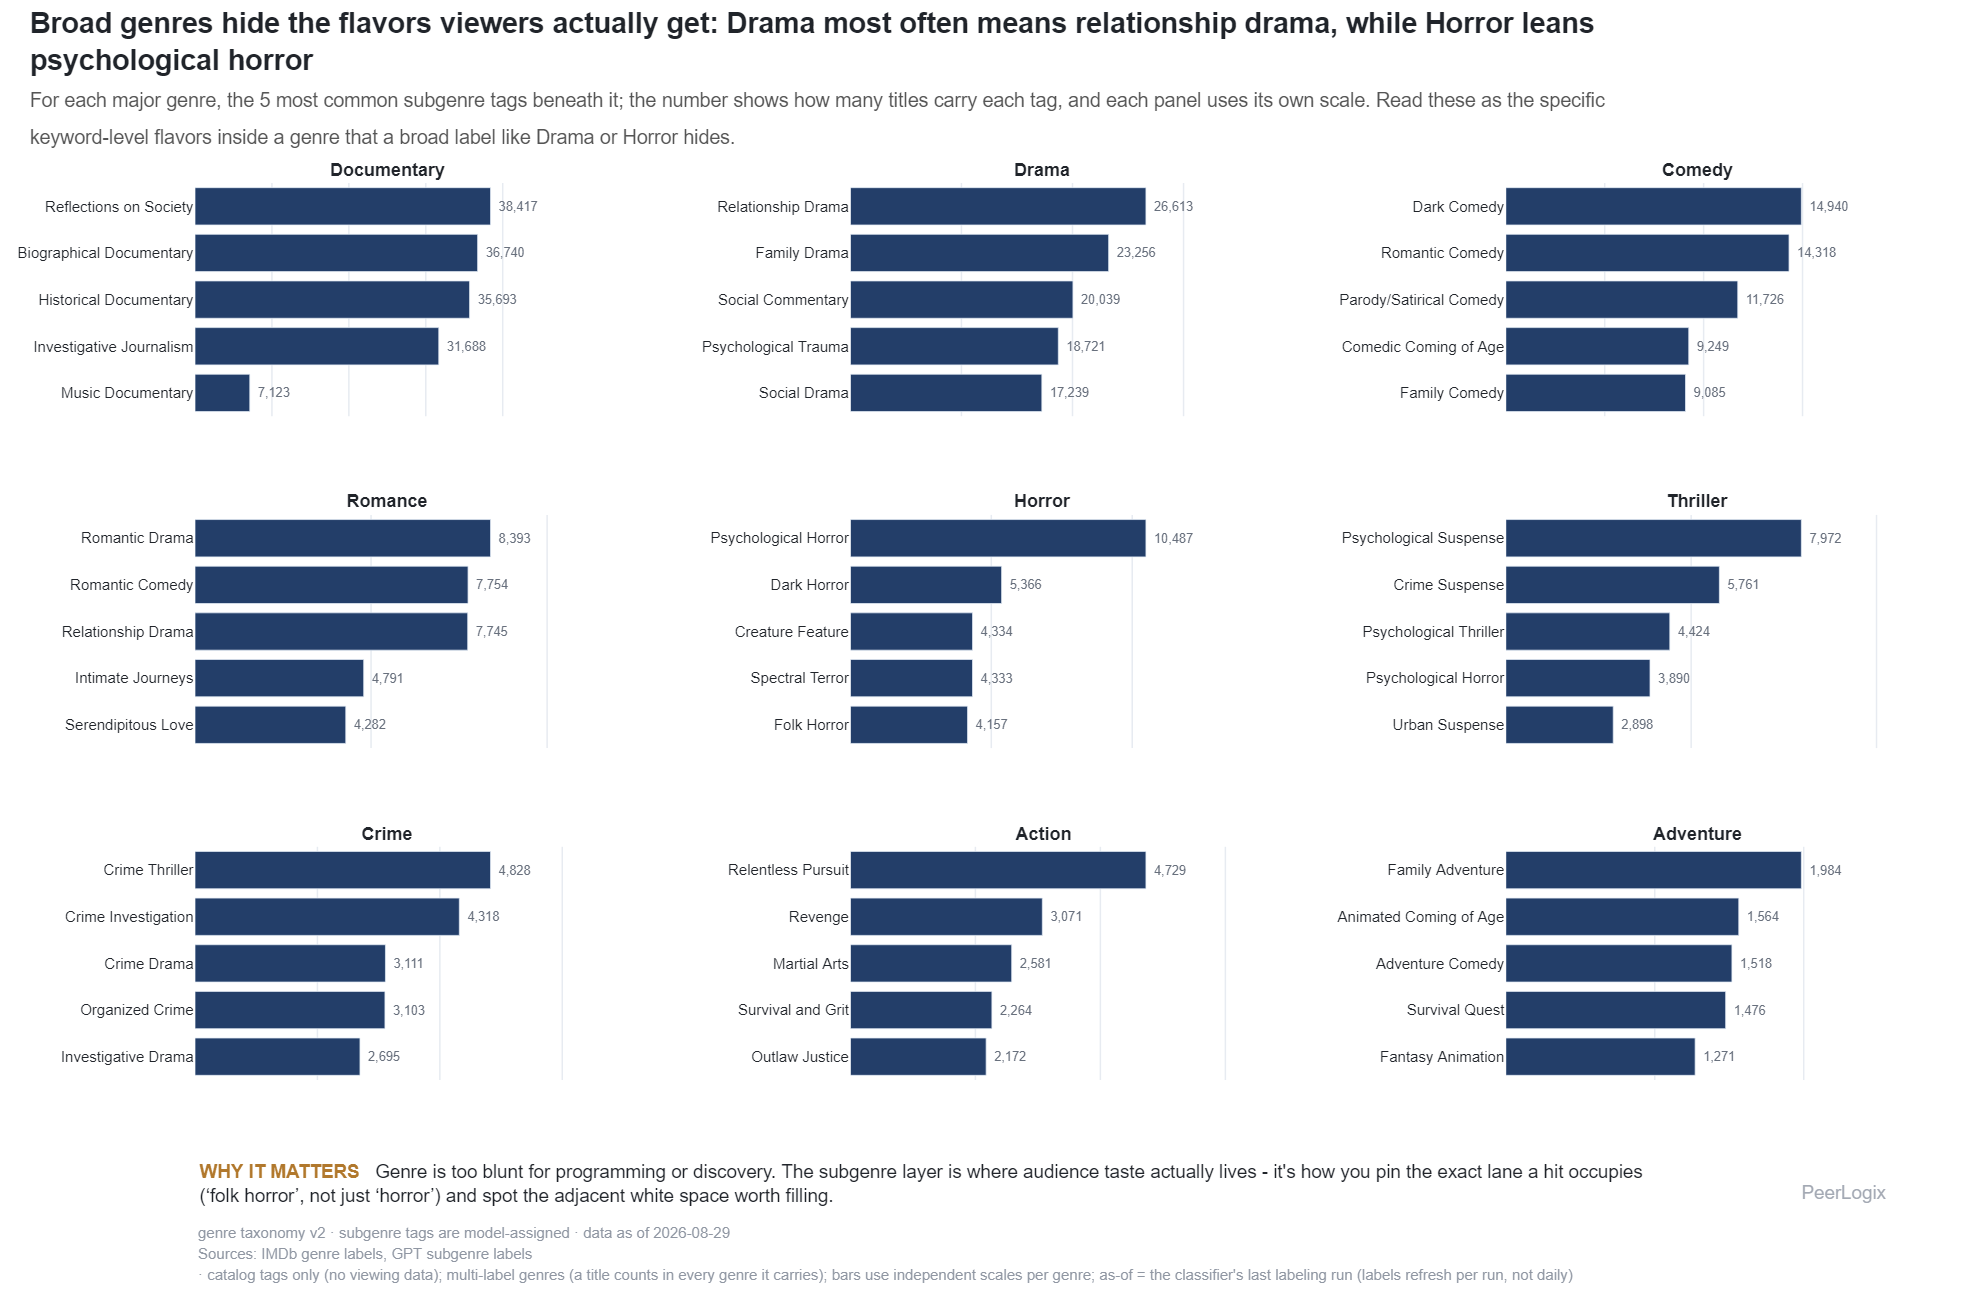
Genres & Taste monthly
Common subgenre tags within major genres
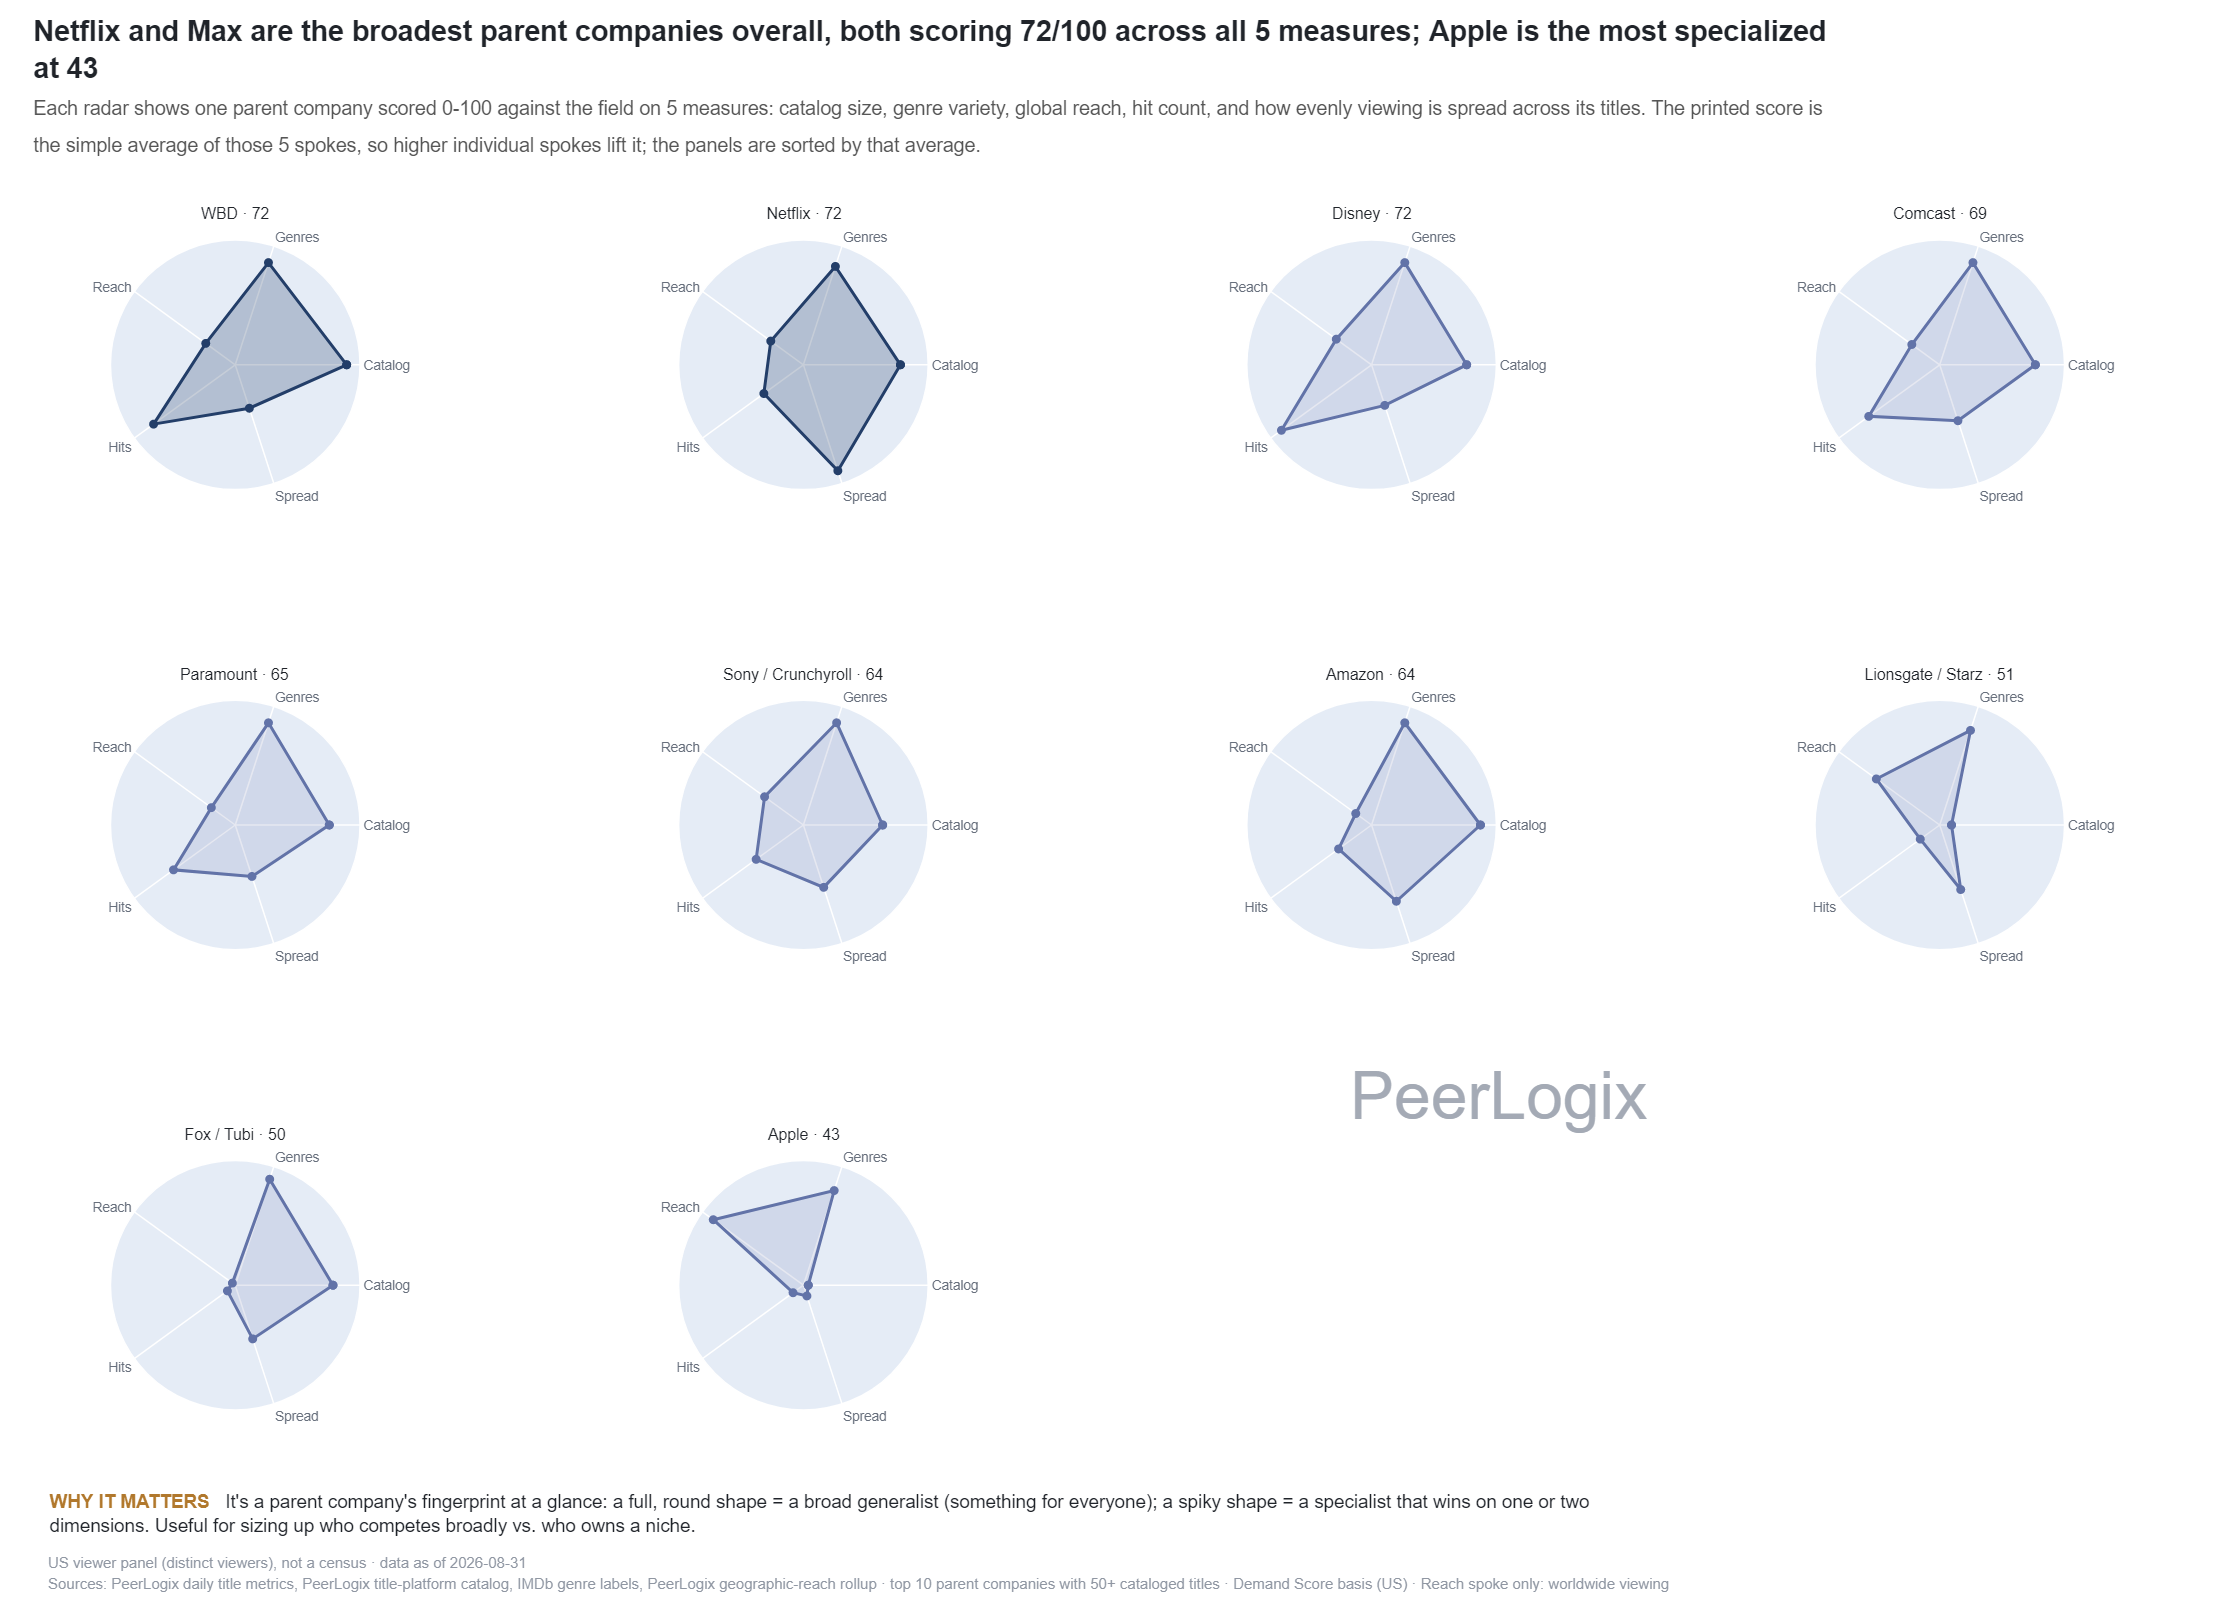
Platforms & Streaming Strategy monthly
Compare parent-company catalog breadth and concentration
Global & Local Demand monthly
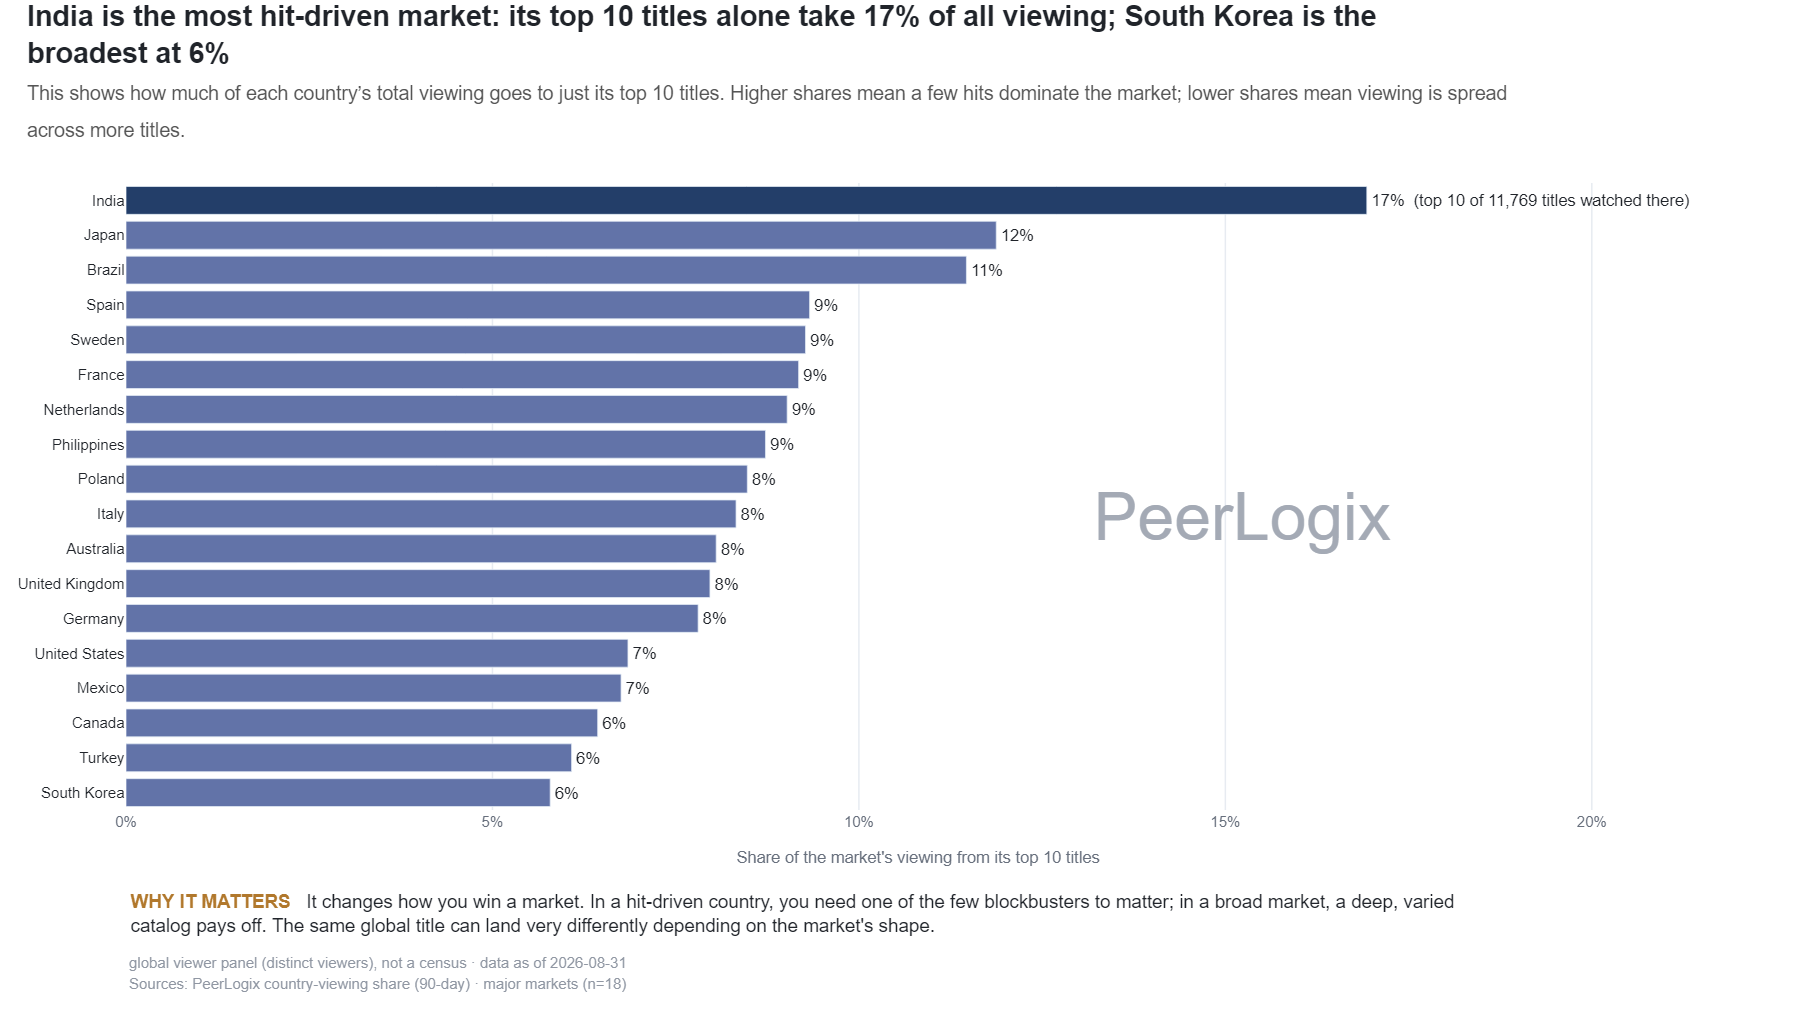
Country concentration in the top ten streaming titles
Global & Local Demand monthly
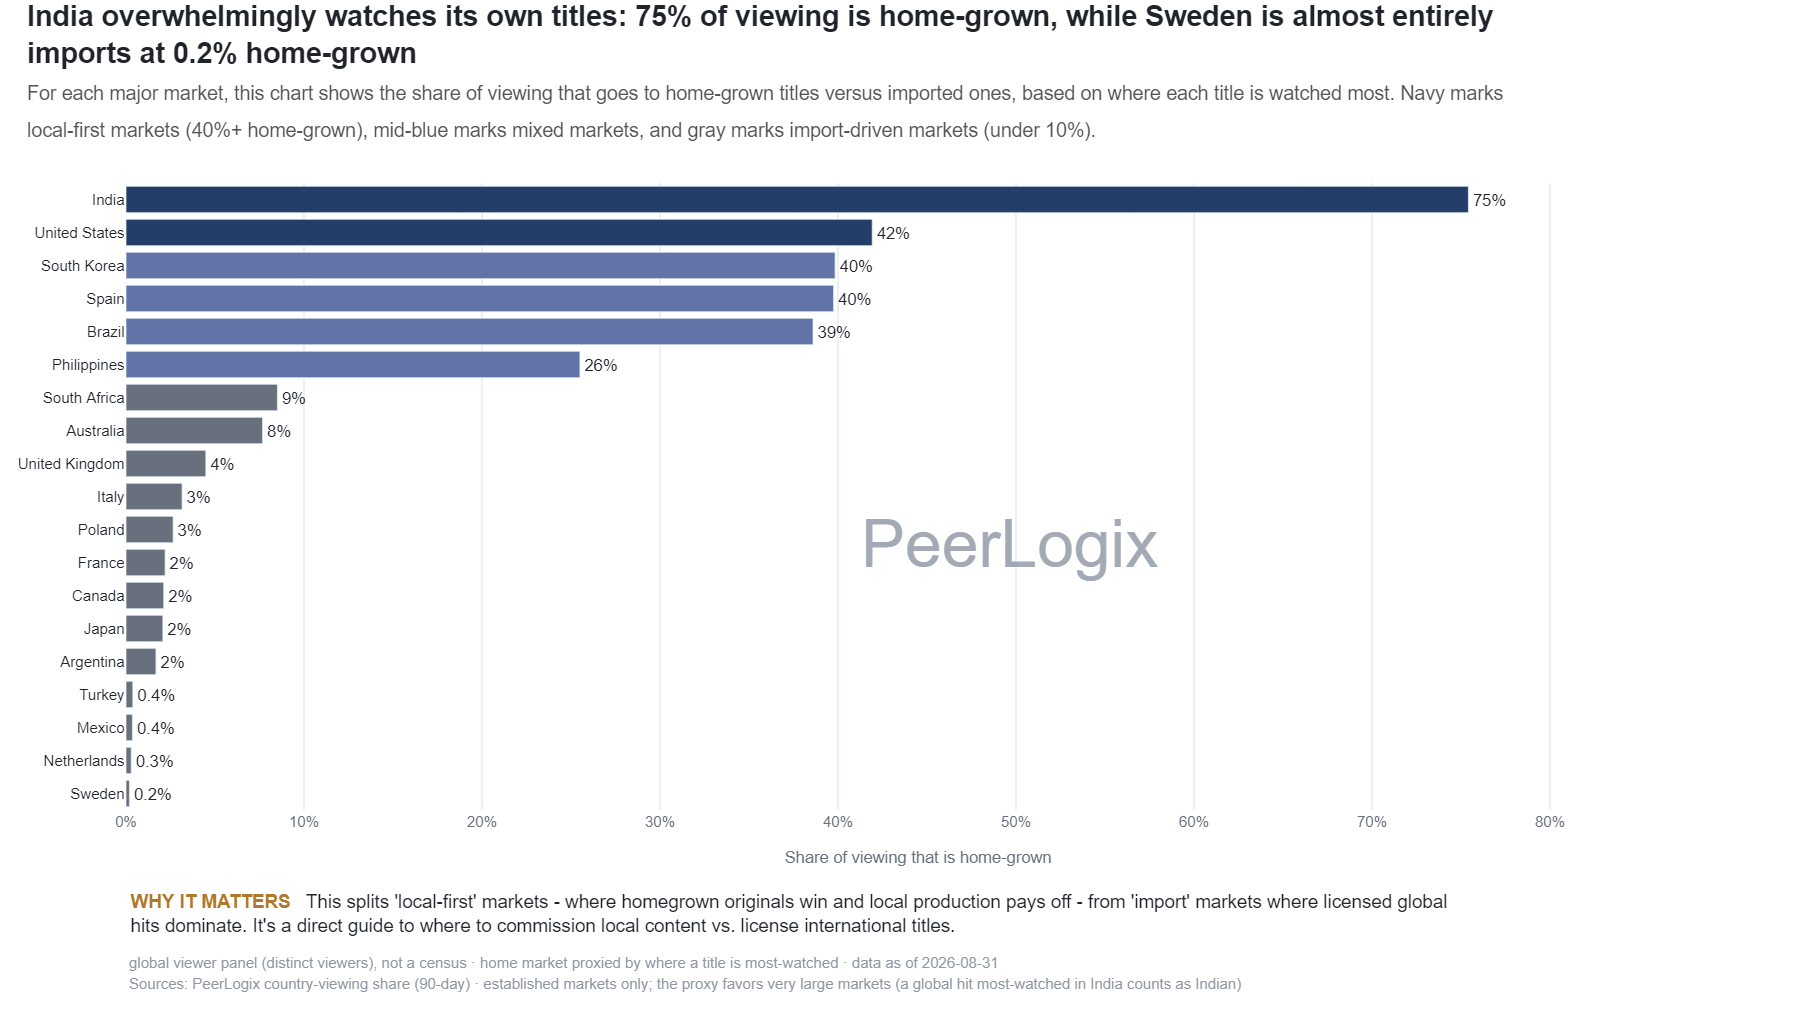
Country viewing and each title’s strongest observed market
Spend & ROI monthly
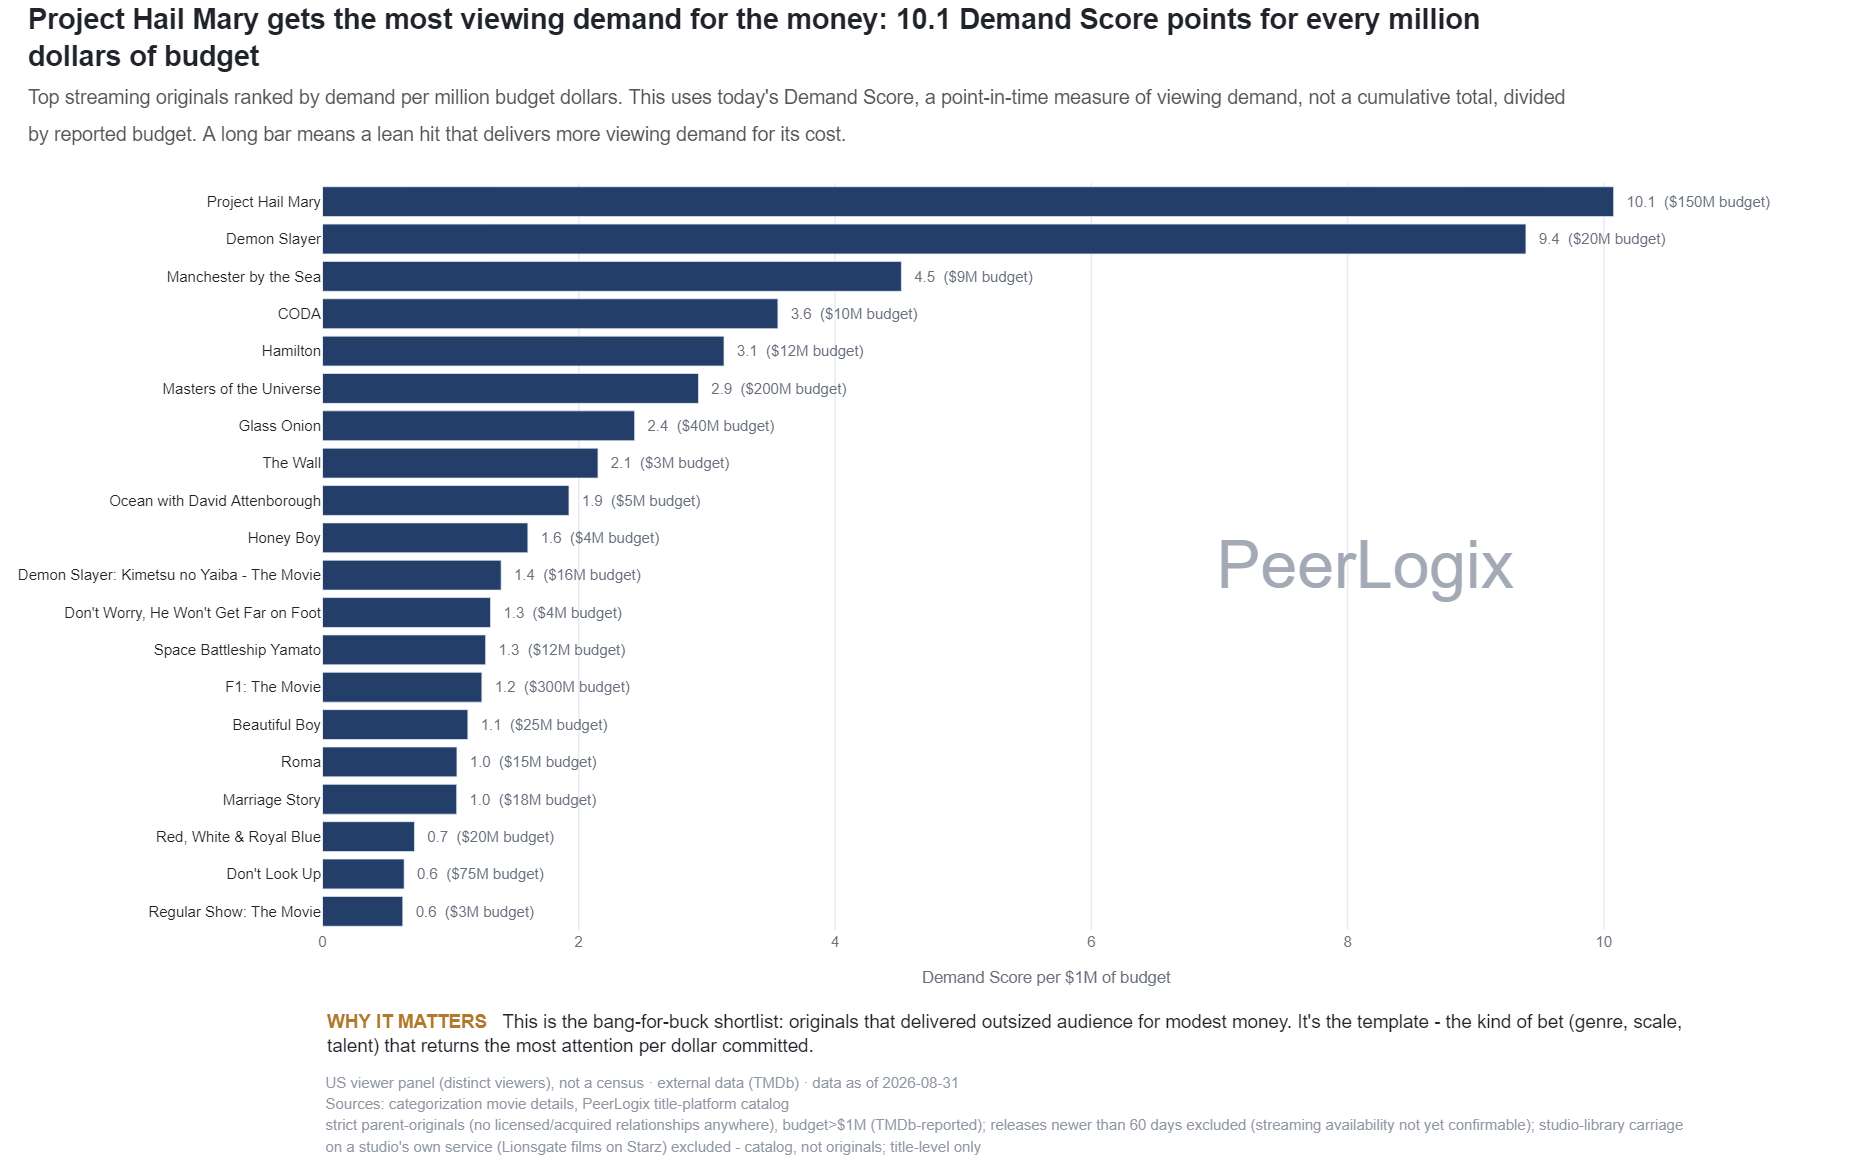
Current demand per budget dollar for titles classified as originals
Platforms & Streaming Strategy monthly
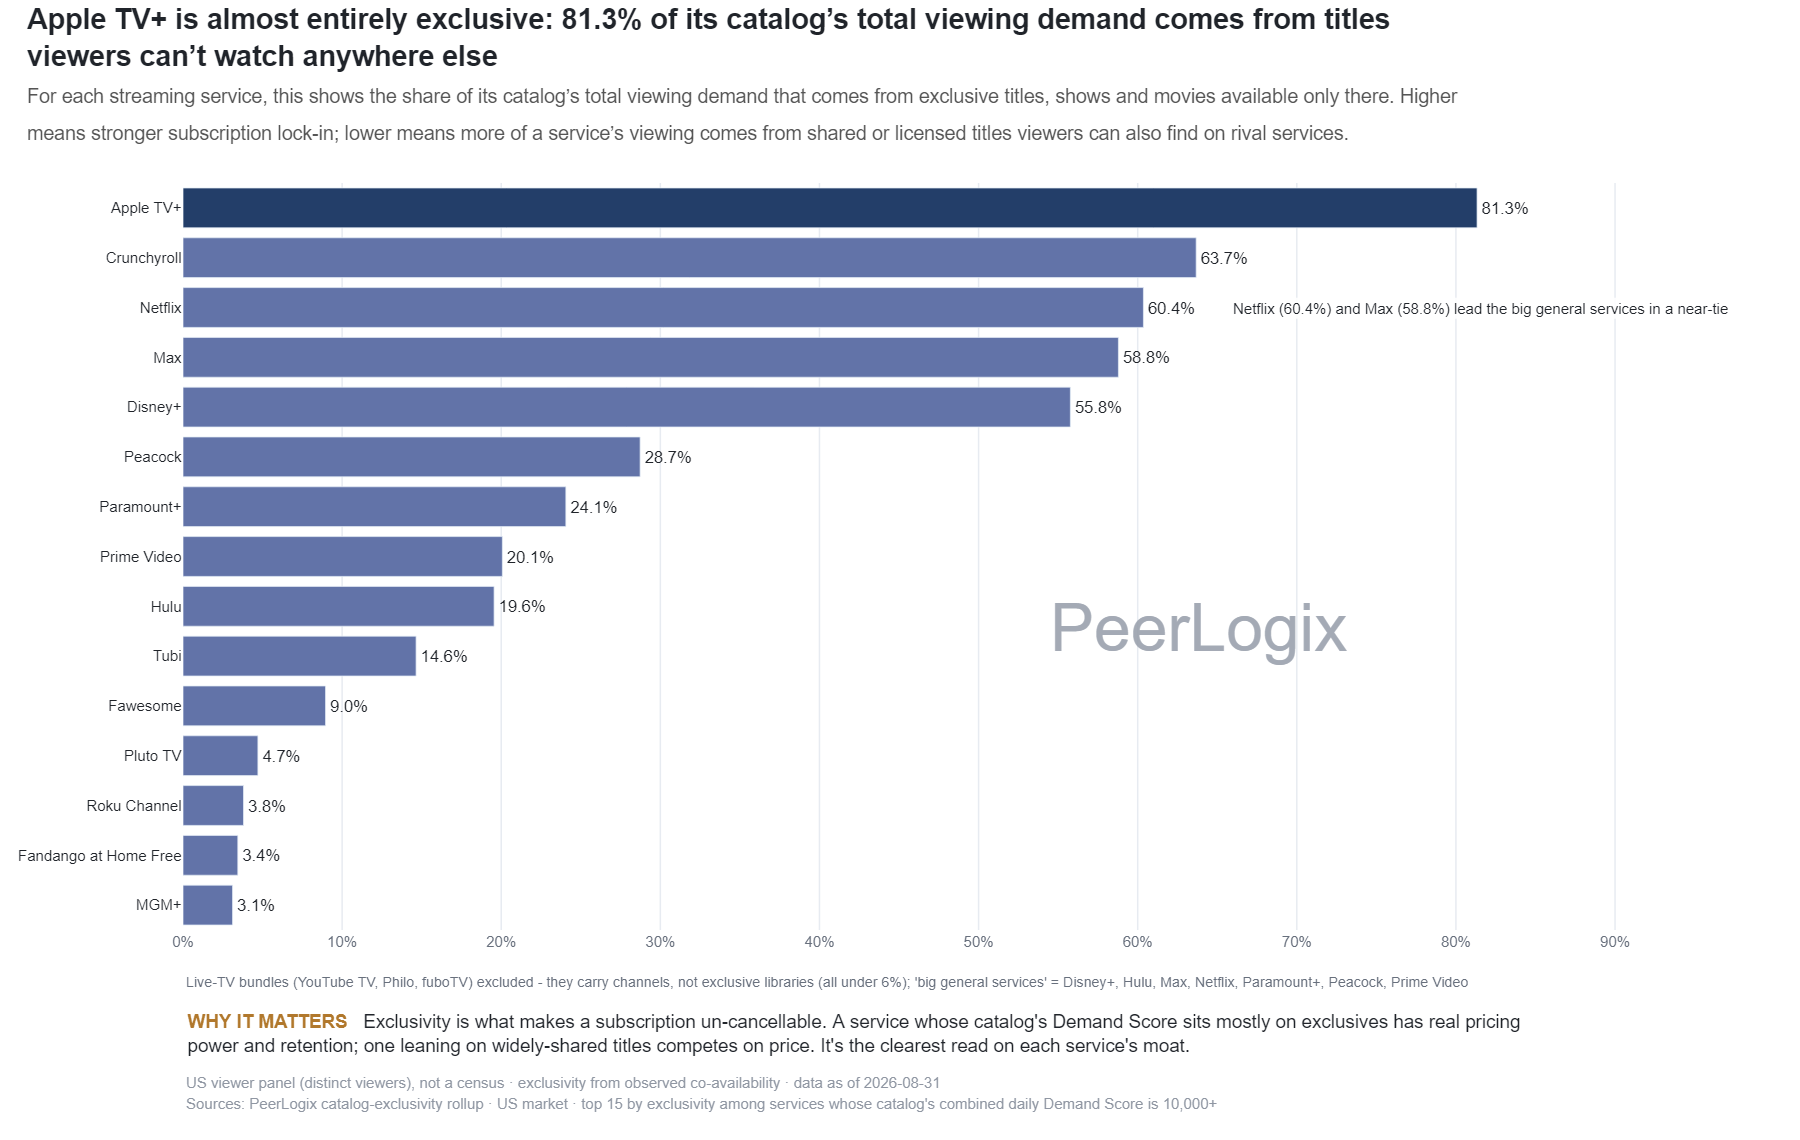
Exclusive-title share of streaming catalog demand
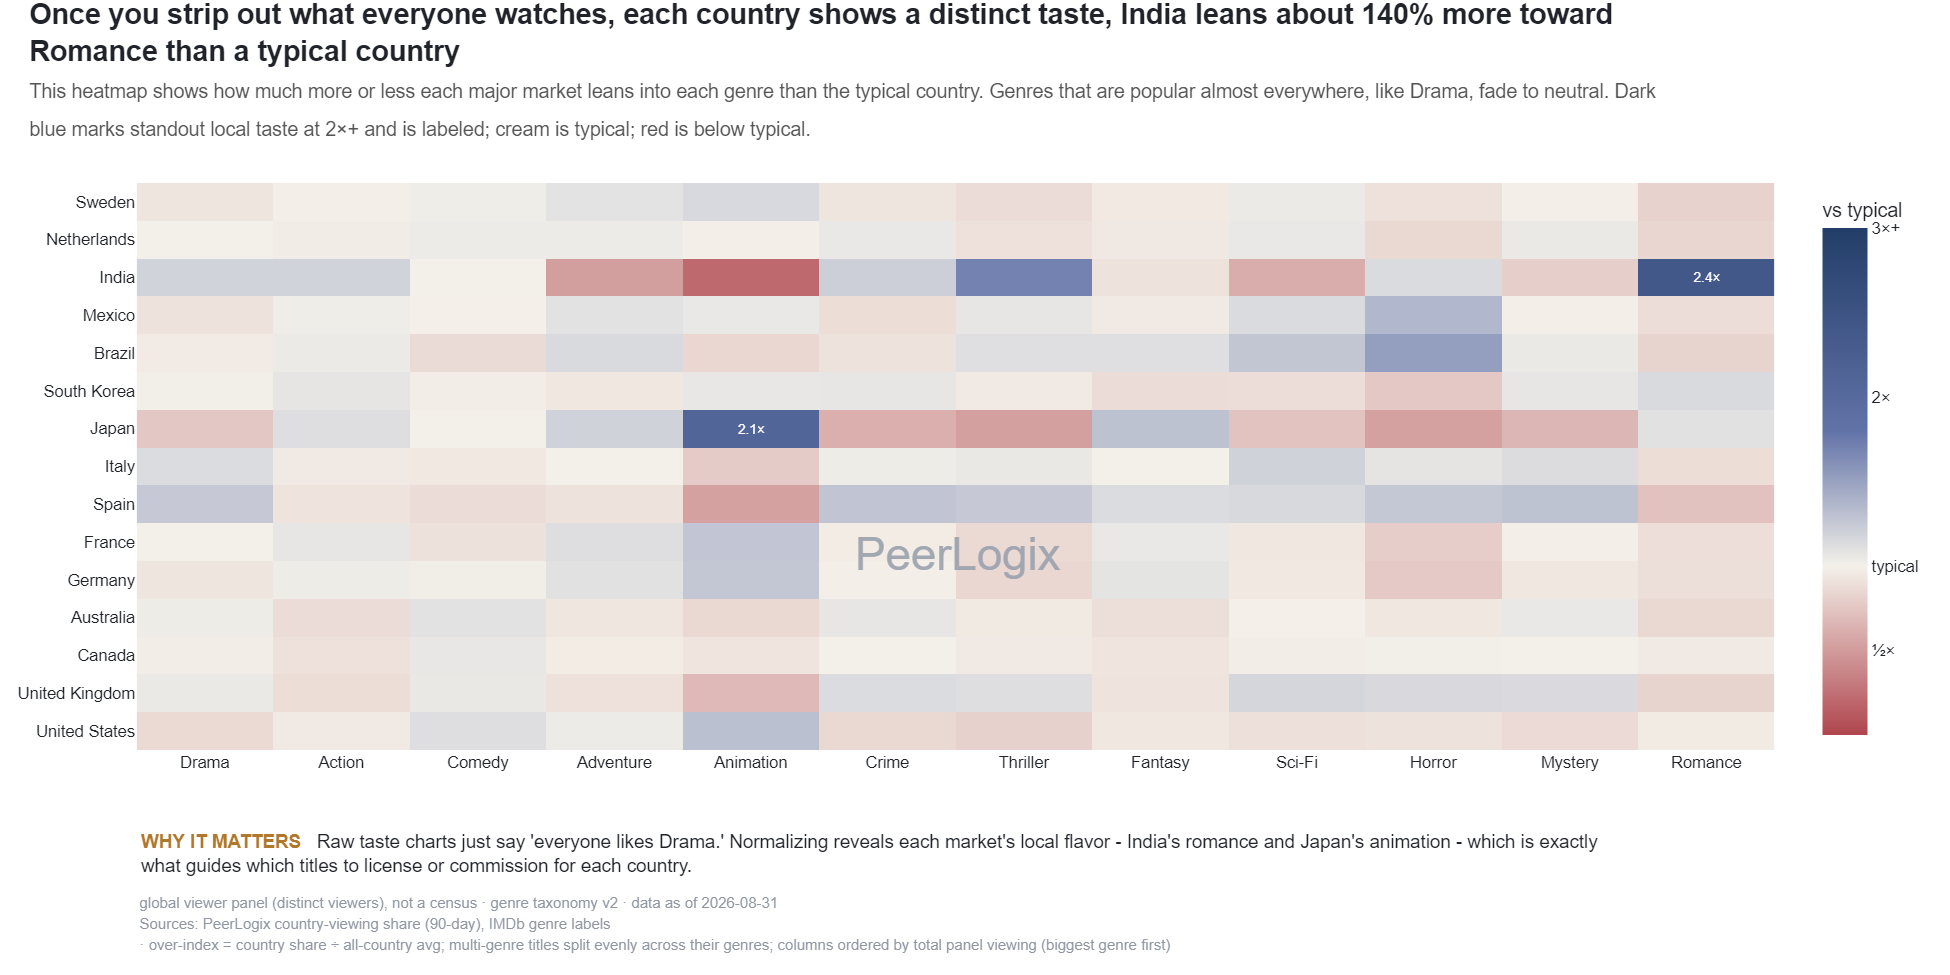
Global & Local Demand monthly
Genre affinities across covered streaming markets
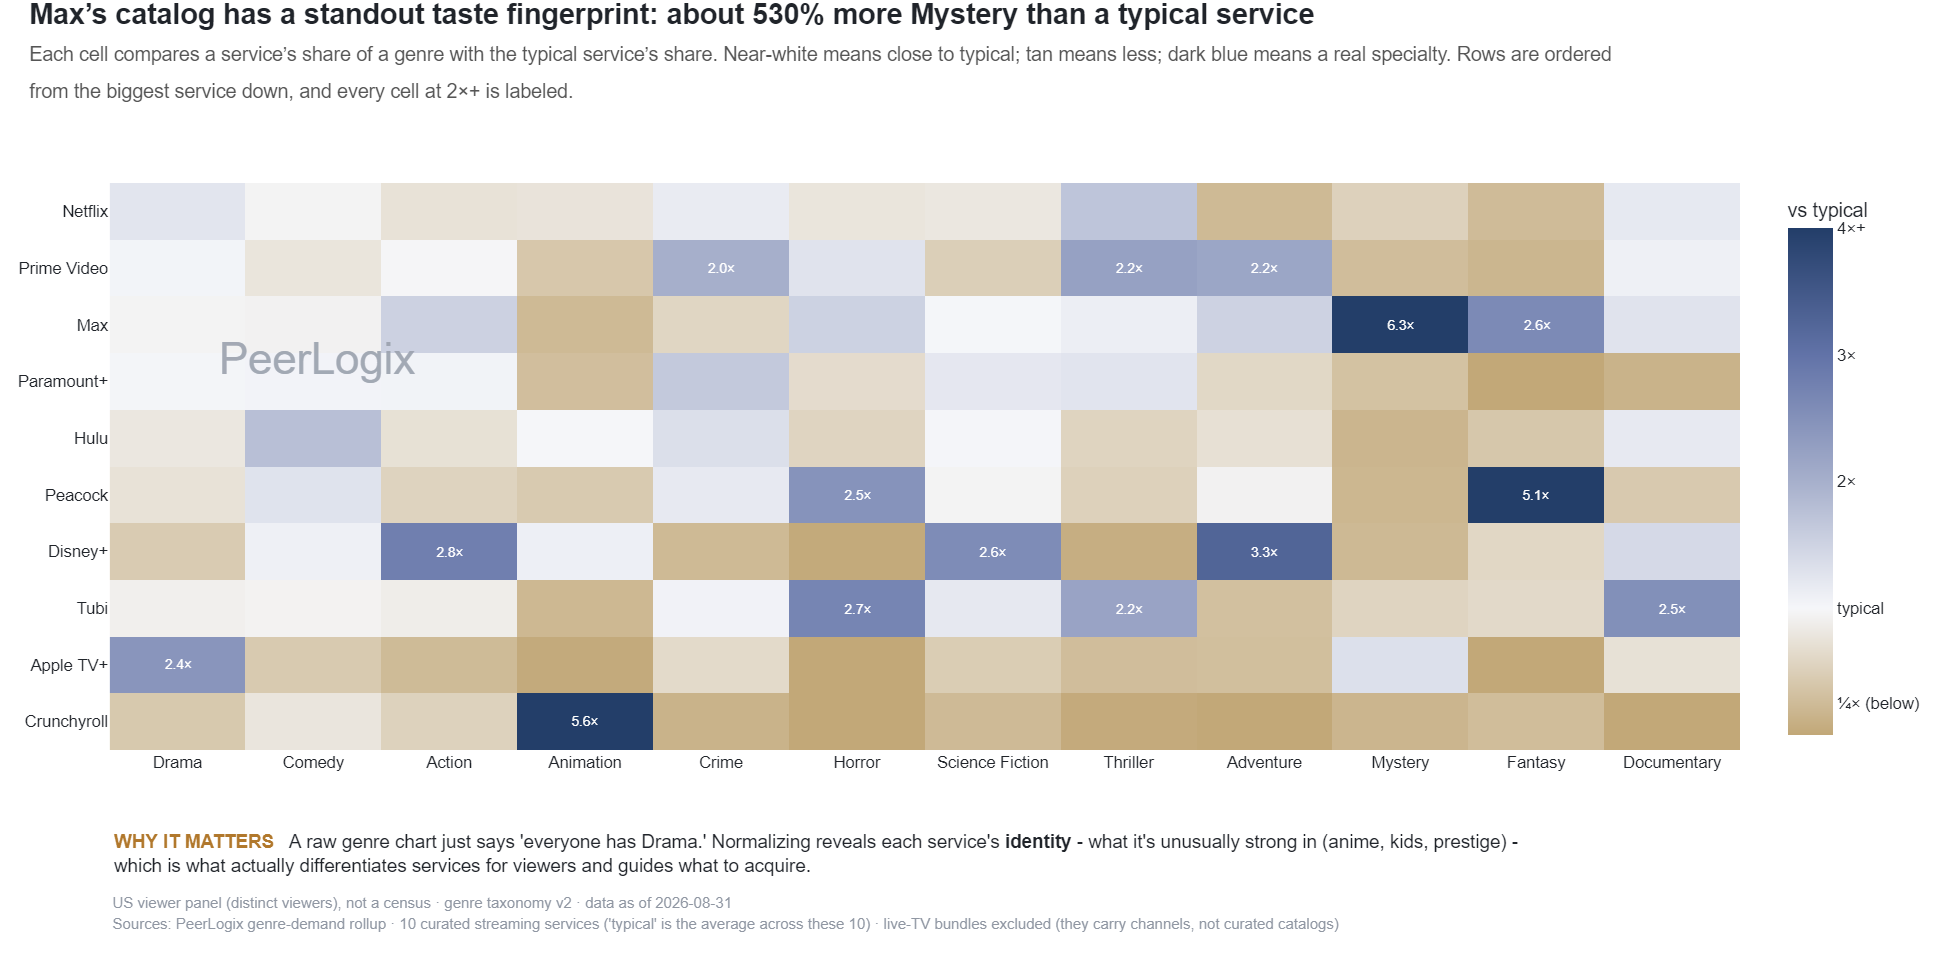
Platforms & Streaming Strategy monthly
Genre concentration within streaming service catalogs
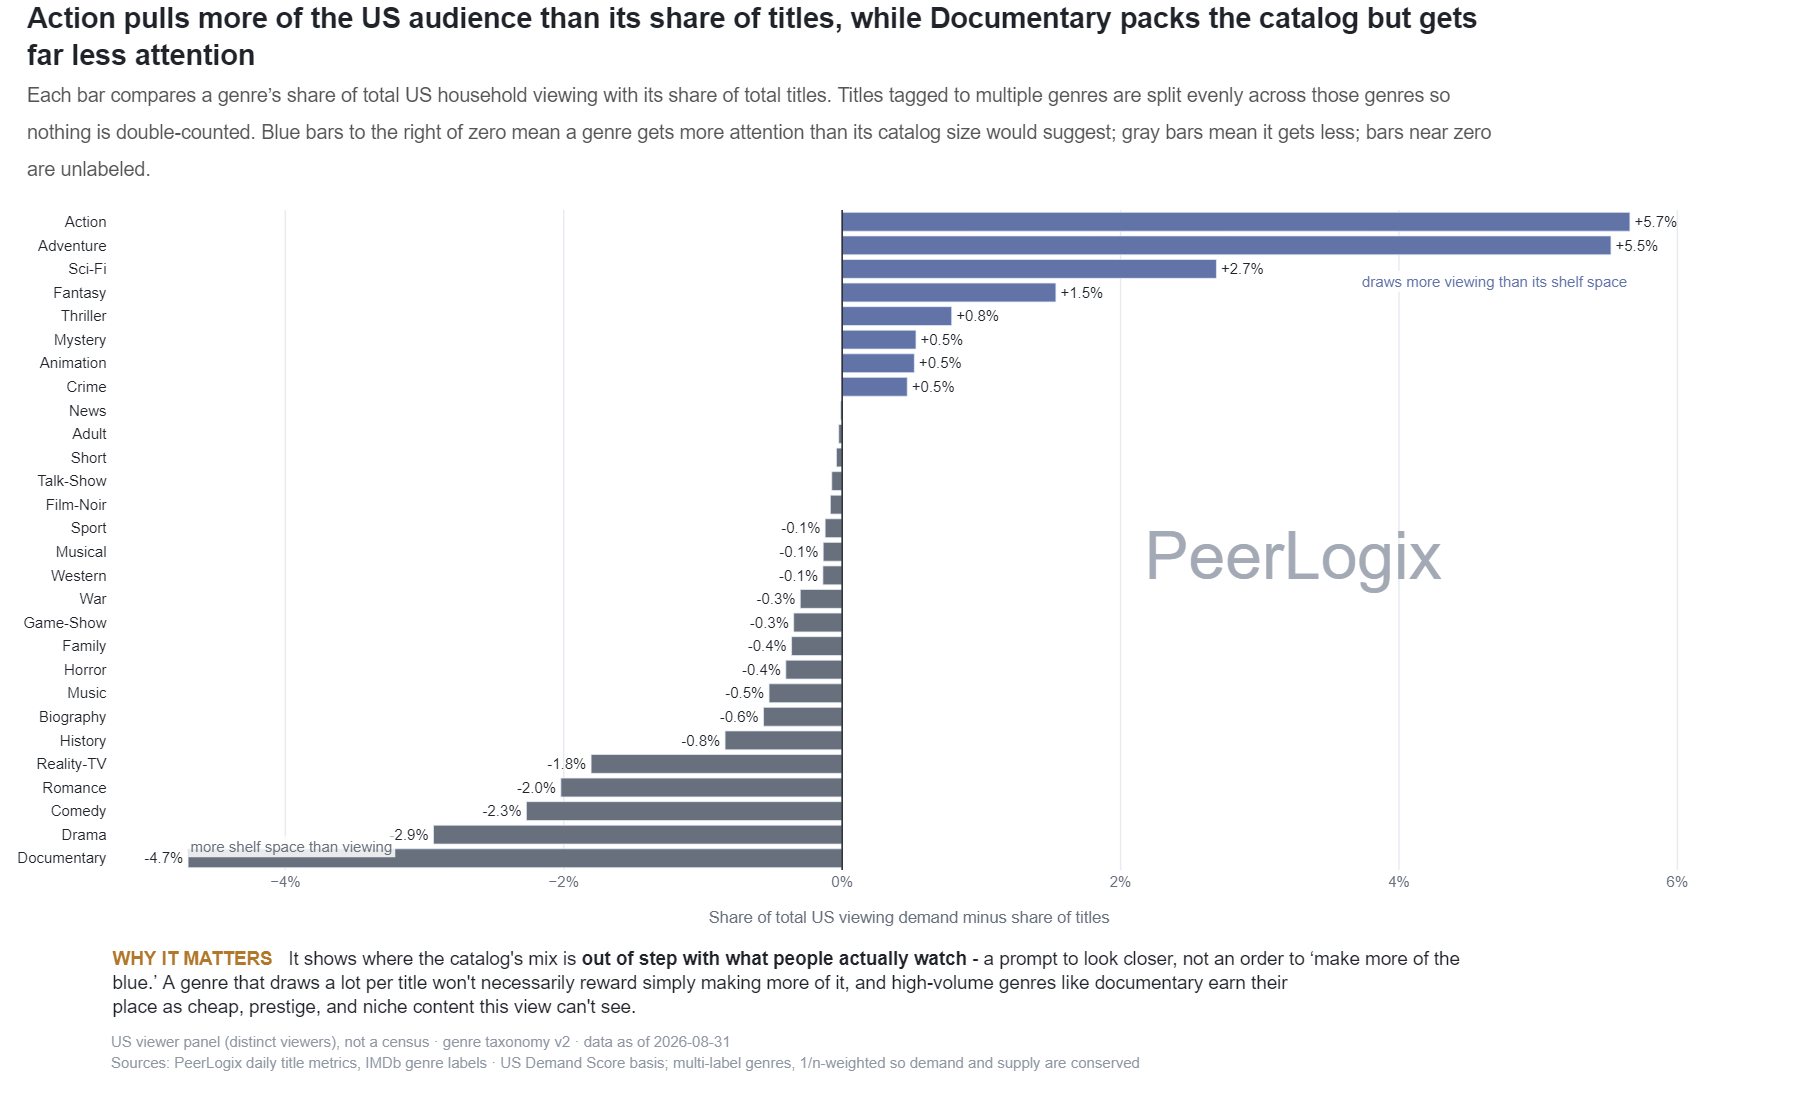
Genres & Taste monthly
Genre demand share compared with catalog title share
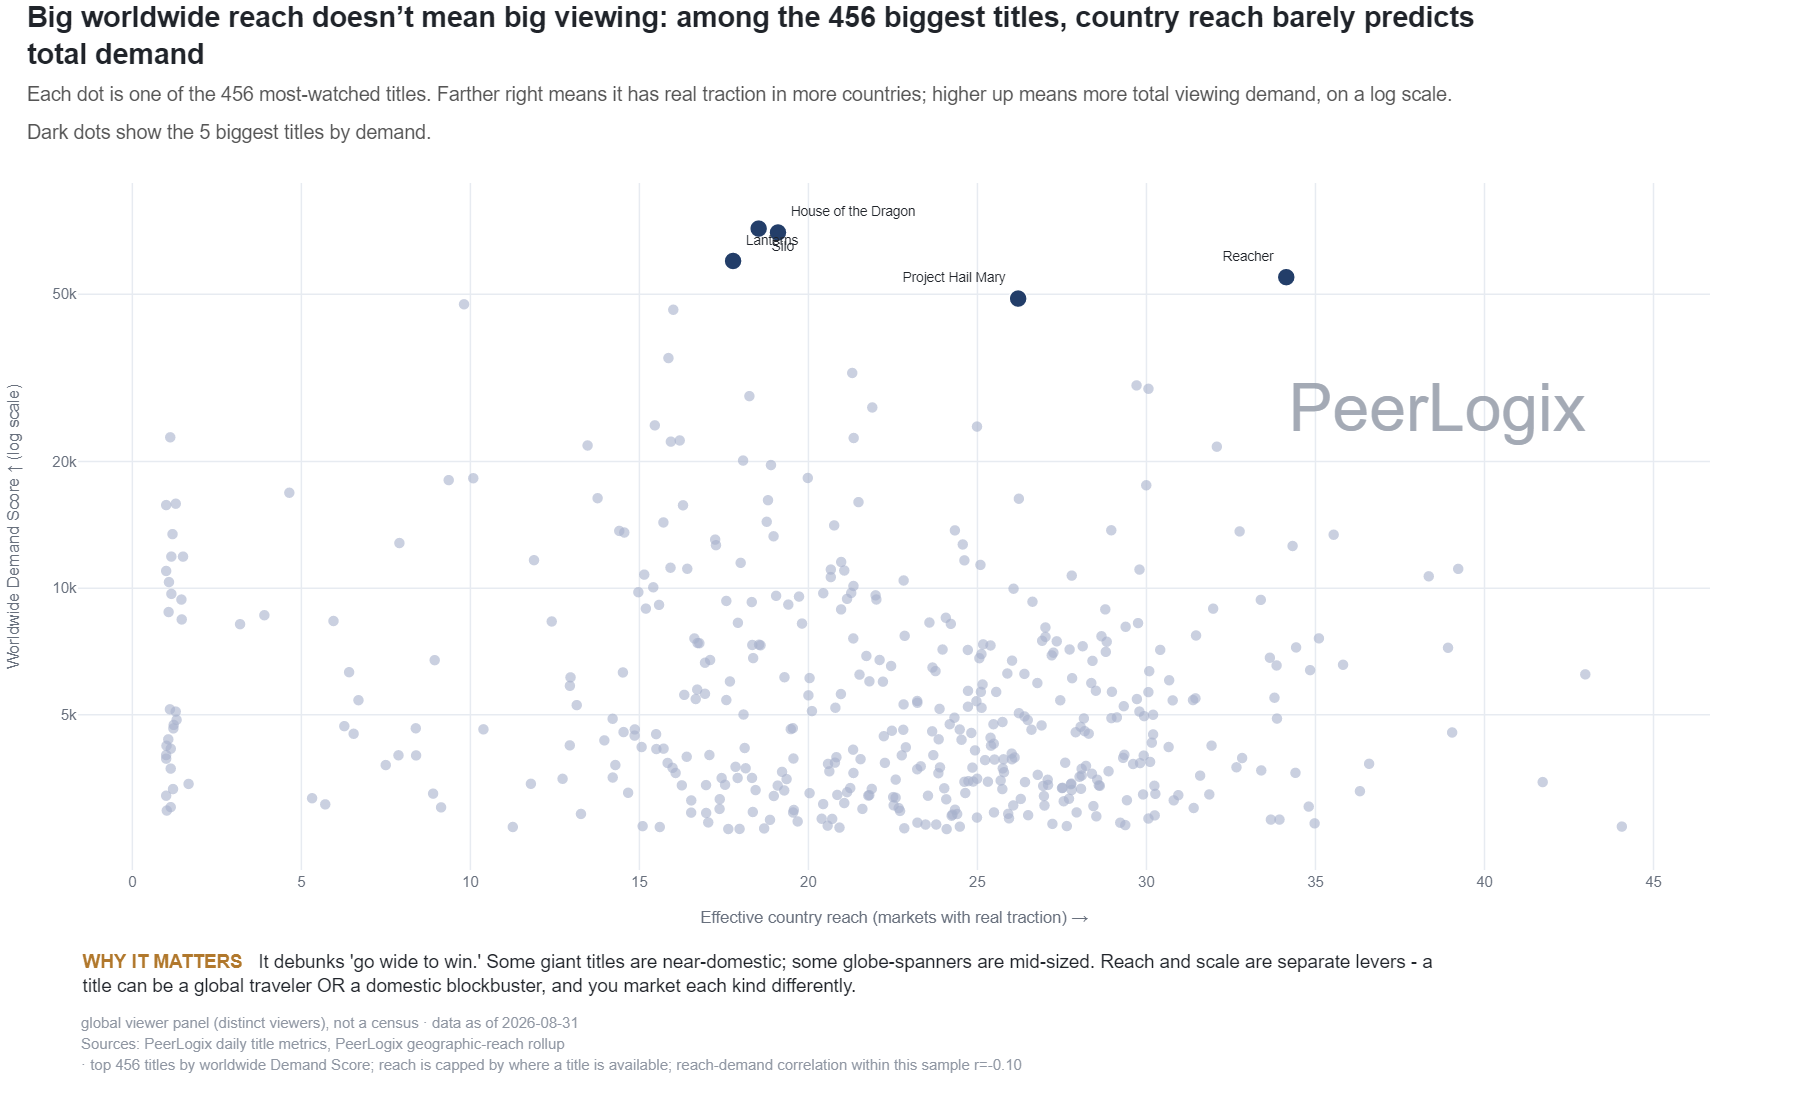
Global & Local Demand monthly
Geographic breadth compared with streaming title demand
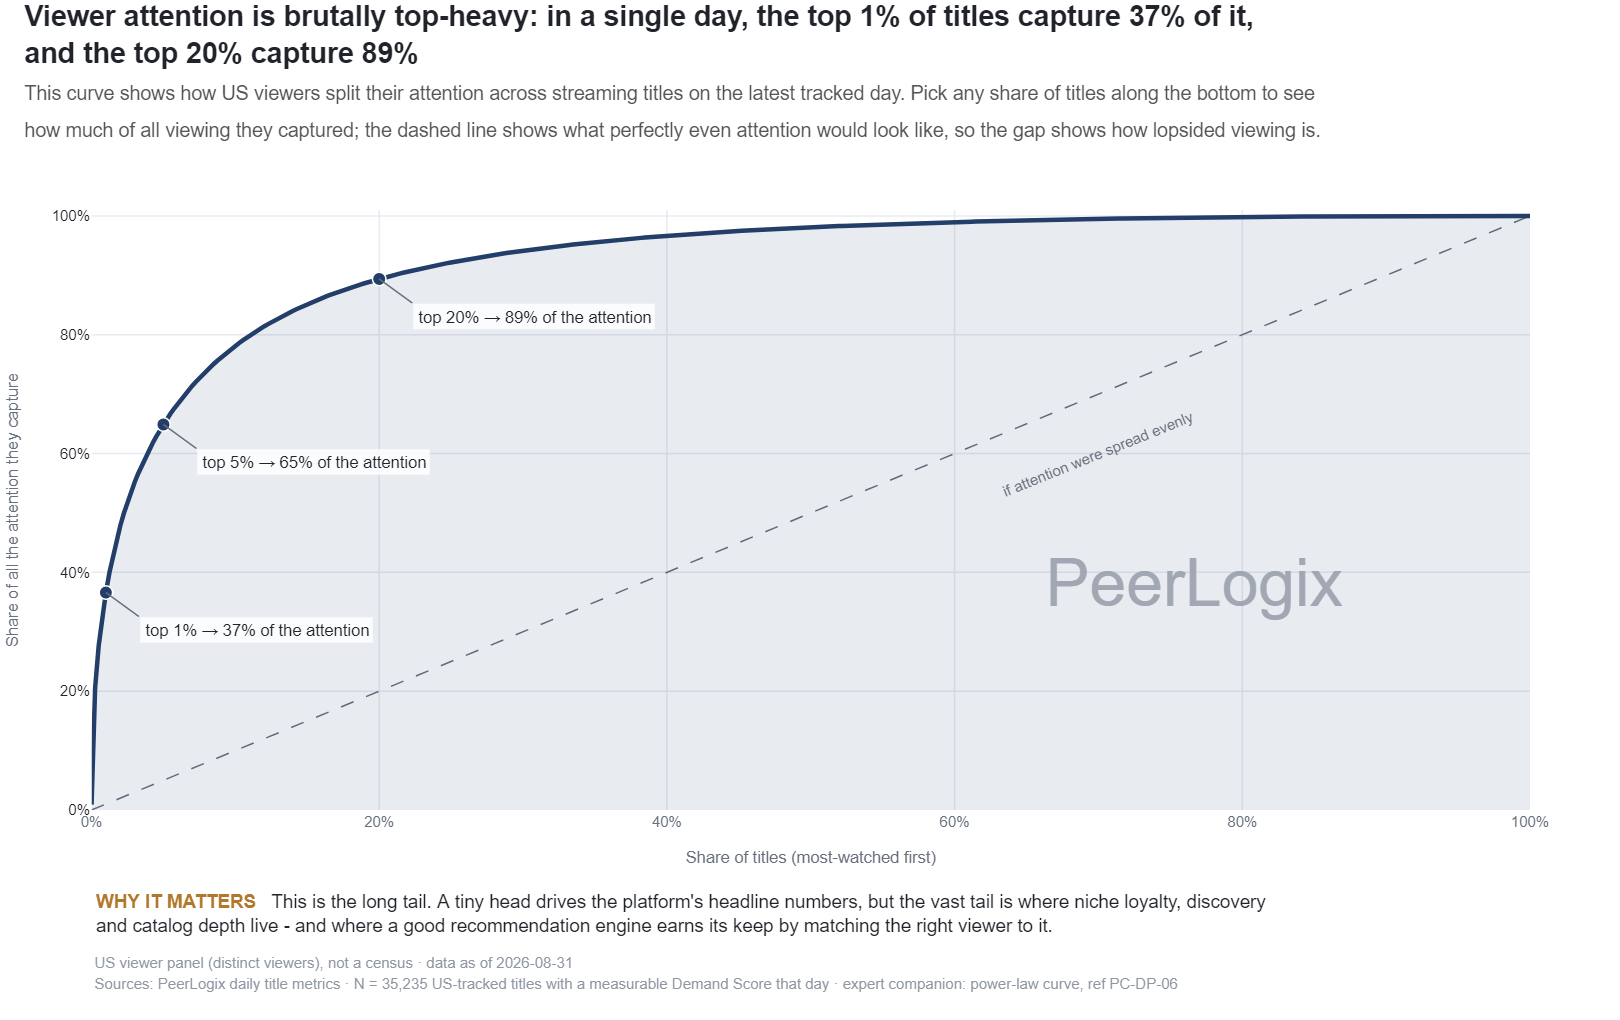
Evergreen & The Long Tail monthly
How streaming demand is distributed across the title catalog
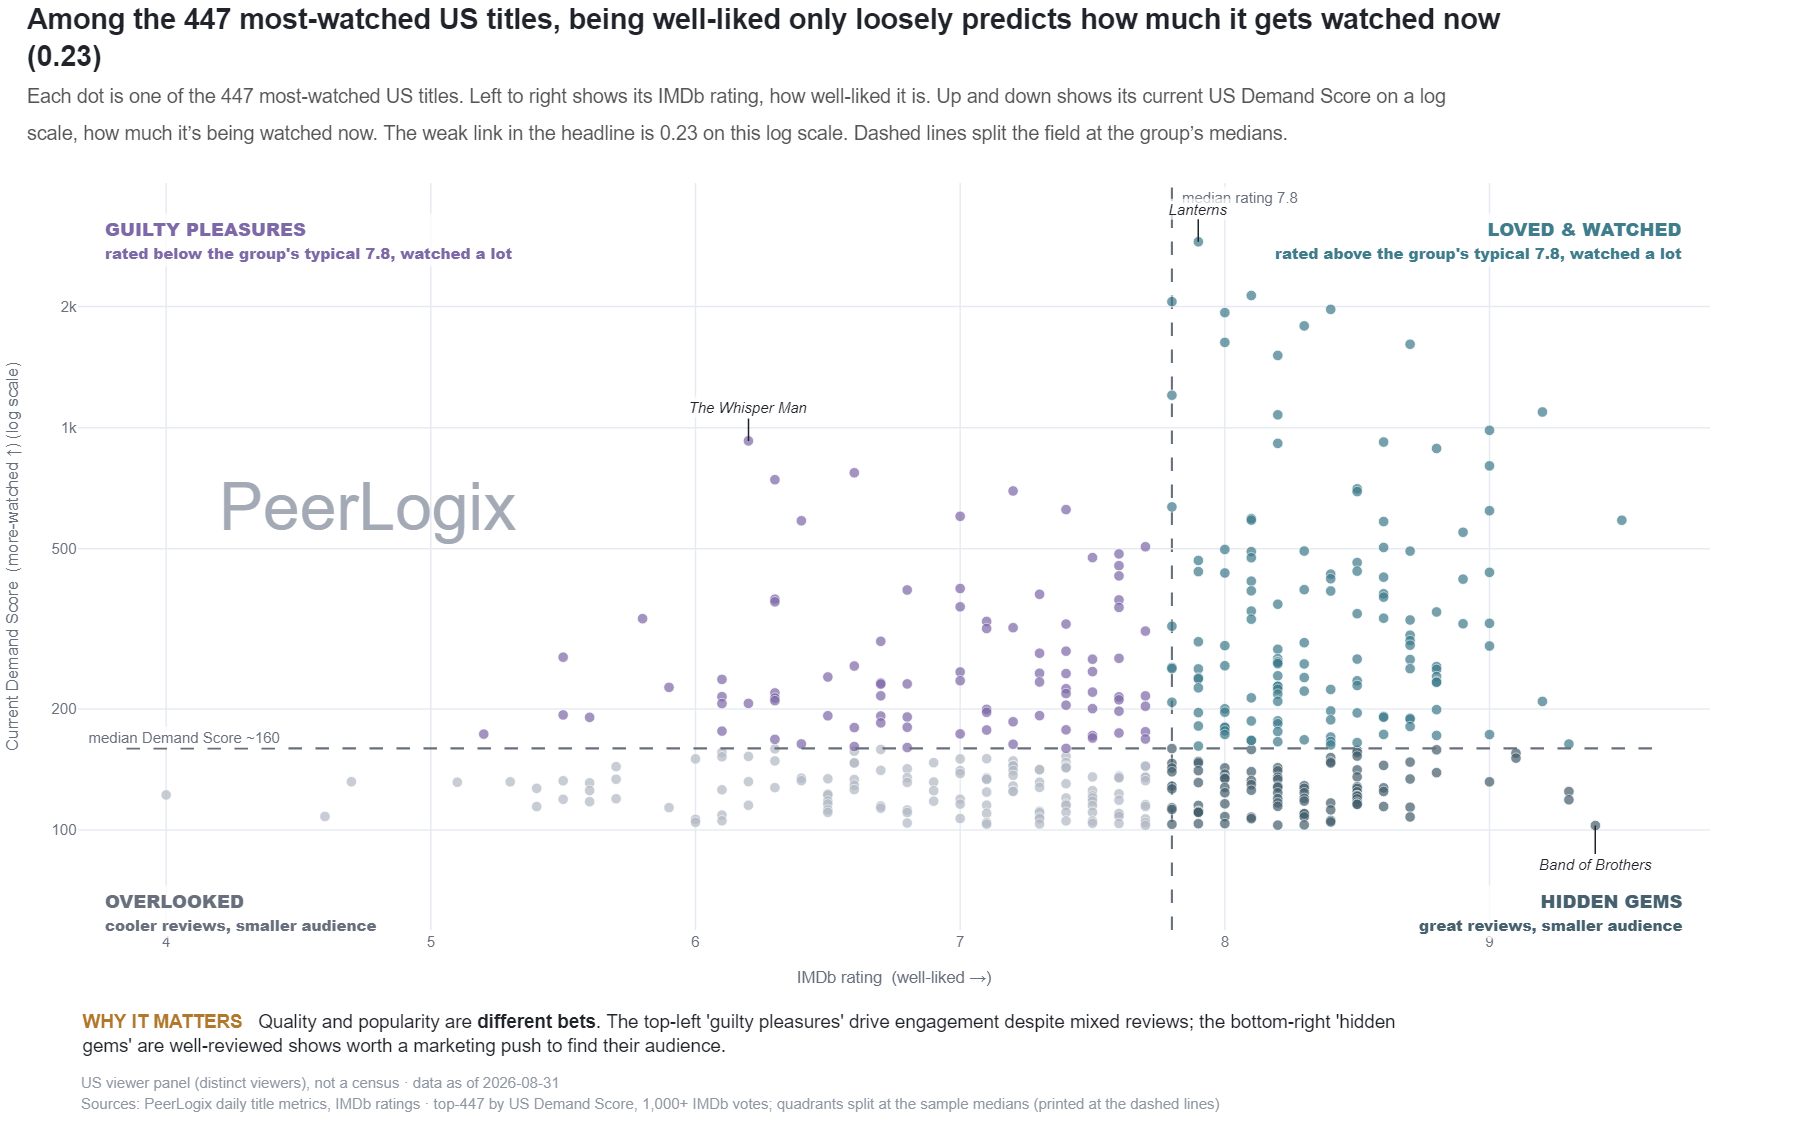
Quality & Reception monthly
IMDb ratings compared with current title-demand scores
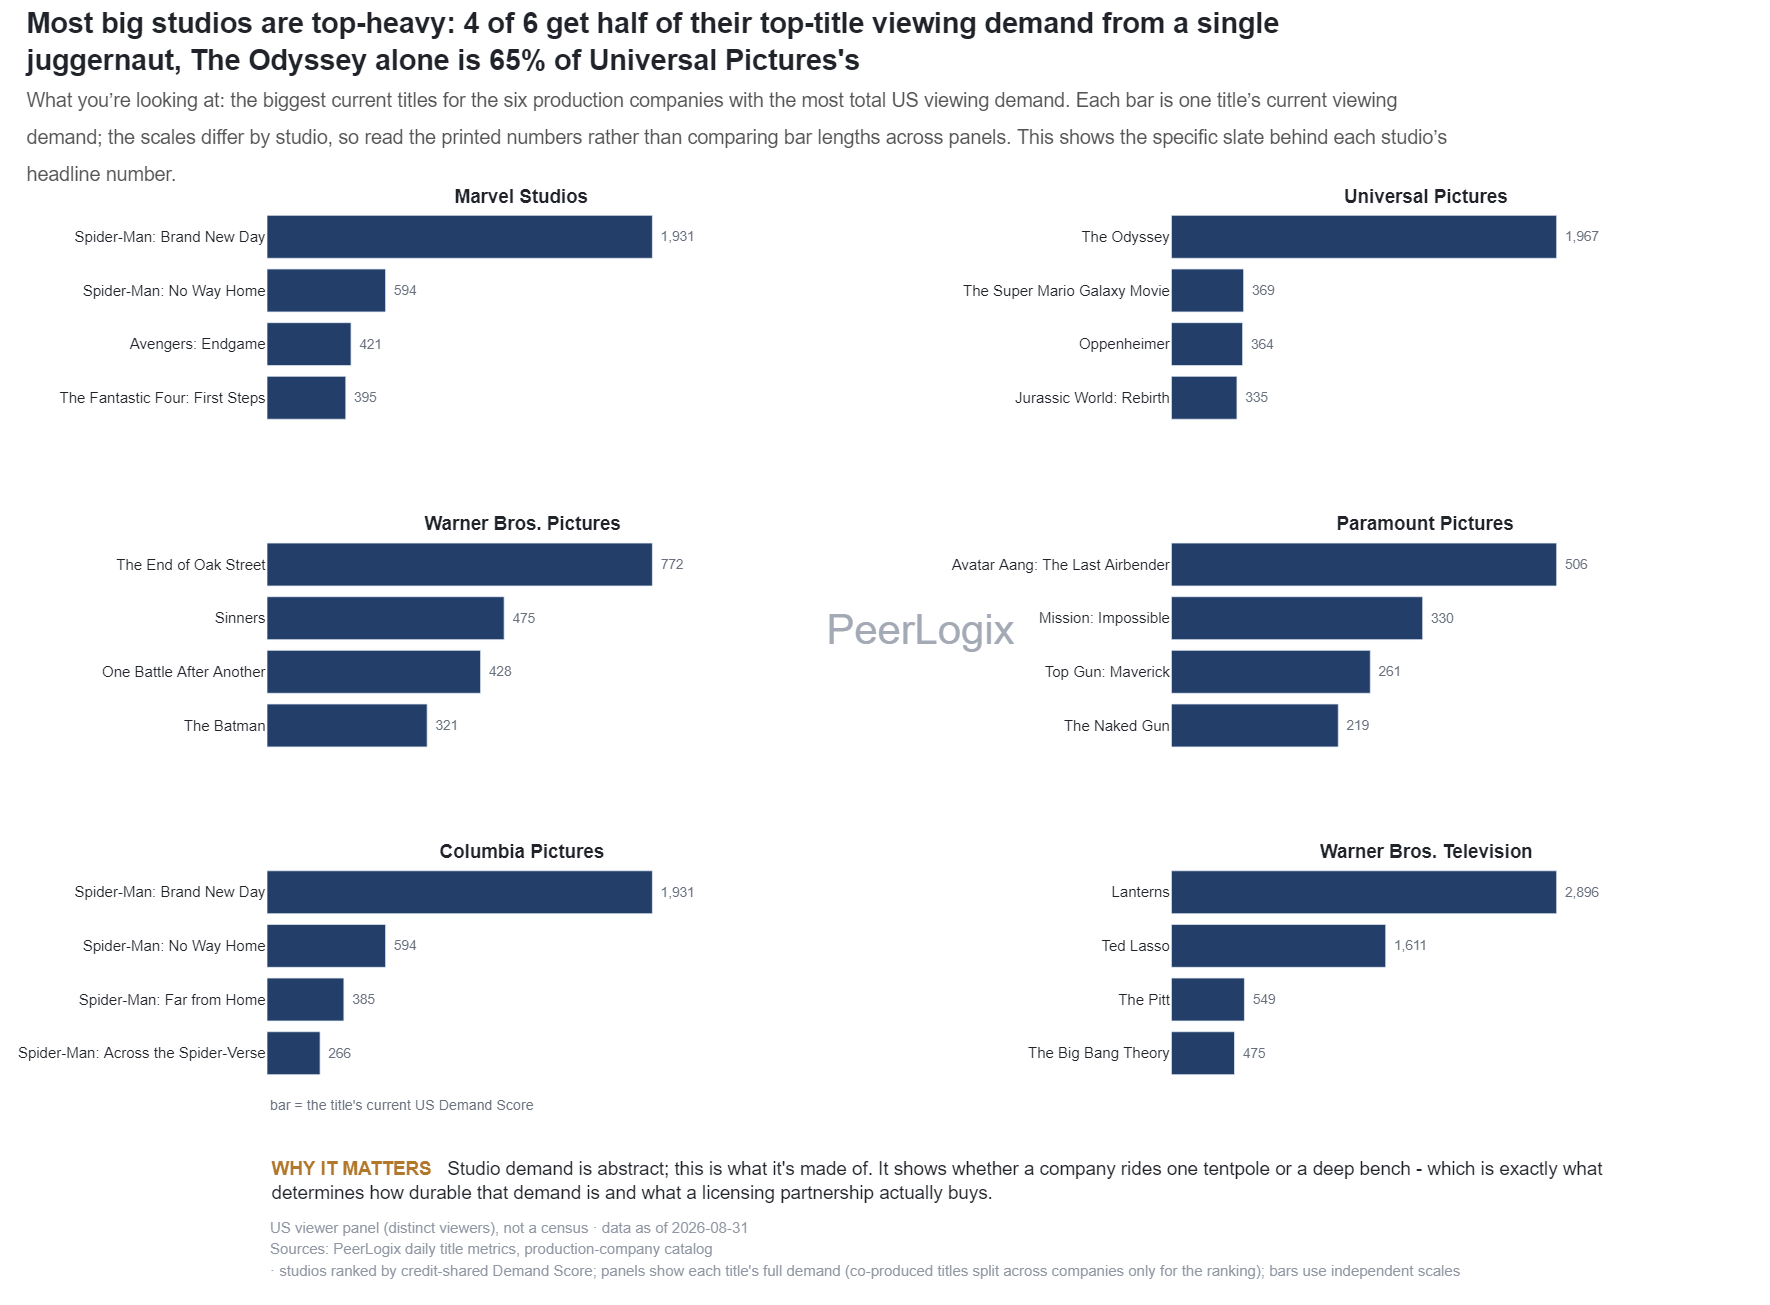
Talent & Studios monthly
Leading titles in production-company demand portfolios
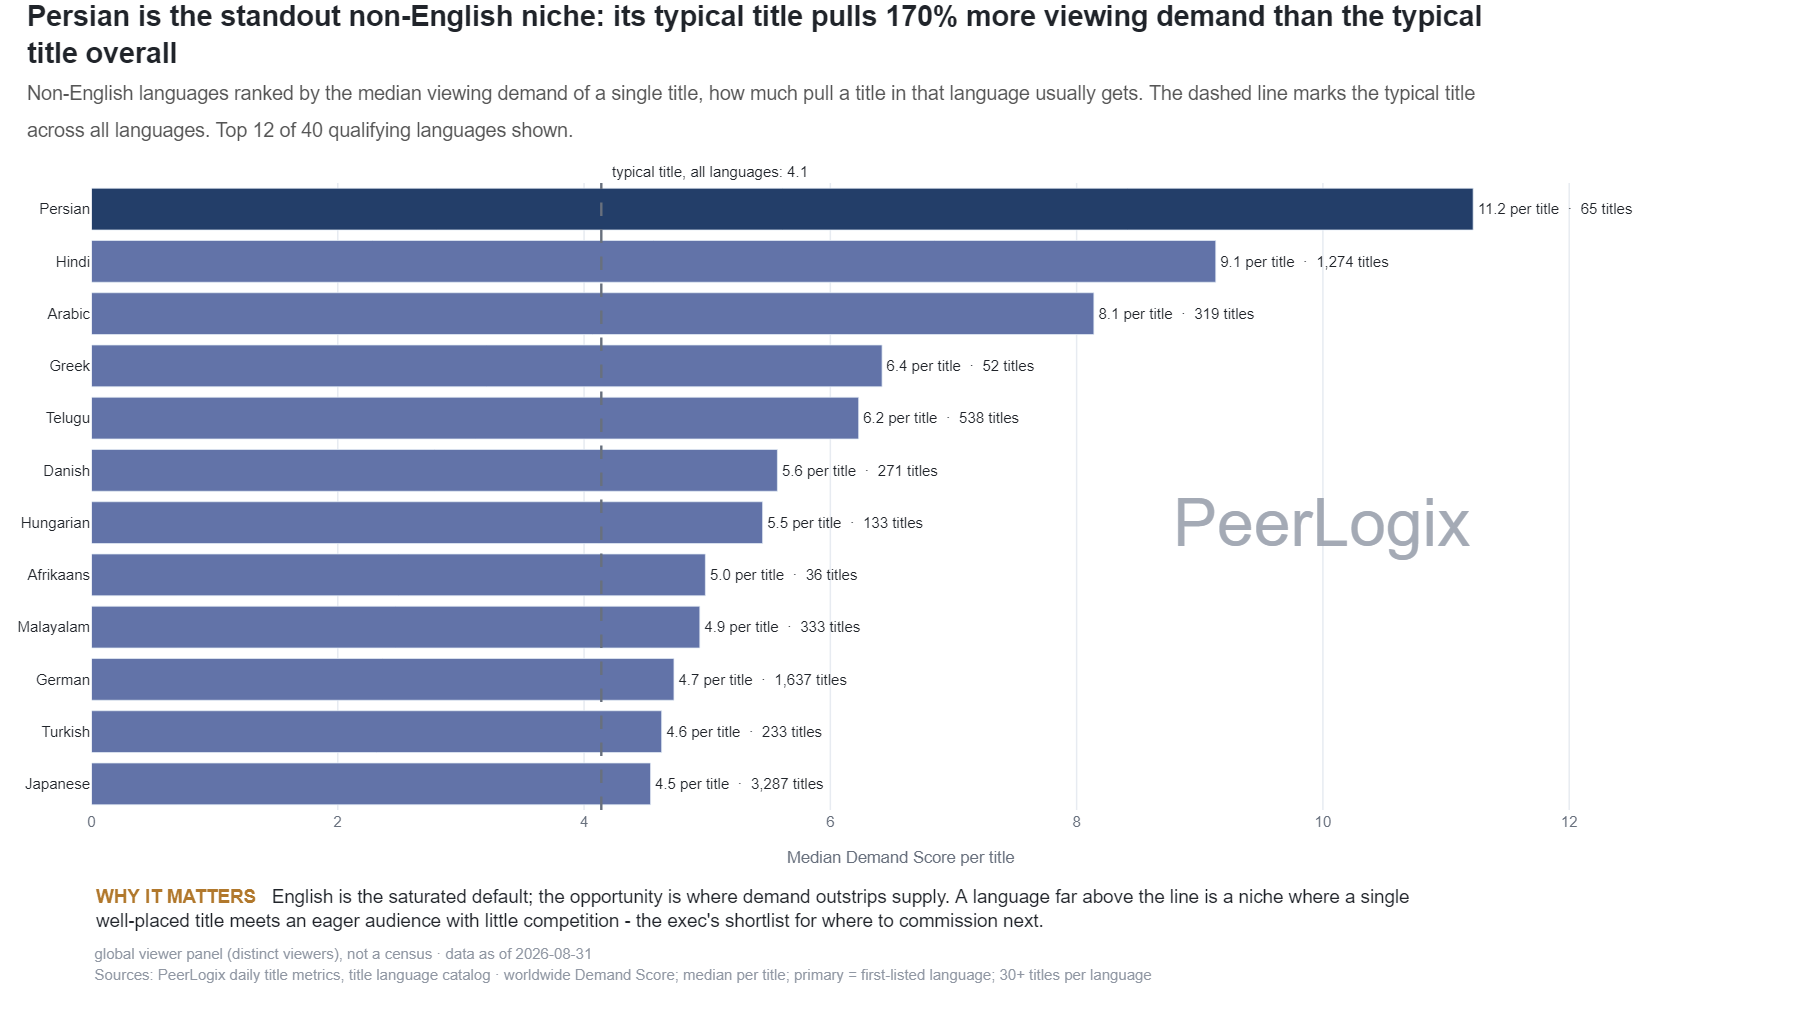
Global & Local Demand monthly
Median title demand by non-English language
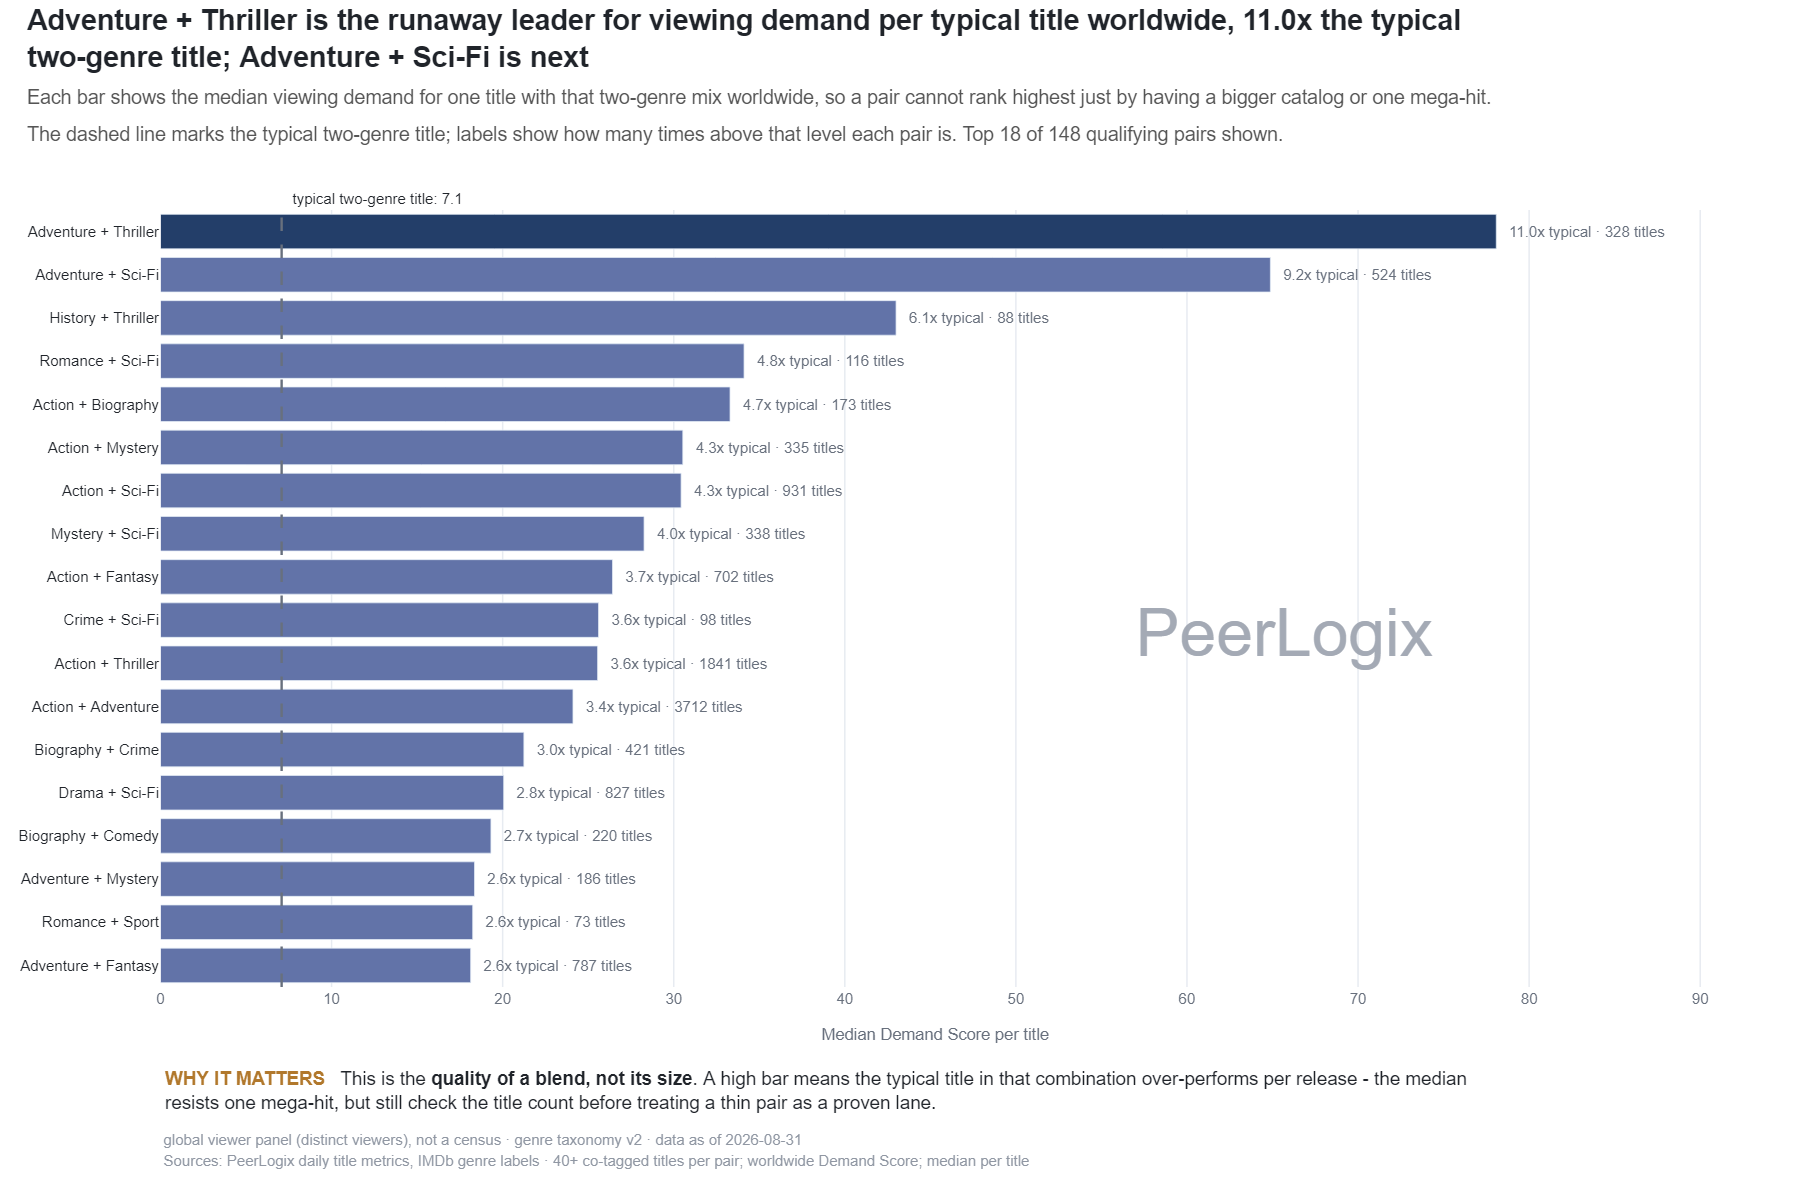
Genres & Taste monthly
Median viewing demand for two-genre combinations
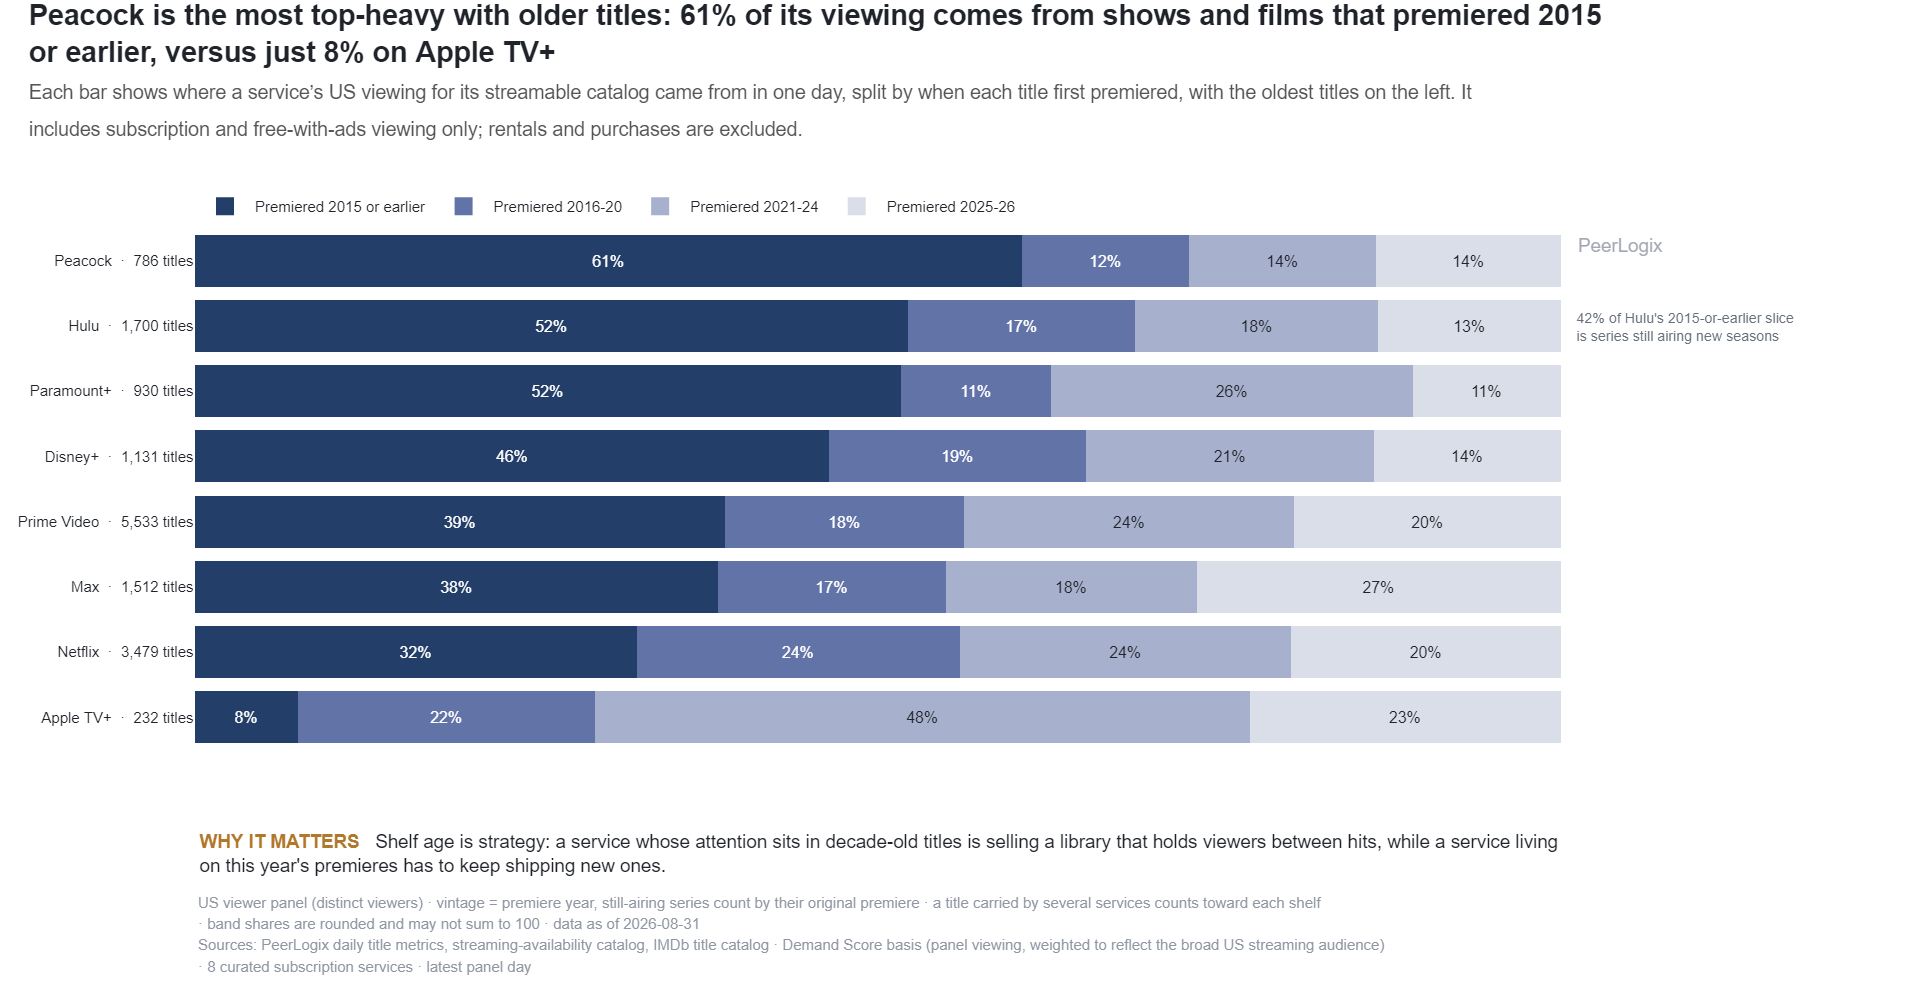
Platforms & Streaming Strategy monthly
Older titles and new premieres in streaming catalogs
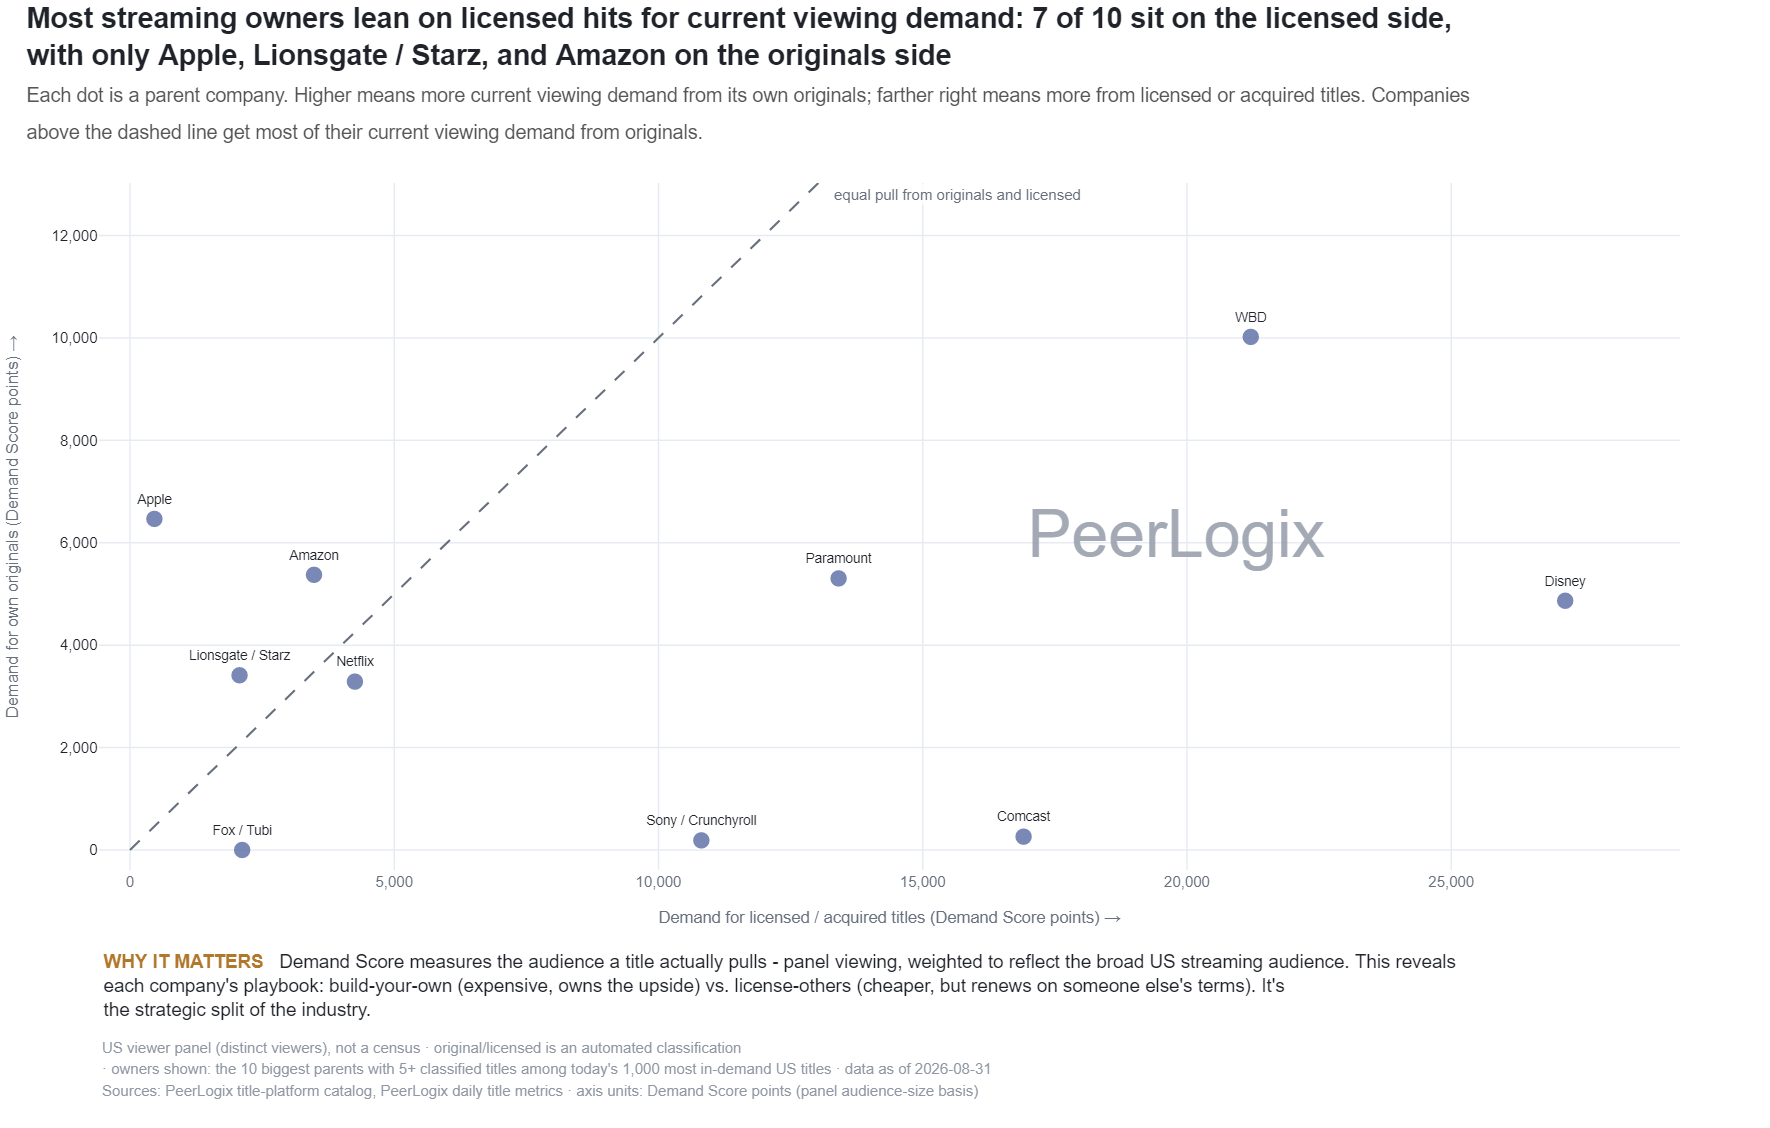
Platforms & Streaming Strategy monthly
Original and licensed catalog demand by parent company
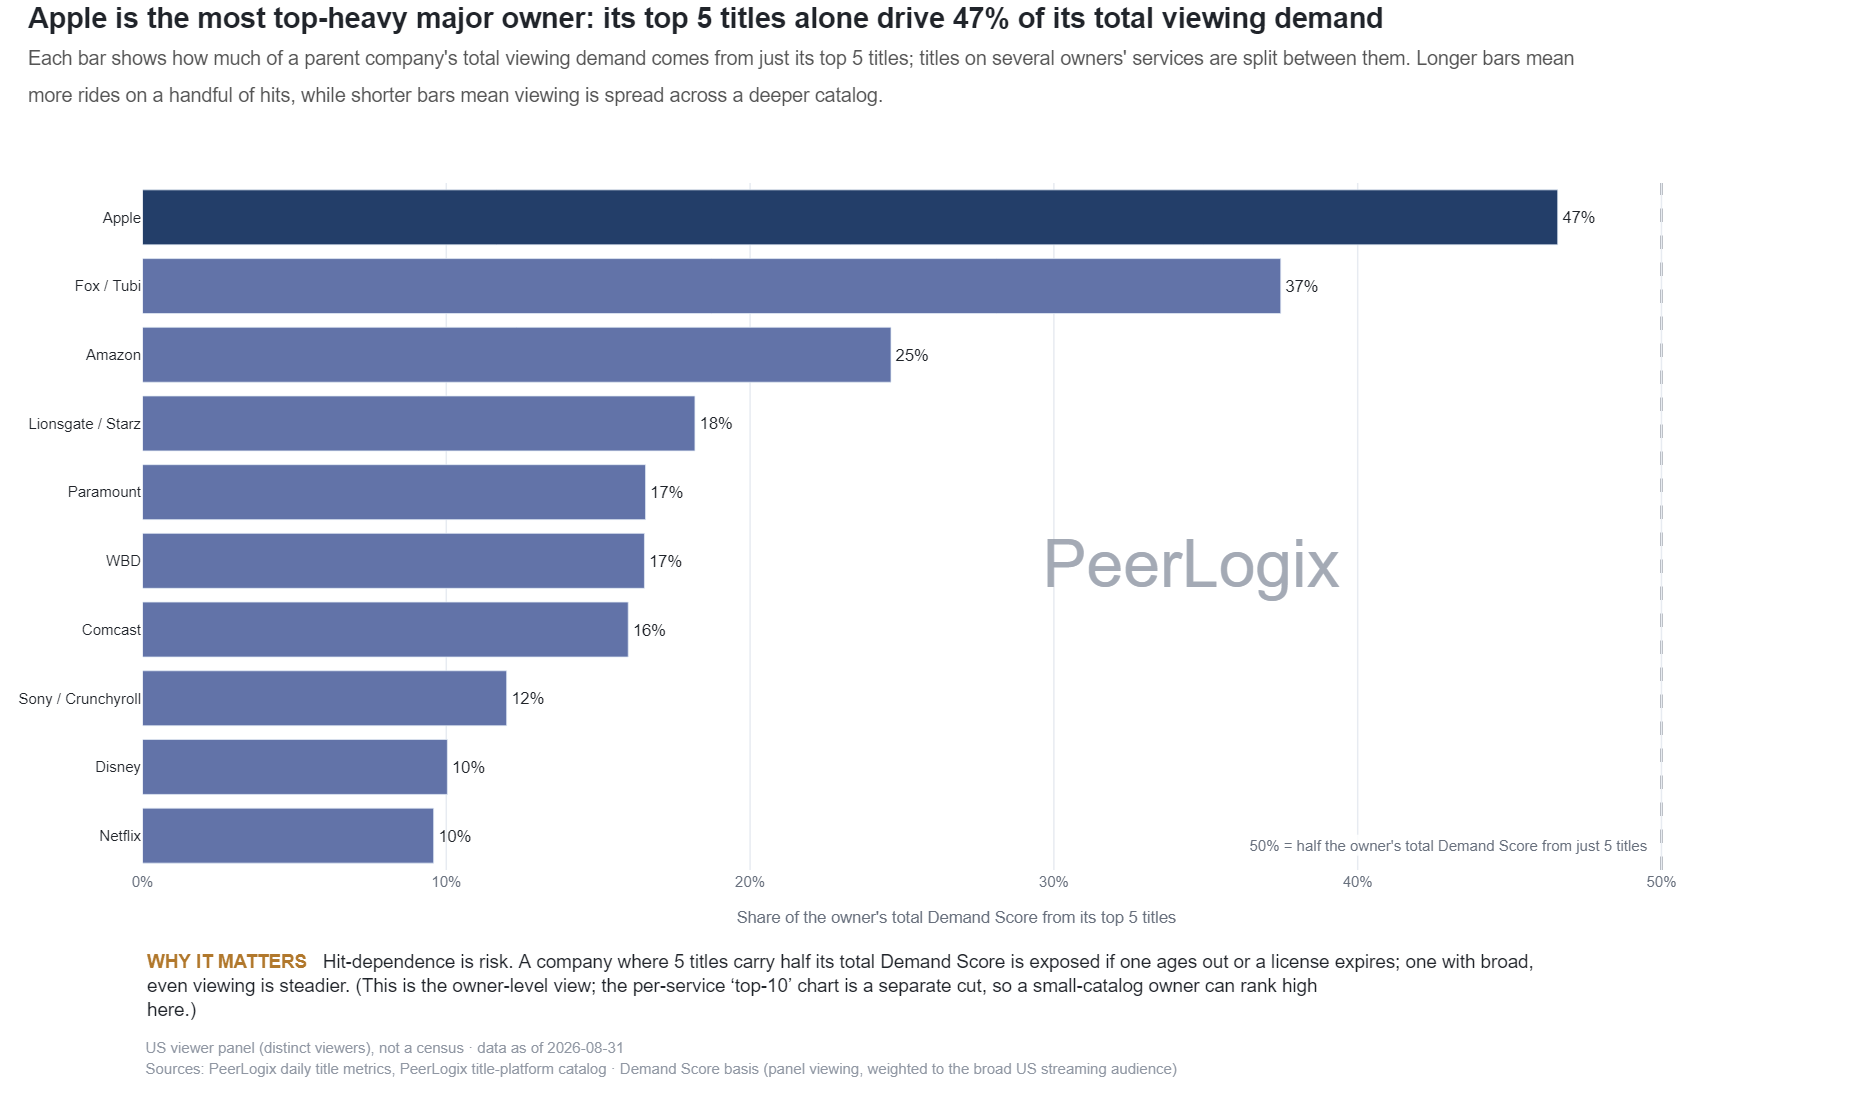
Platforms & Streaming Strategy monthly
Parent-company catalog concentration in the top five titles
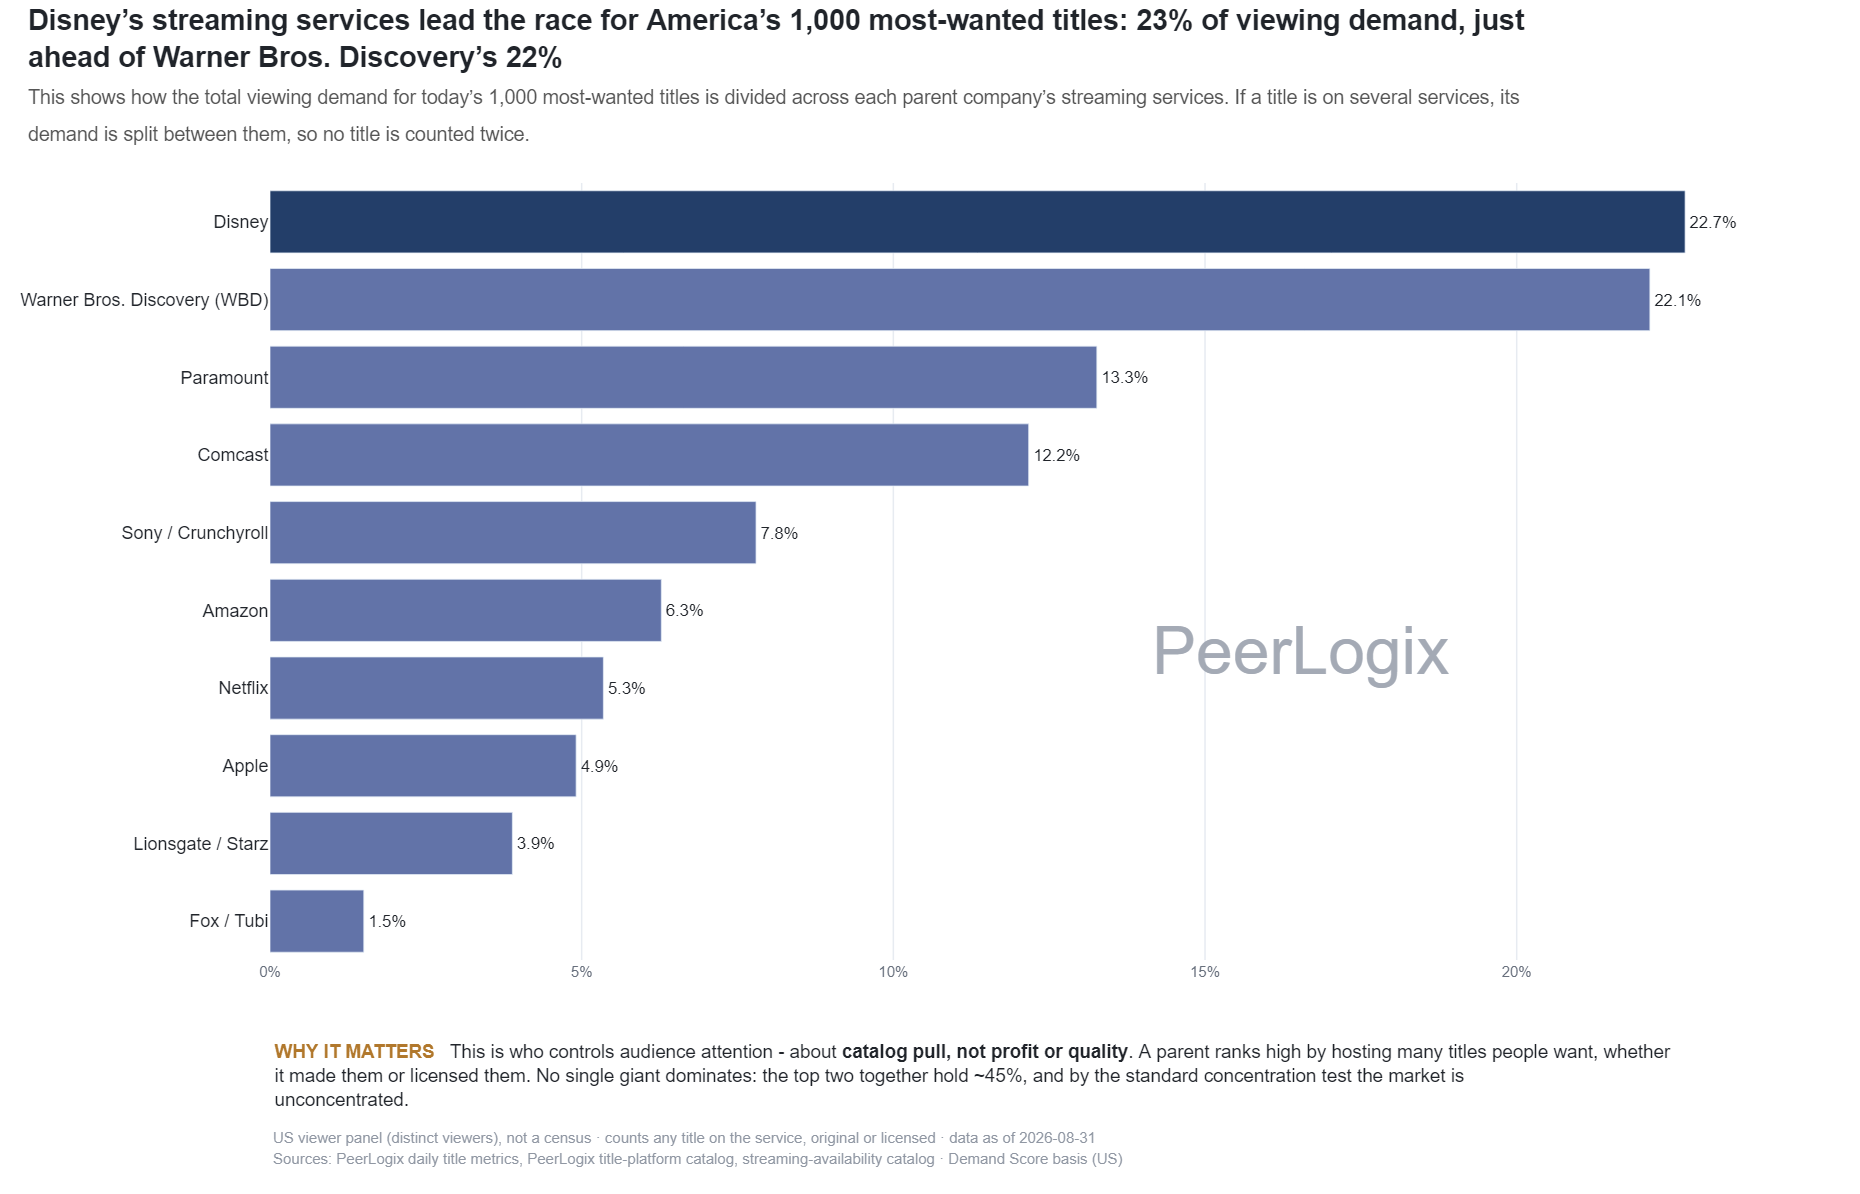
Platforms & Streaming Strategy monthly
Parent-company shares of covered streaming title demand
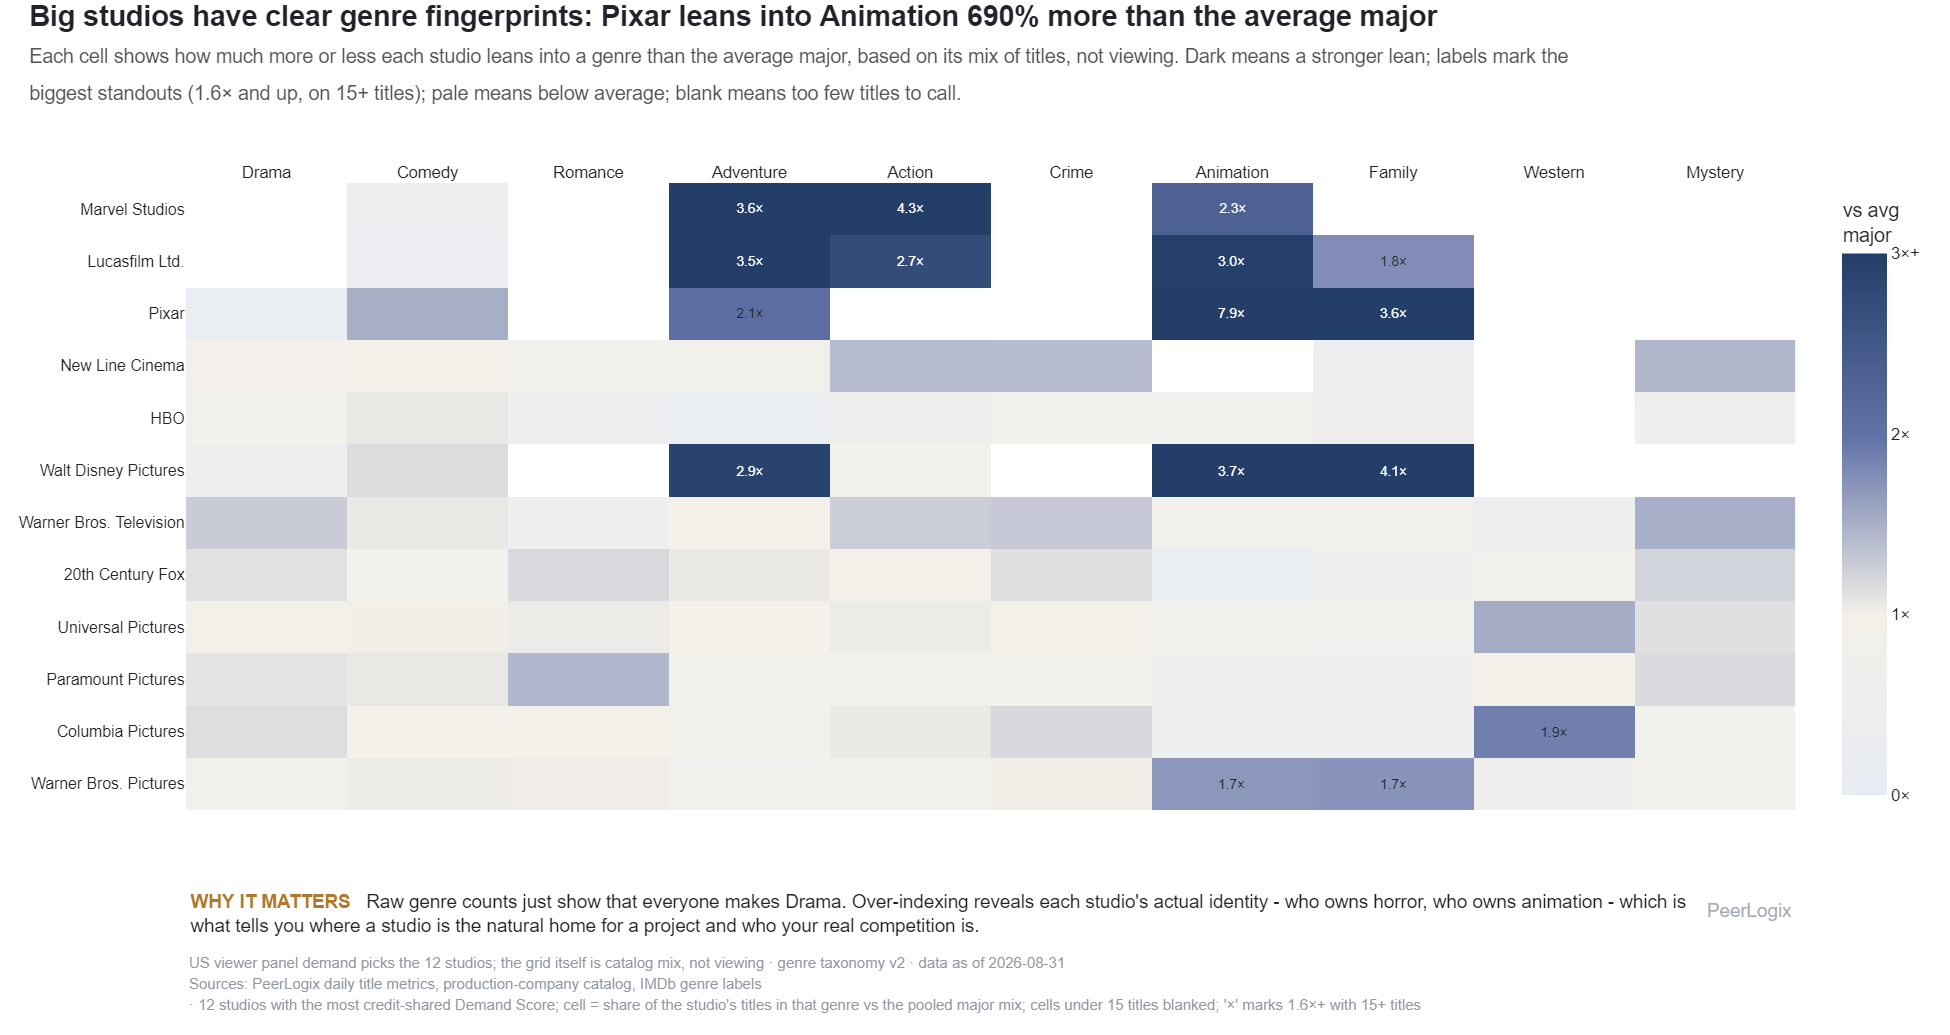
Talent & Studios monthly
Production-company genre specialties by title count
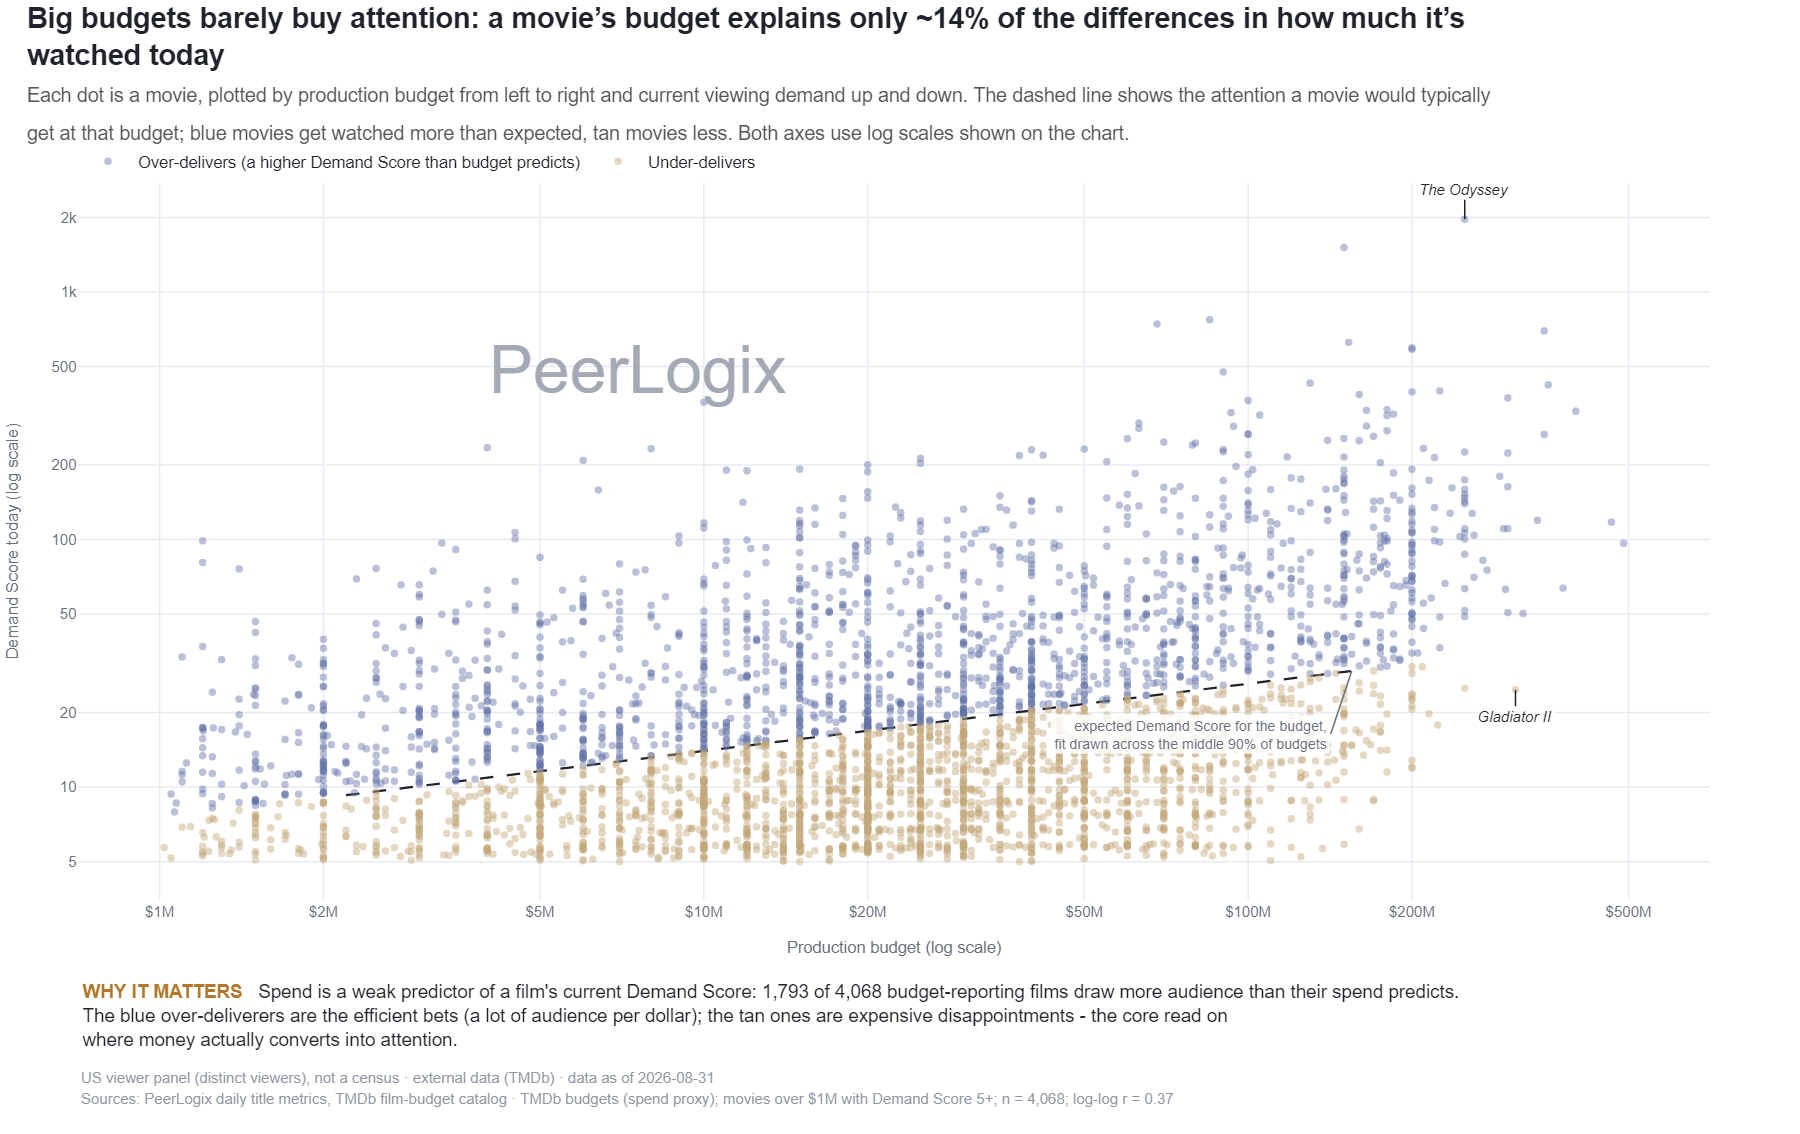
Spend & ROI monthly
Reported movie budgets compared with current demand
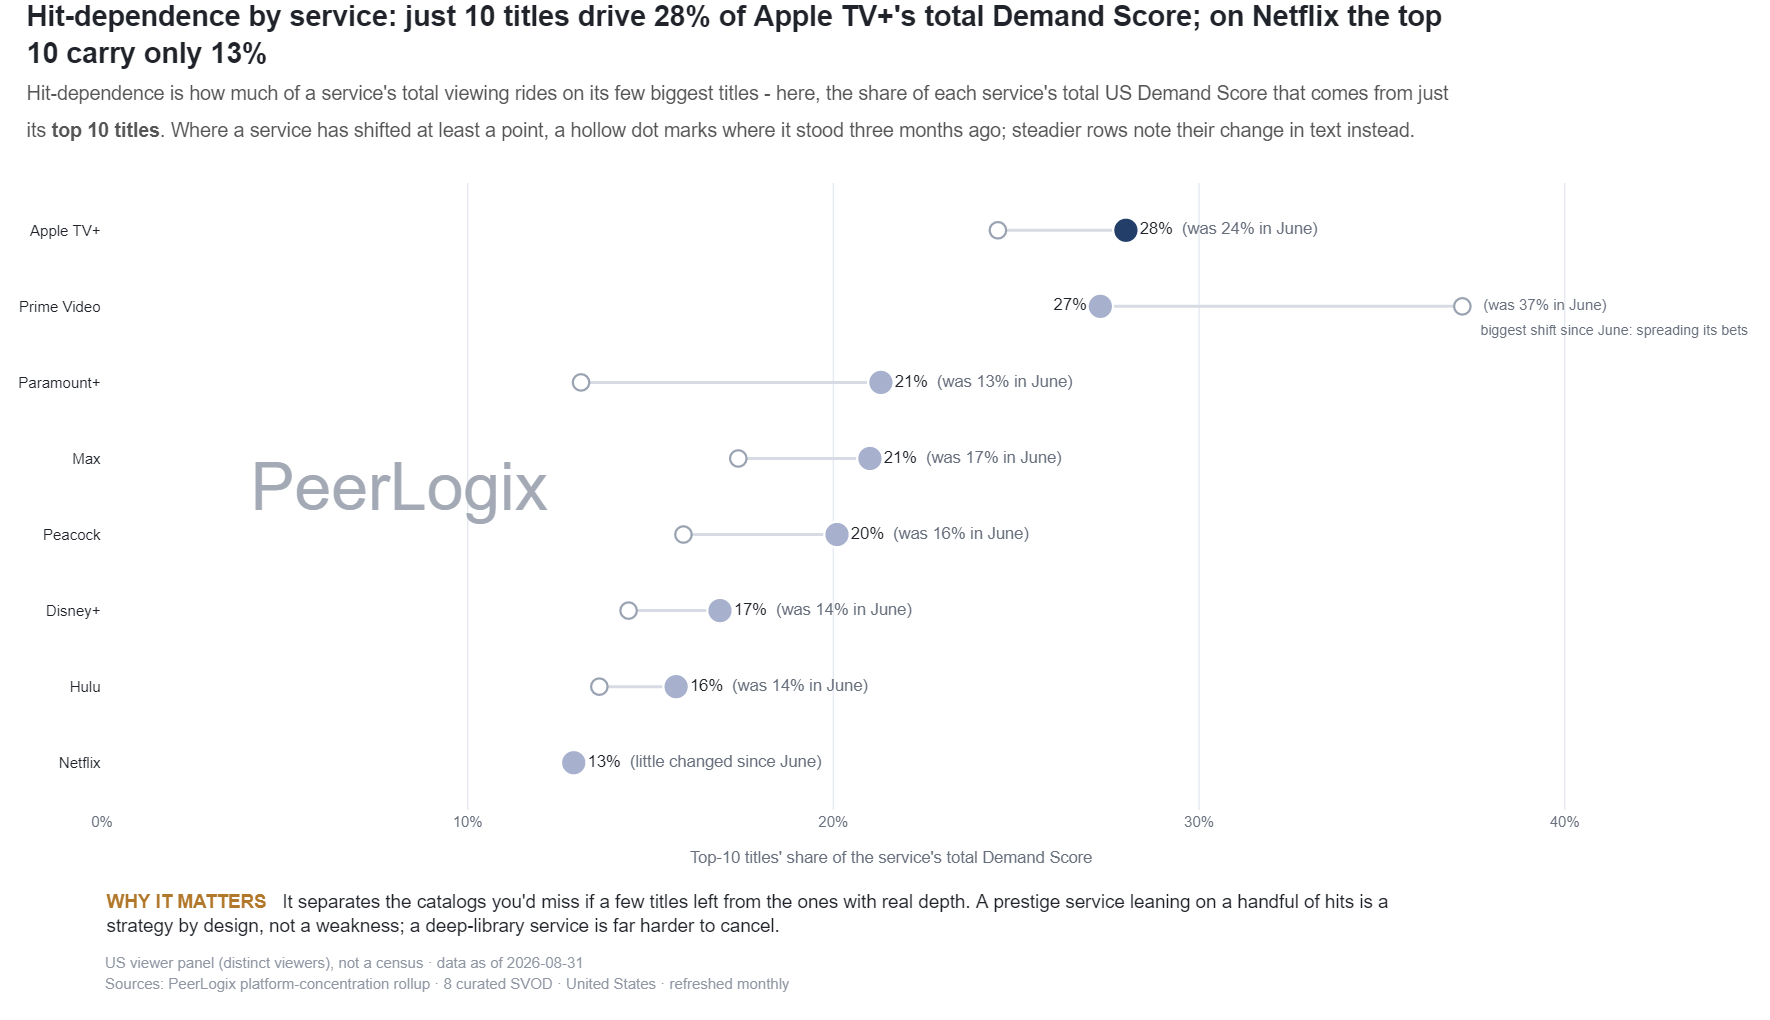
Trackers & Standings monthly
Streaming catalog concentration in the top ten titles
Platforms & Streaming Strategy monthly
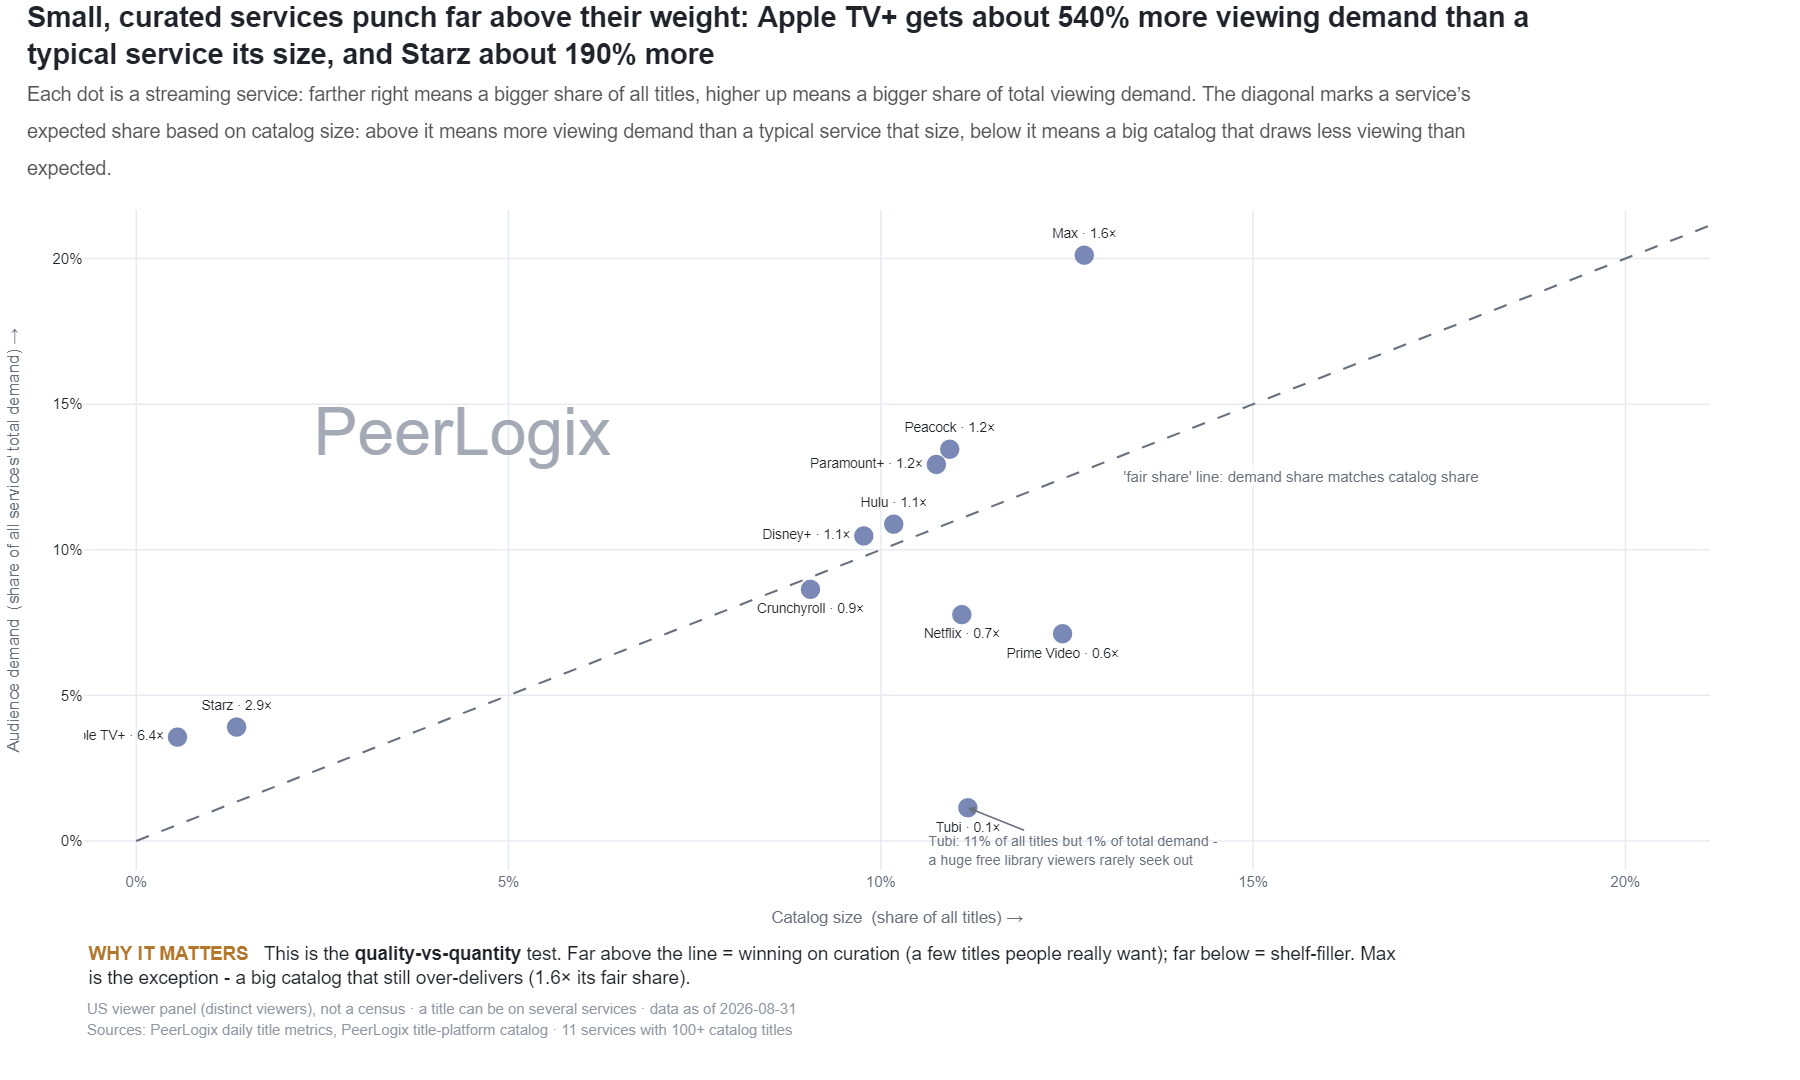
Streaming catalog size compared with title-demand share
Platforms & Streaming Strategy monthly
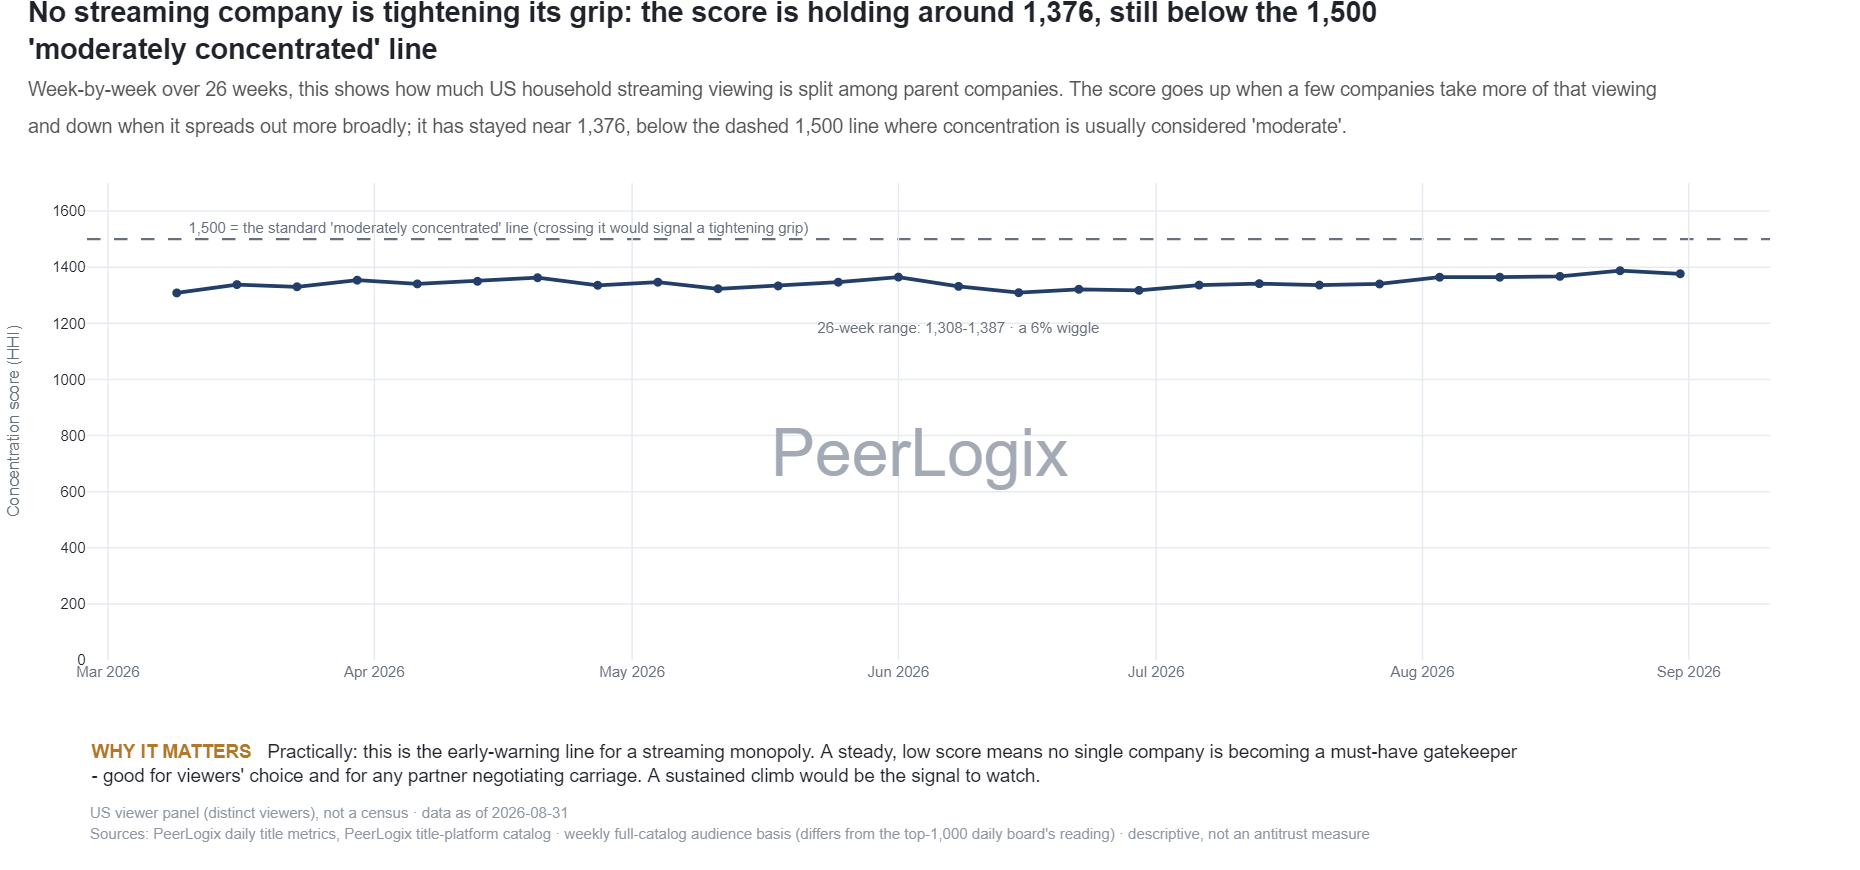
Streaming parent-company concentration over time
Platforms & Streaming Strategy monthly
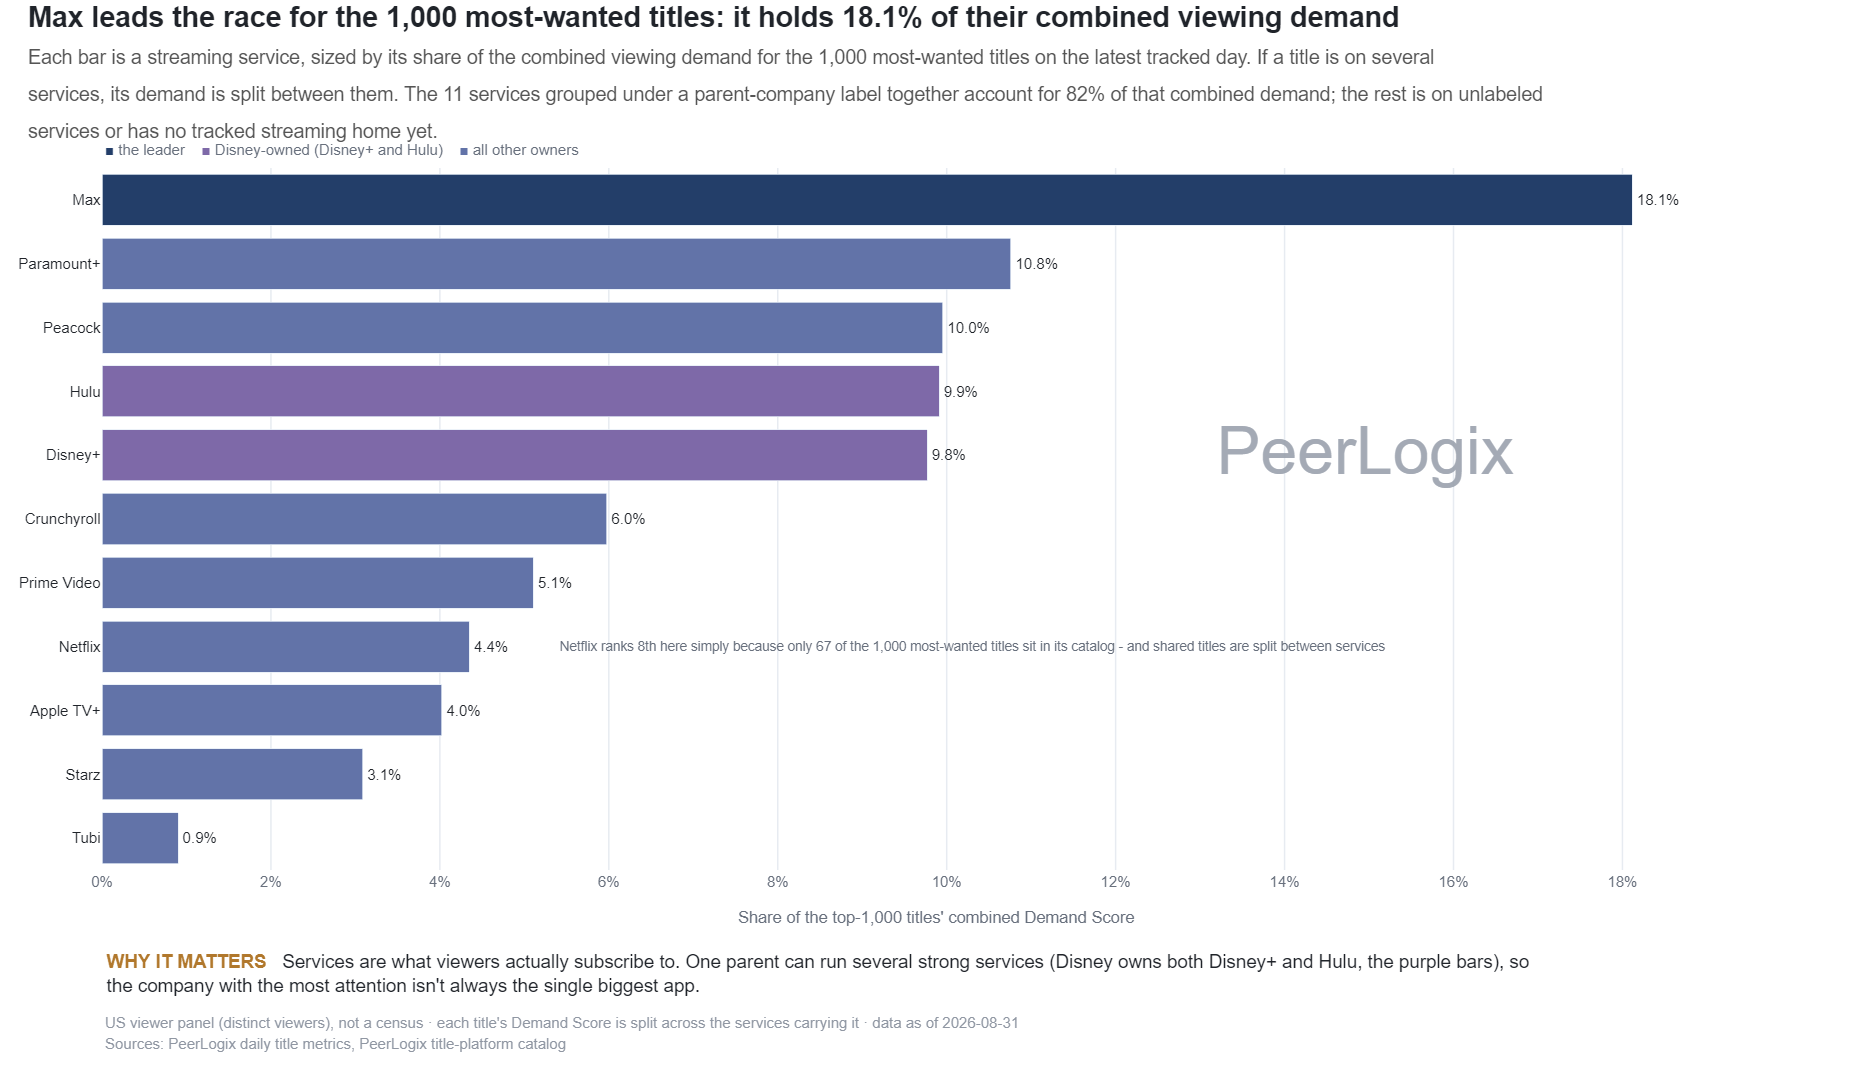
Streaming service catalog shares of top-title demand
Global & Local Demand monthly
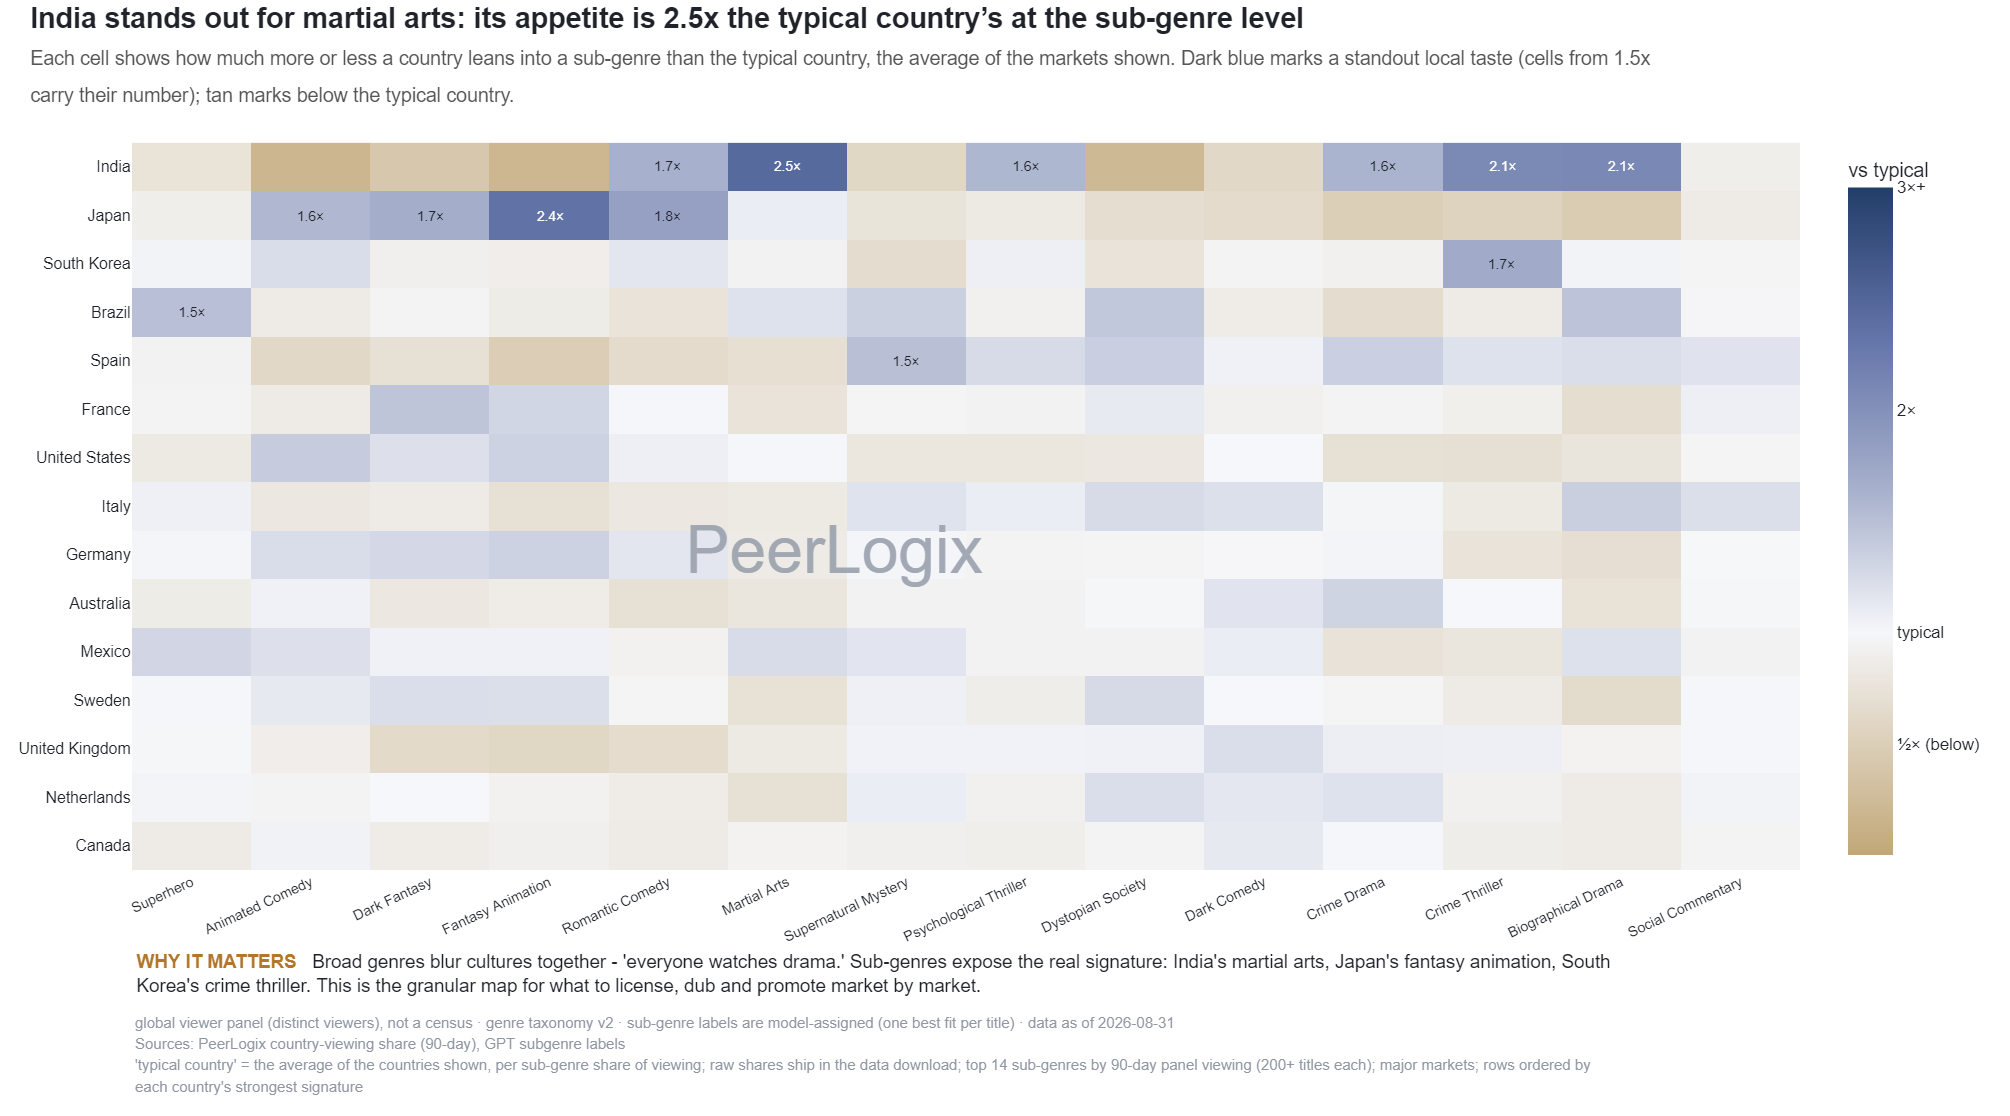
Subgenre patterns across covered country audiences
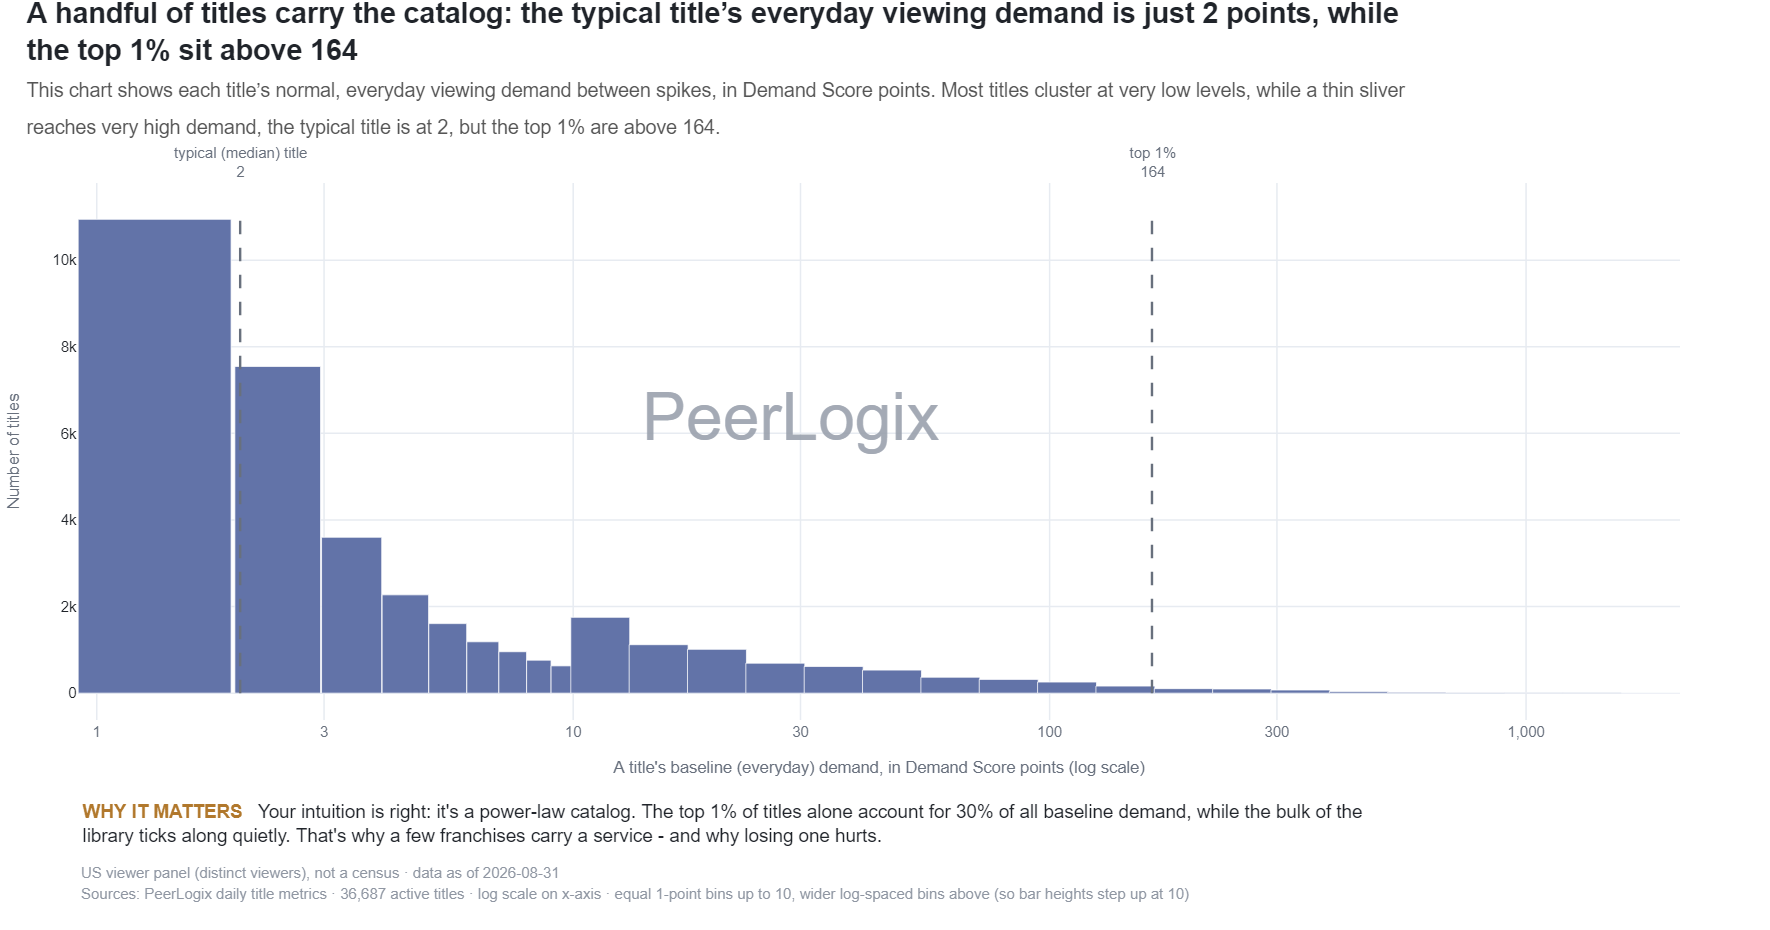
Demand & Momentum monthly
The distribution of baseline title-demand scores
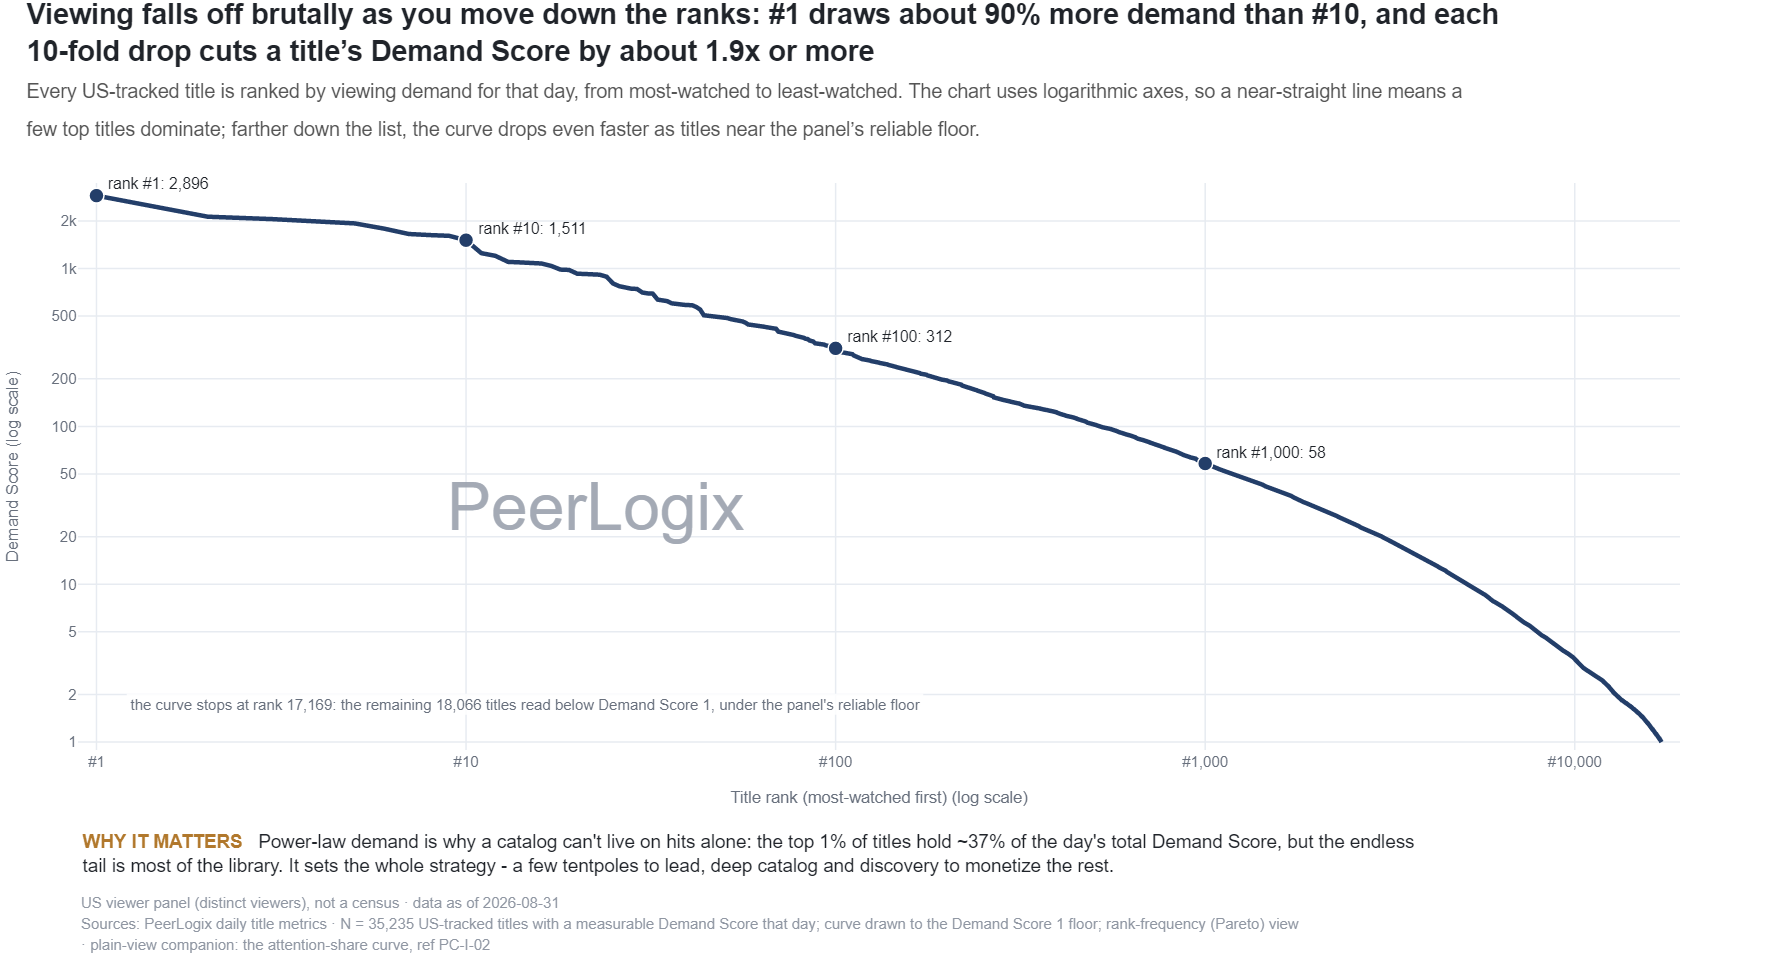
Evergreen & The Long Tail monthly
The long tail of streaming title-demand scores
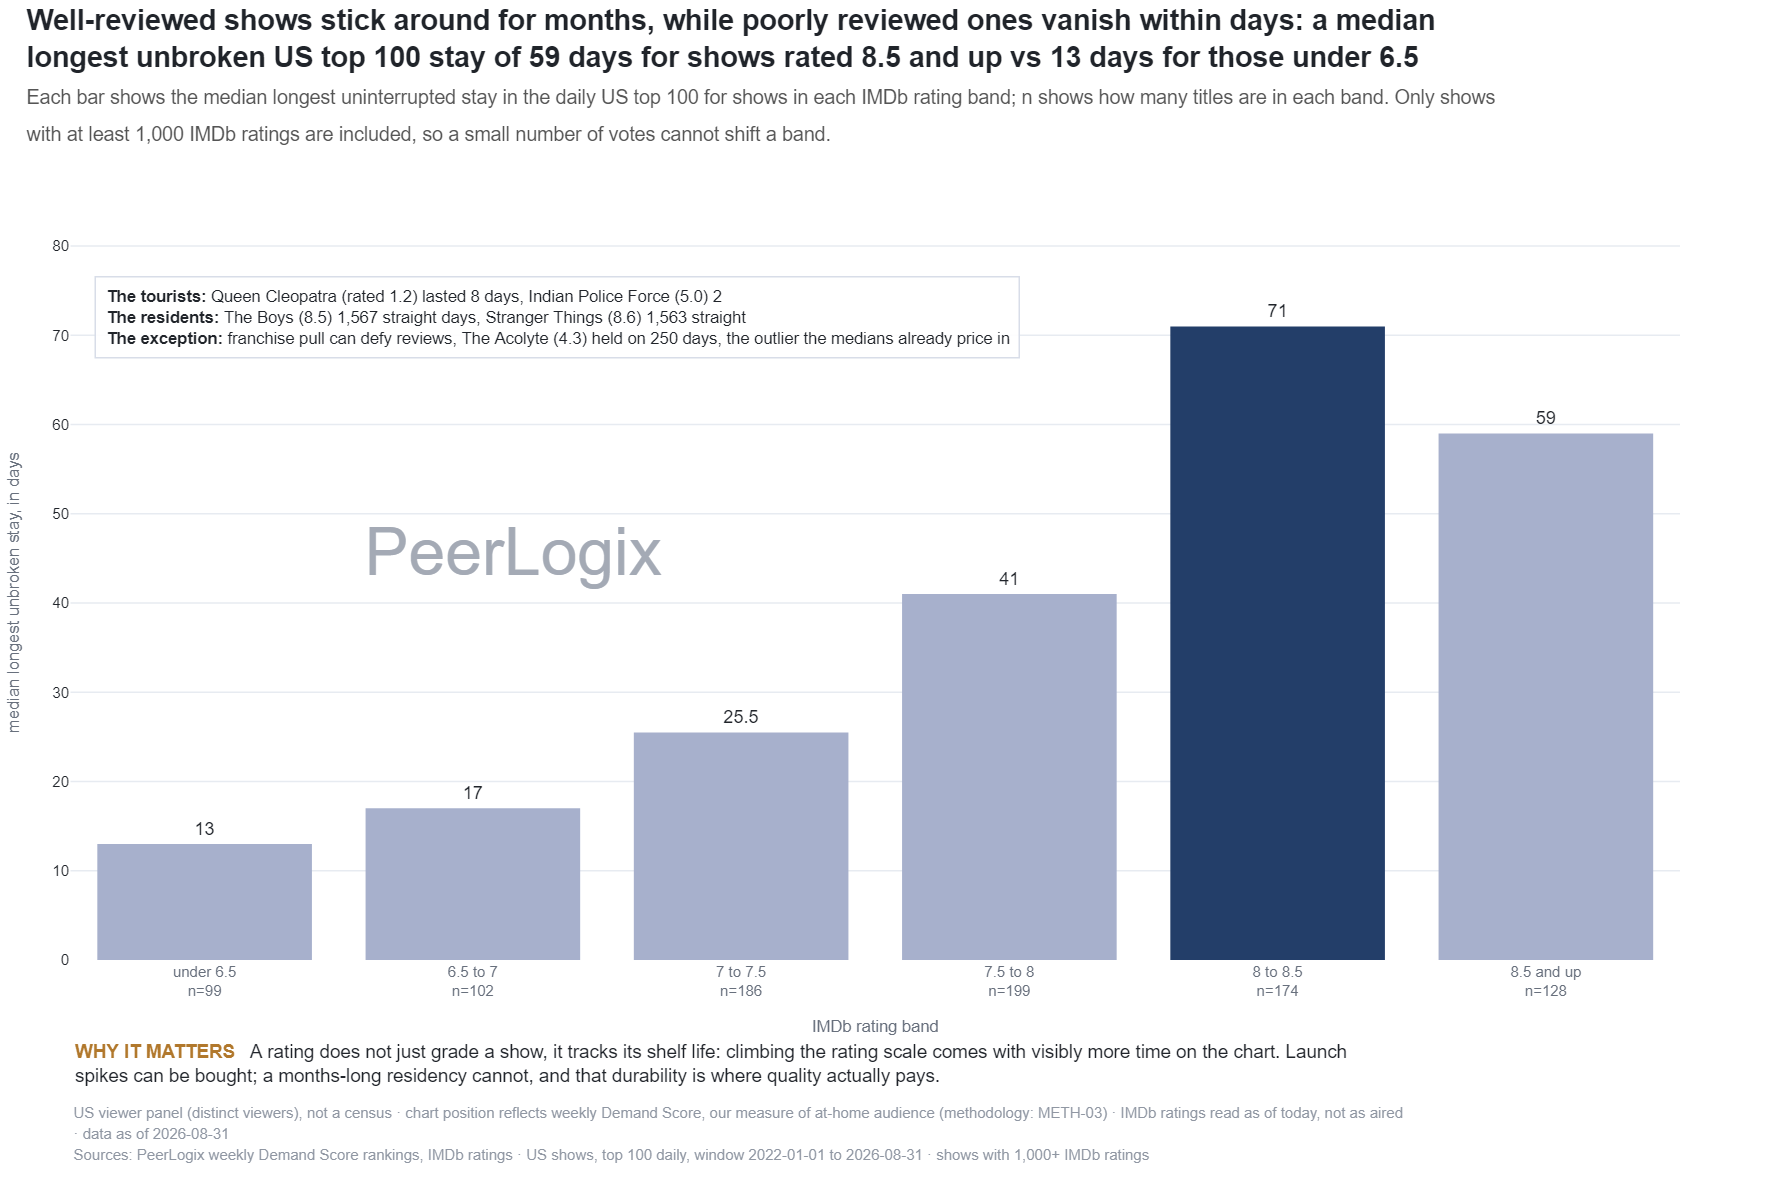
Quality & Reception monthly
Time in the daily top 100 by IMDb rating band
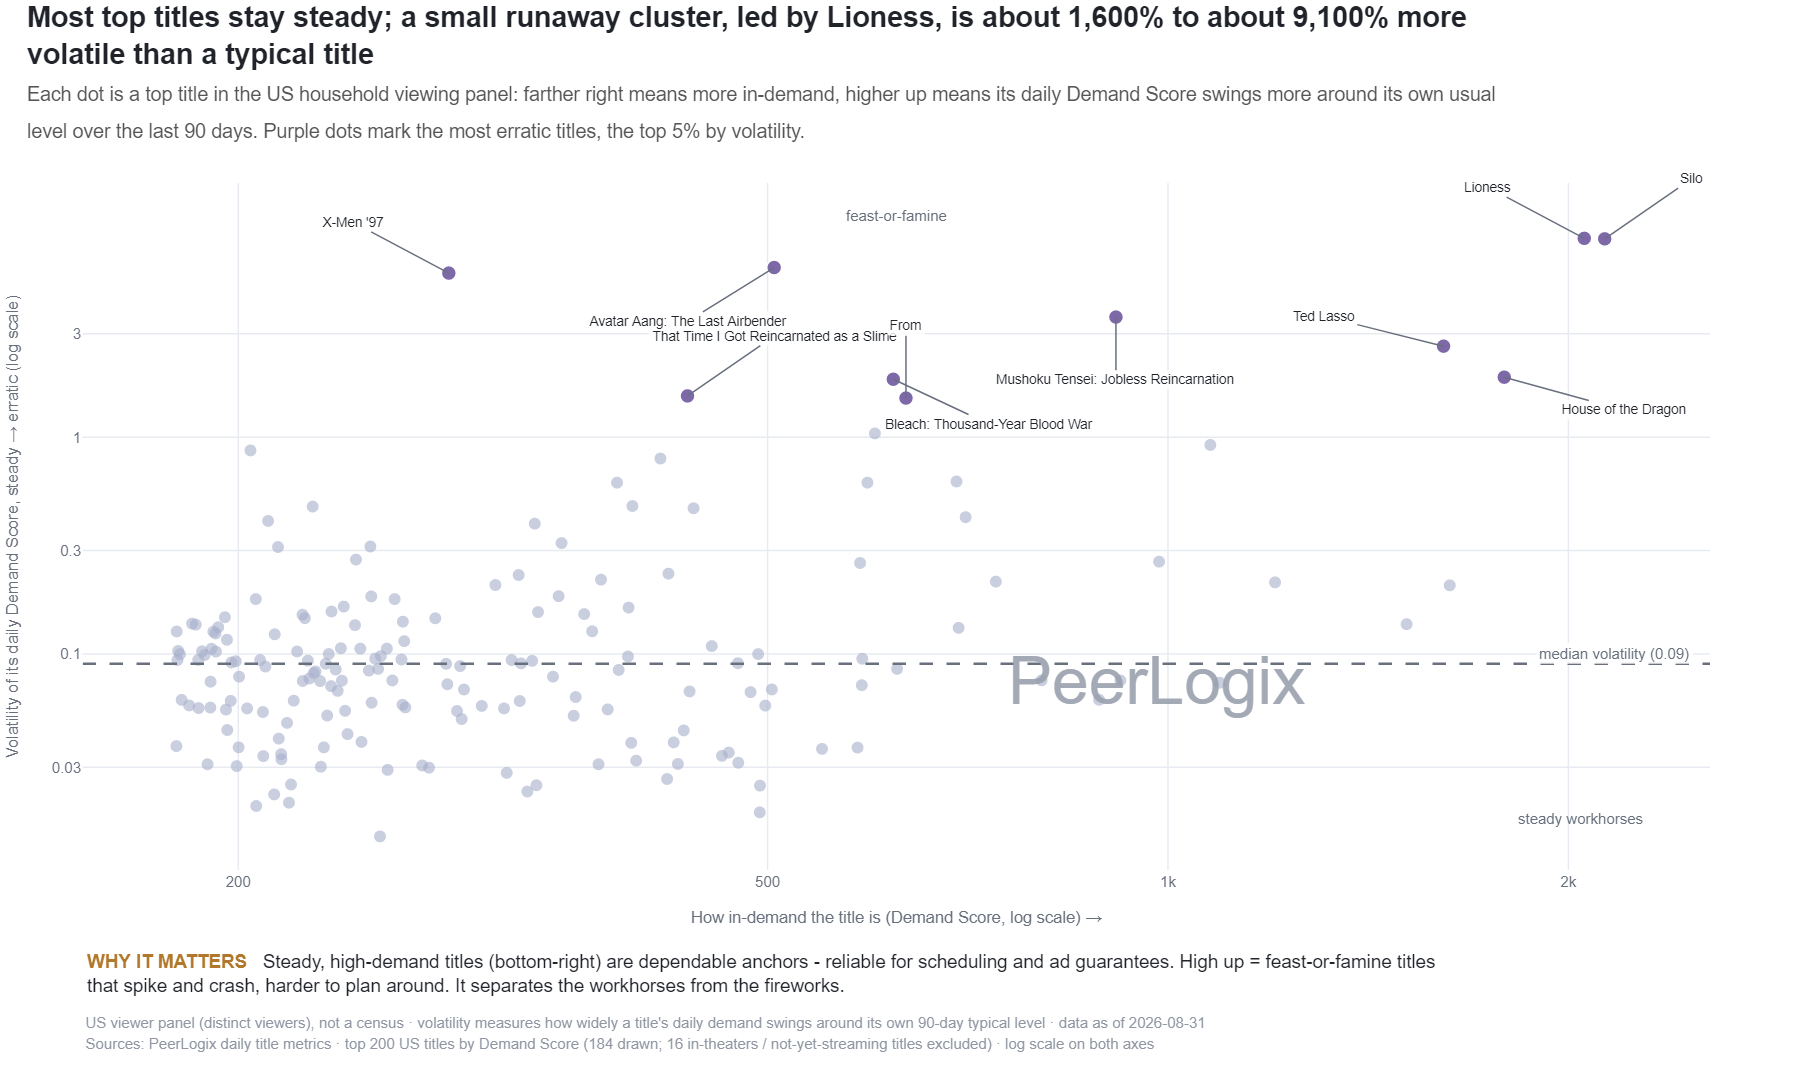
Demand & Momentum monthly
Title-demand level compared with 90-day volatility
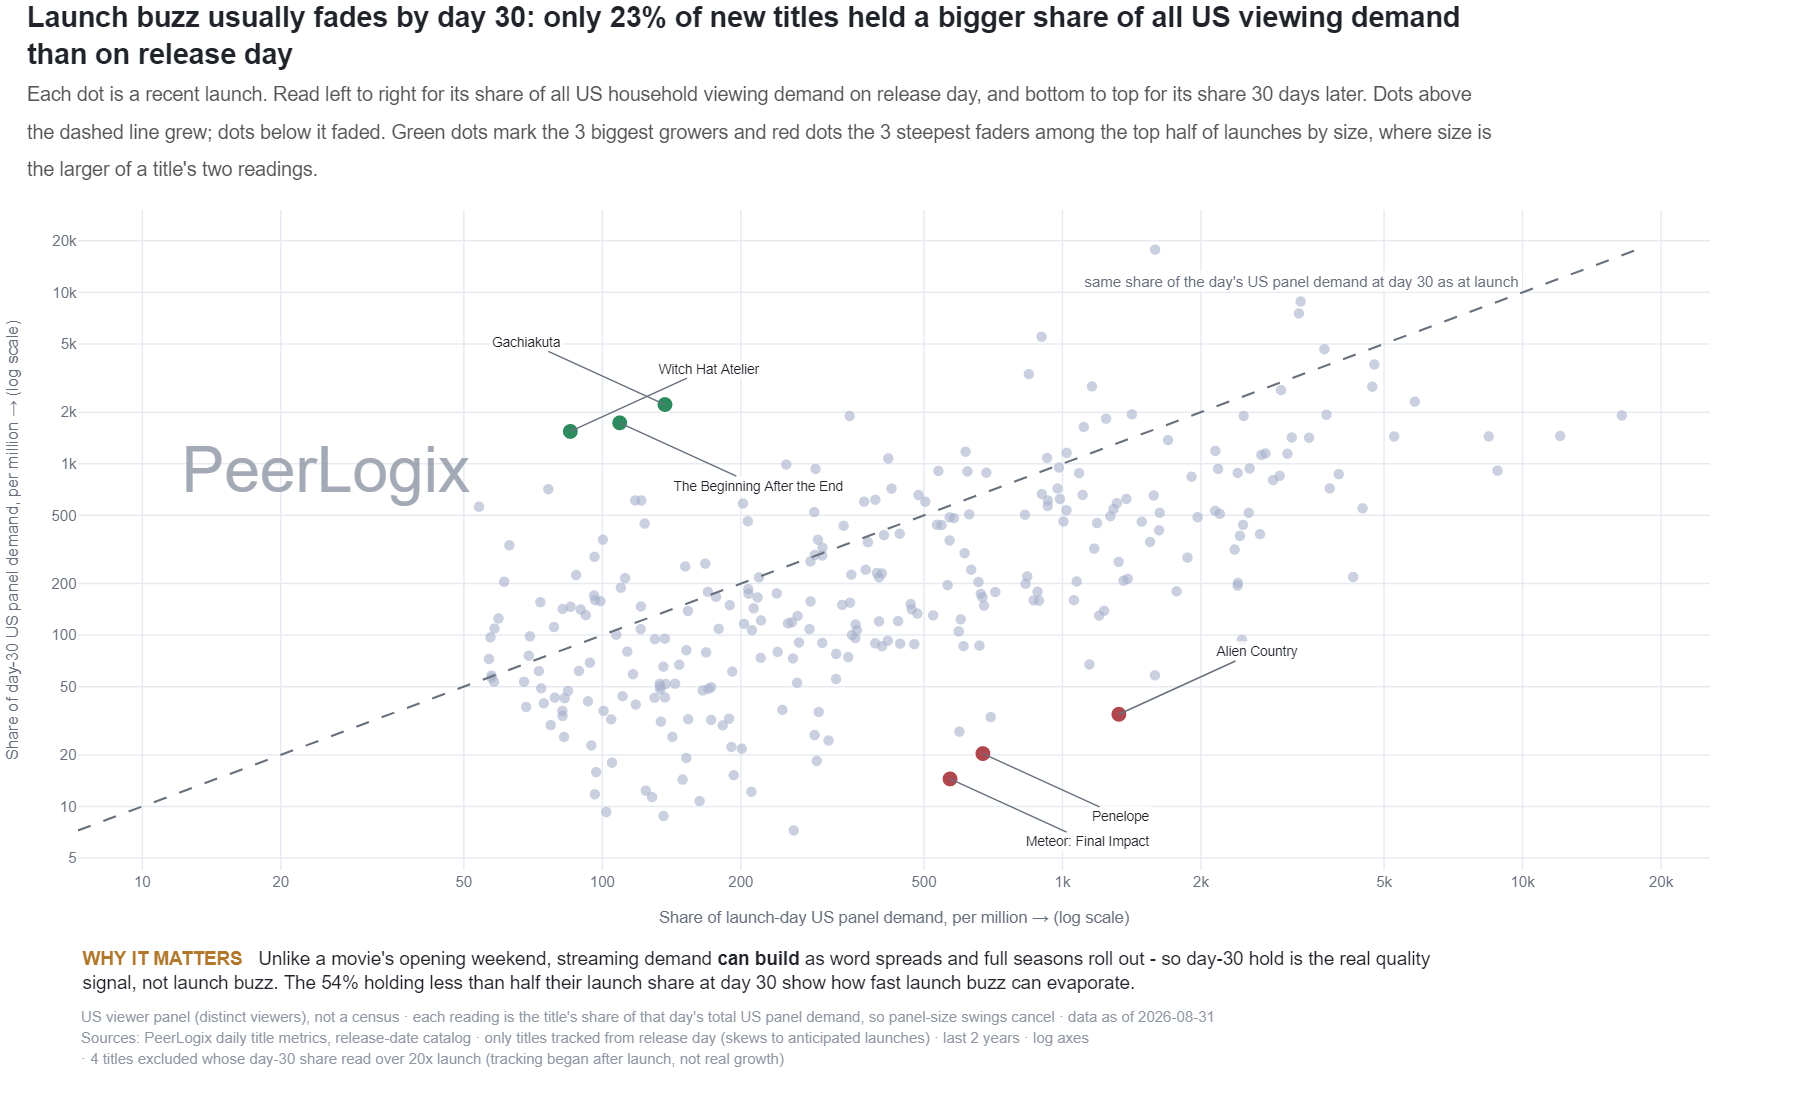
Platforms & Streaming Strategy monthly
Title-demand share at launch and 30 days later
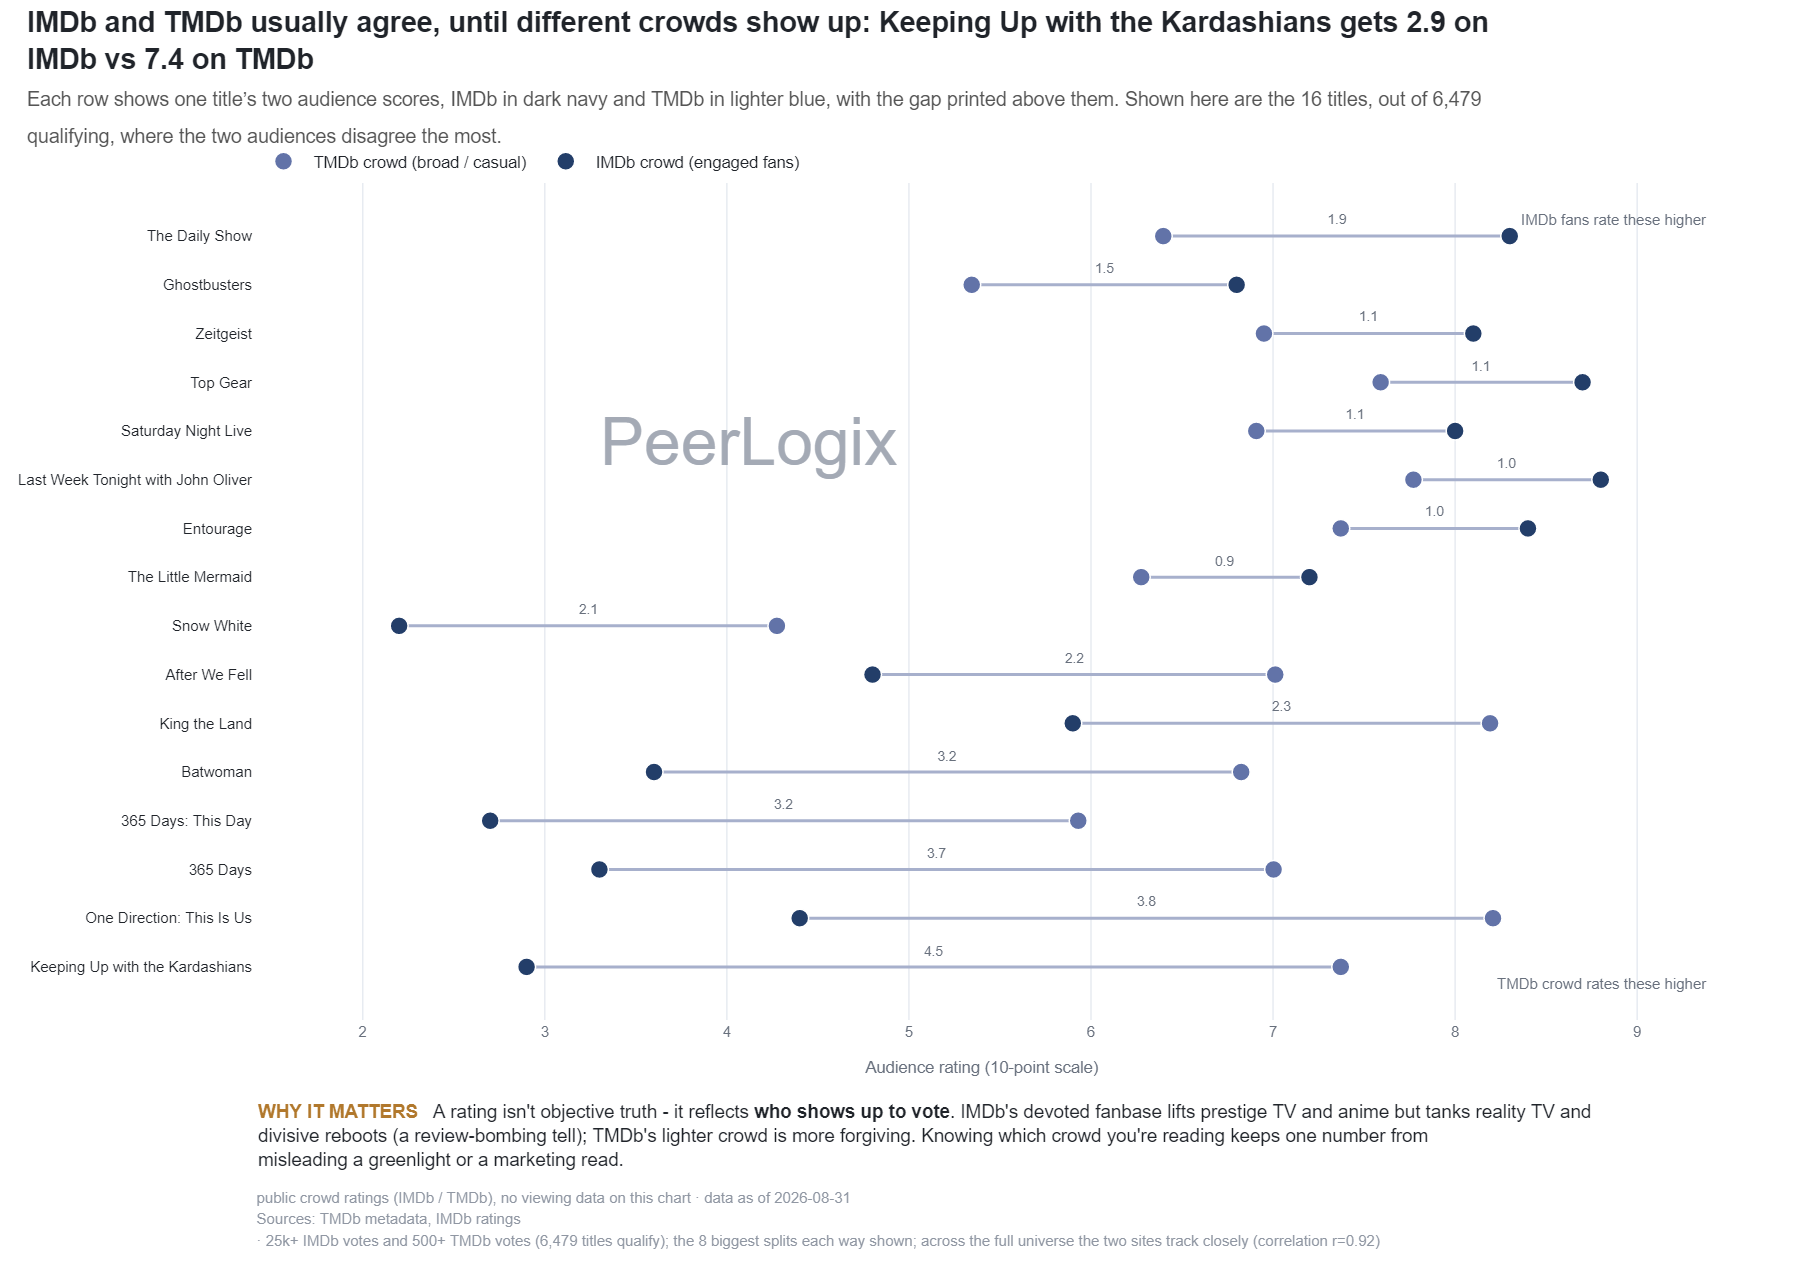
Quality & Reception monthly
Titles with the largest IMDb and TMDb rating gaps
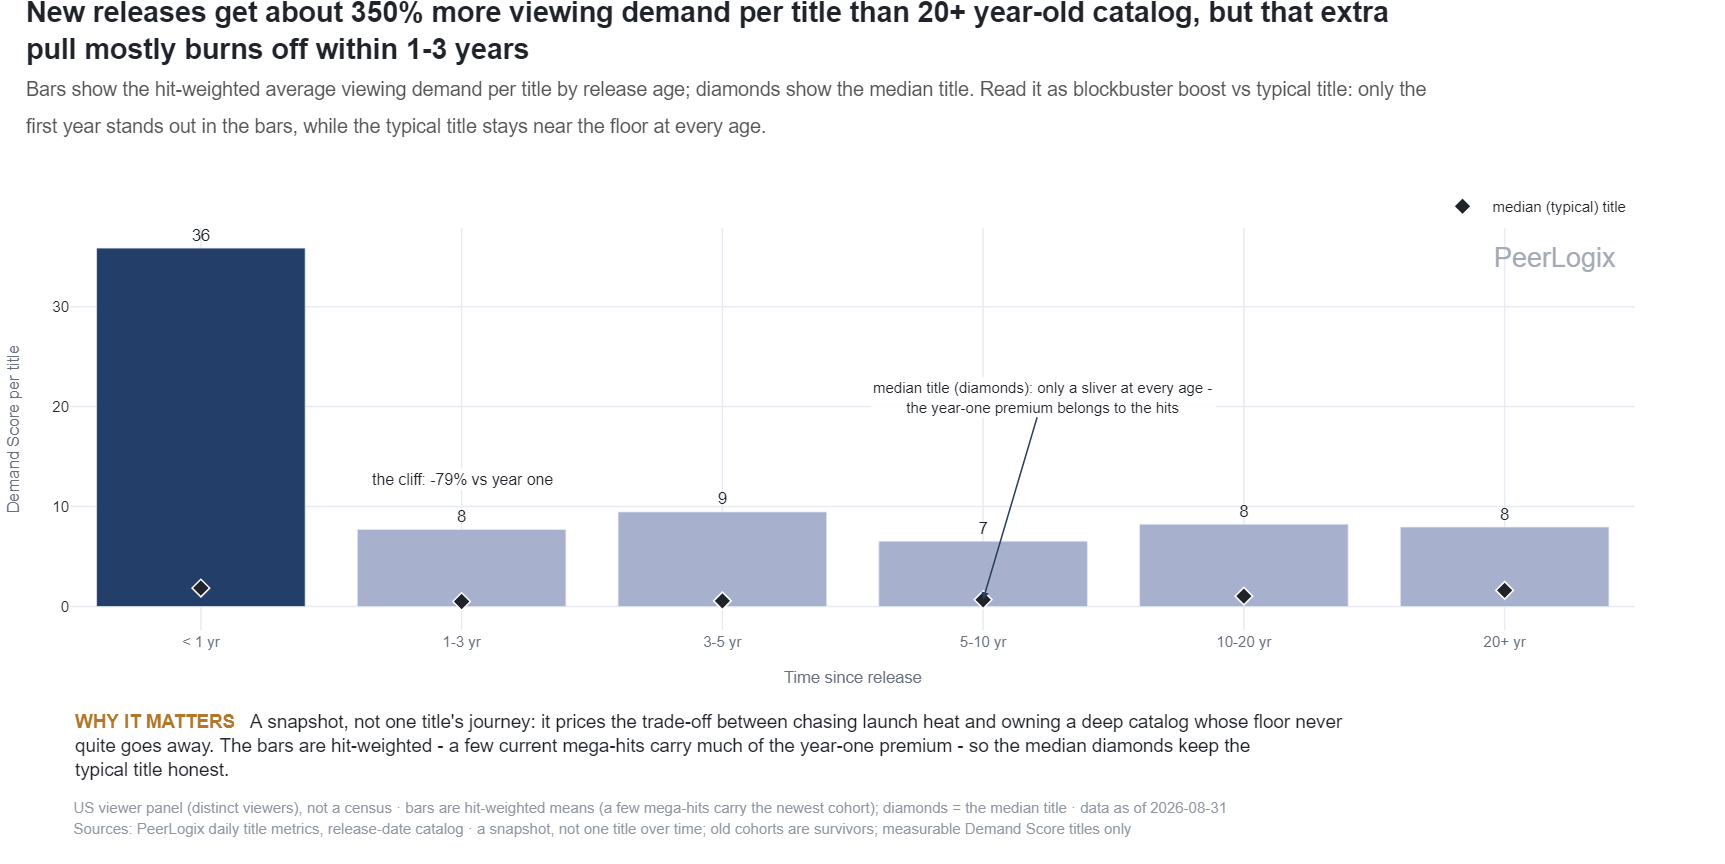
Evergreen & The Long Tail monthly
Viewing demand by years since a title’s release
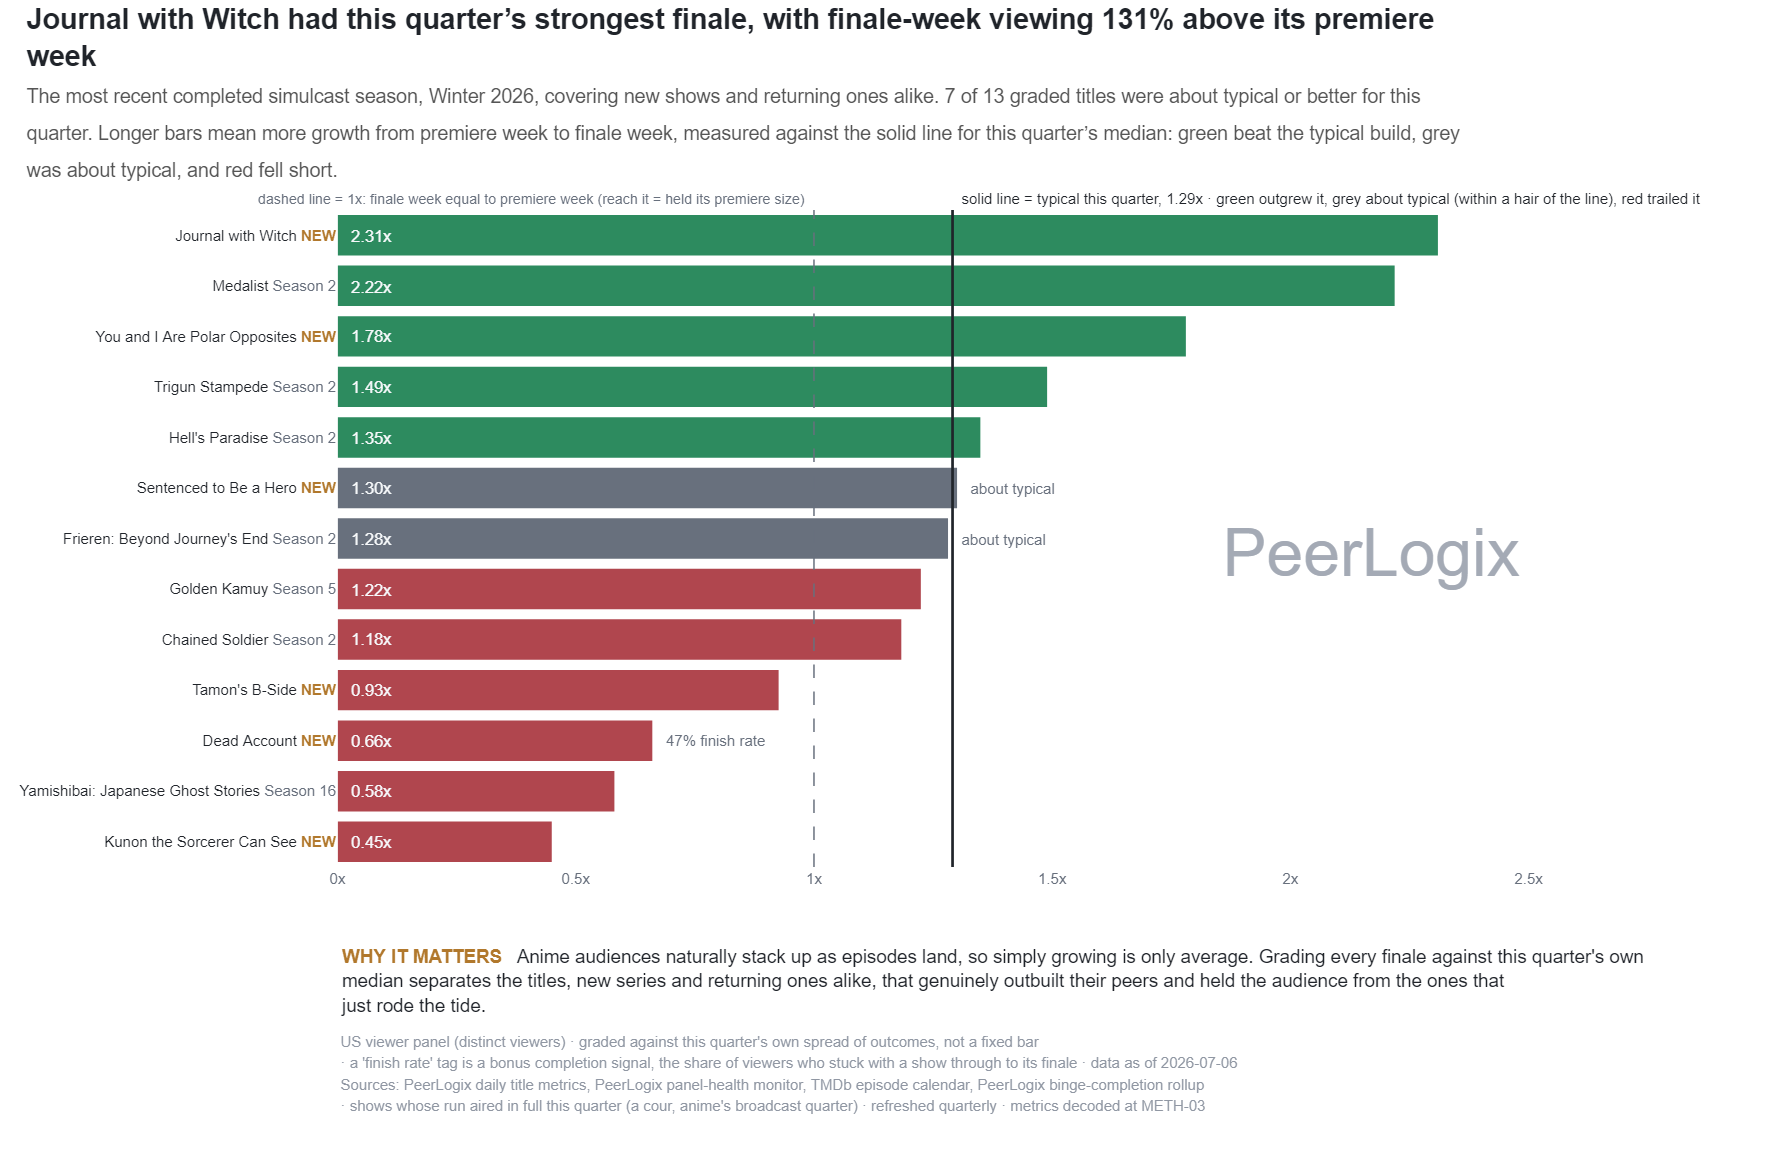
Anime Pulse quarterly
Anime premiere-to-finale patterns for the spring 2026 season
Evergreen & The Long Tail quarterly
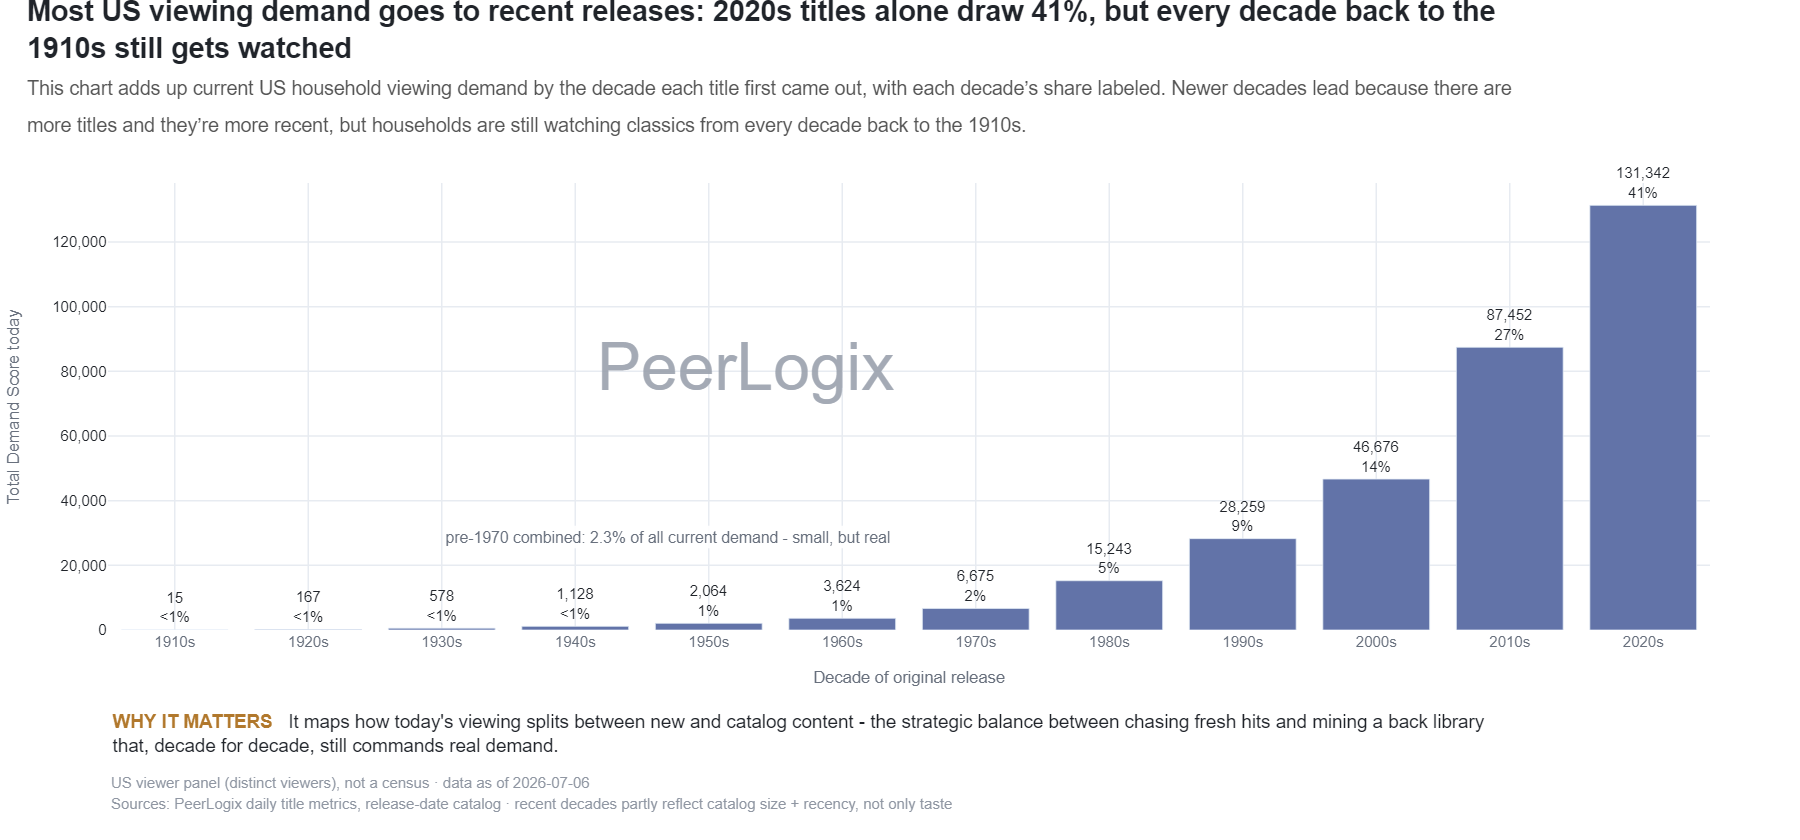
Current title demand by release-decade group
Evergreen & The Long Tail quarterly
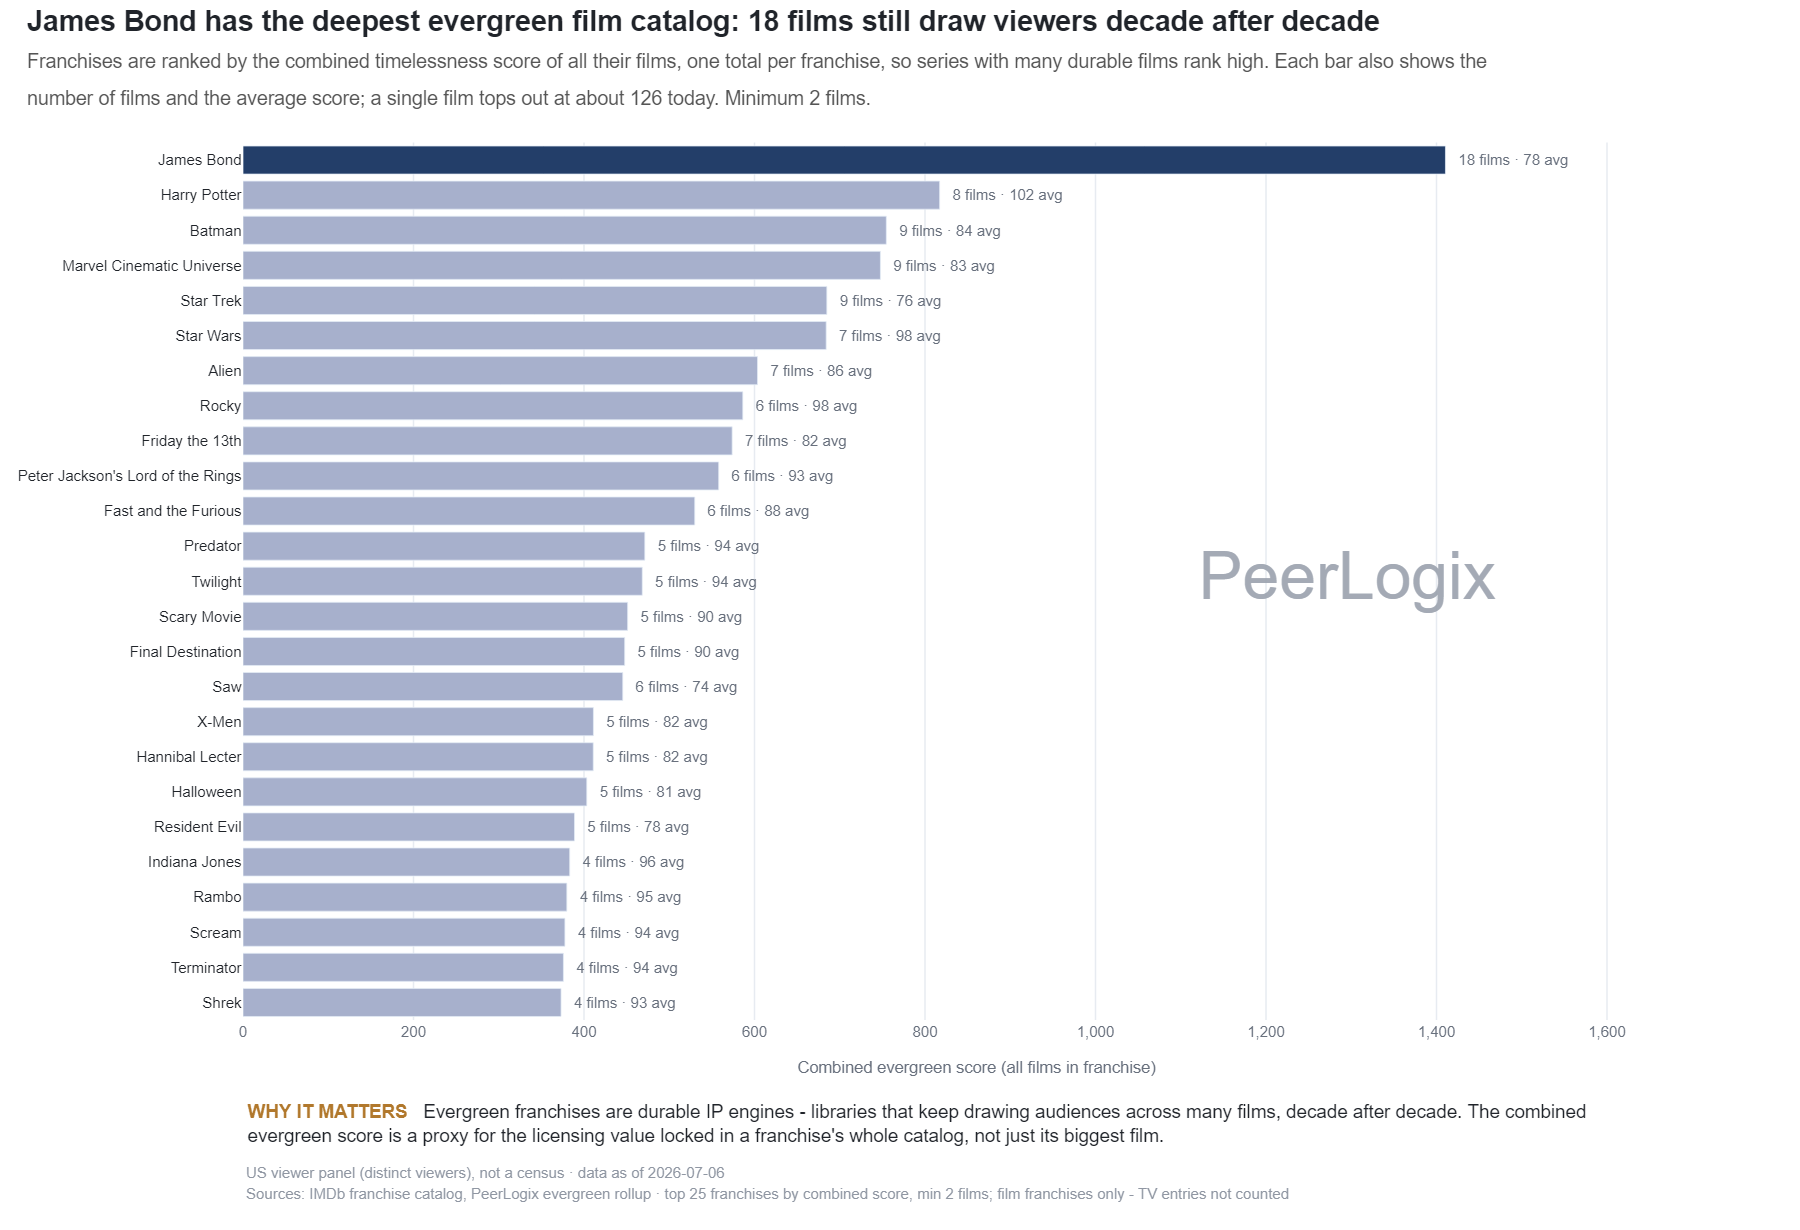
Franchise rankings by the combined timelessness score
Calendar & Seasonality quarterly
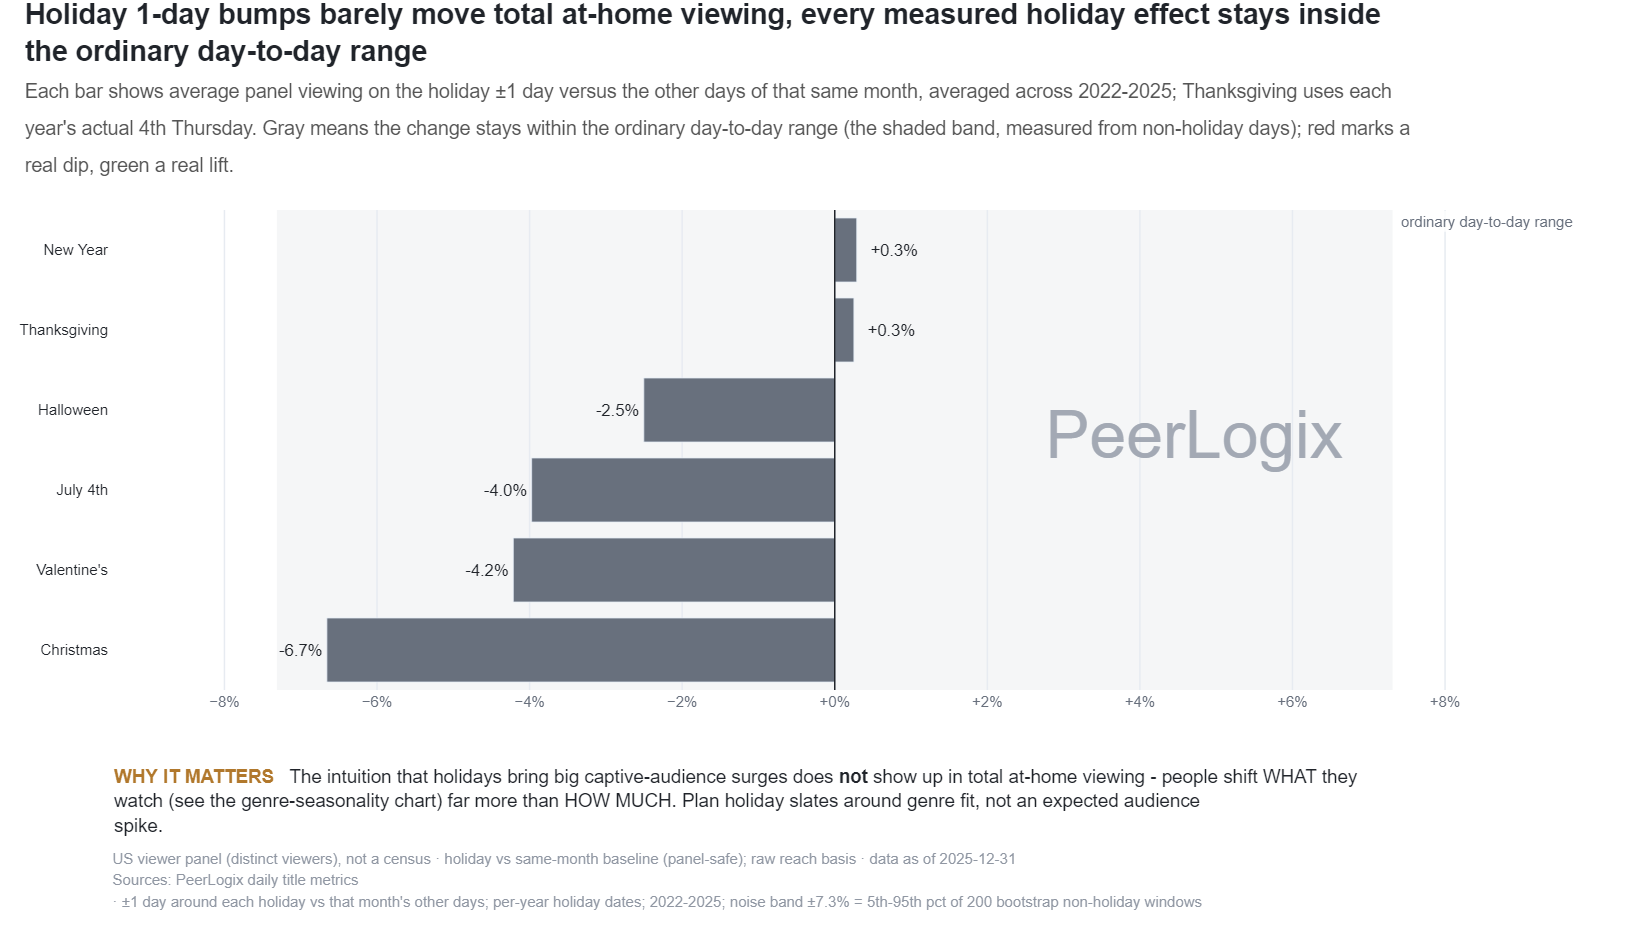
Holiday viewing changes in the PeerLogix U.S. panel
Genres & Taste quarterly
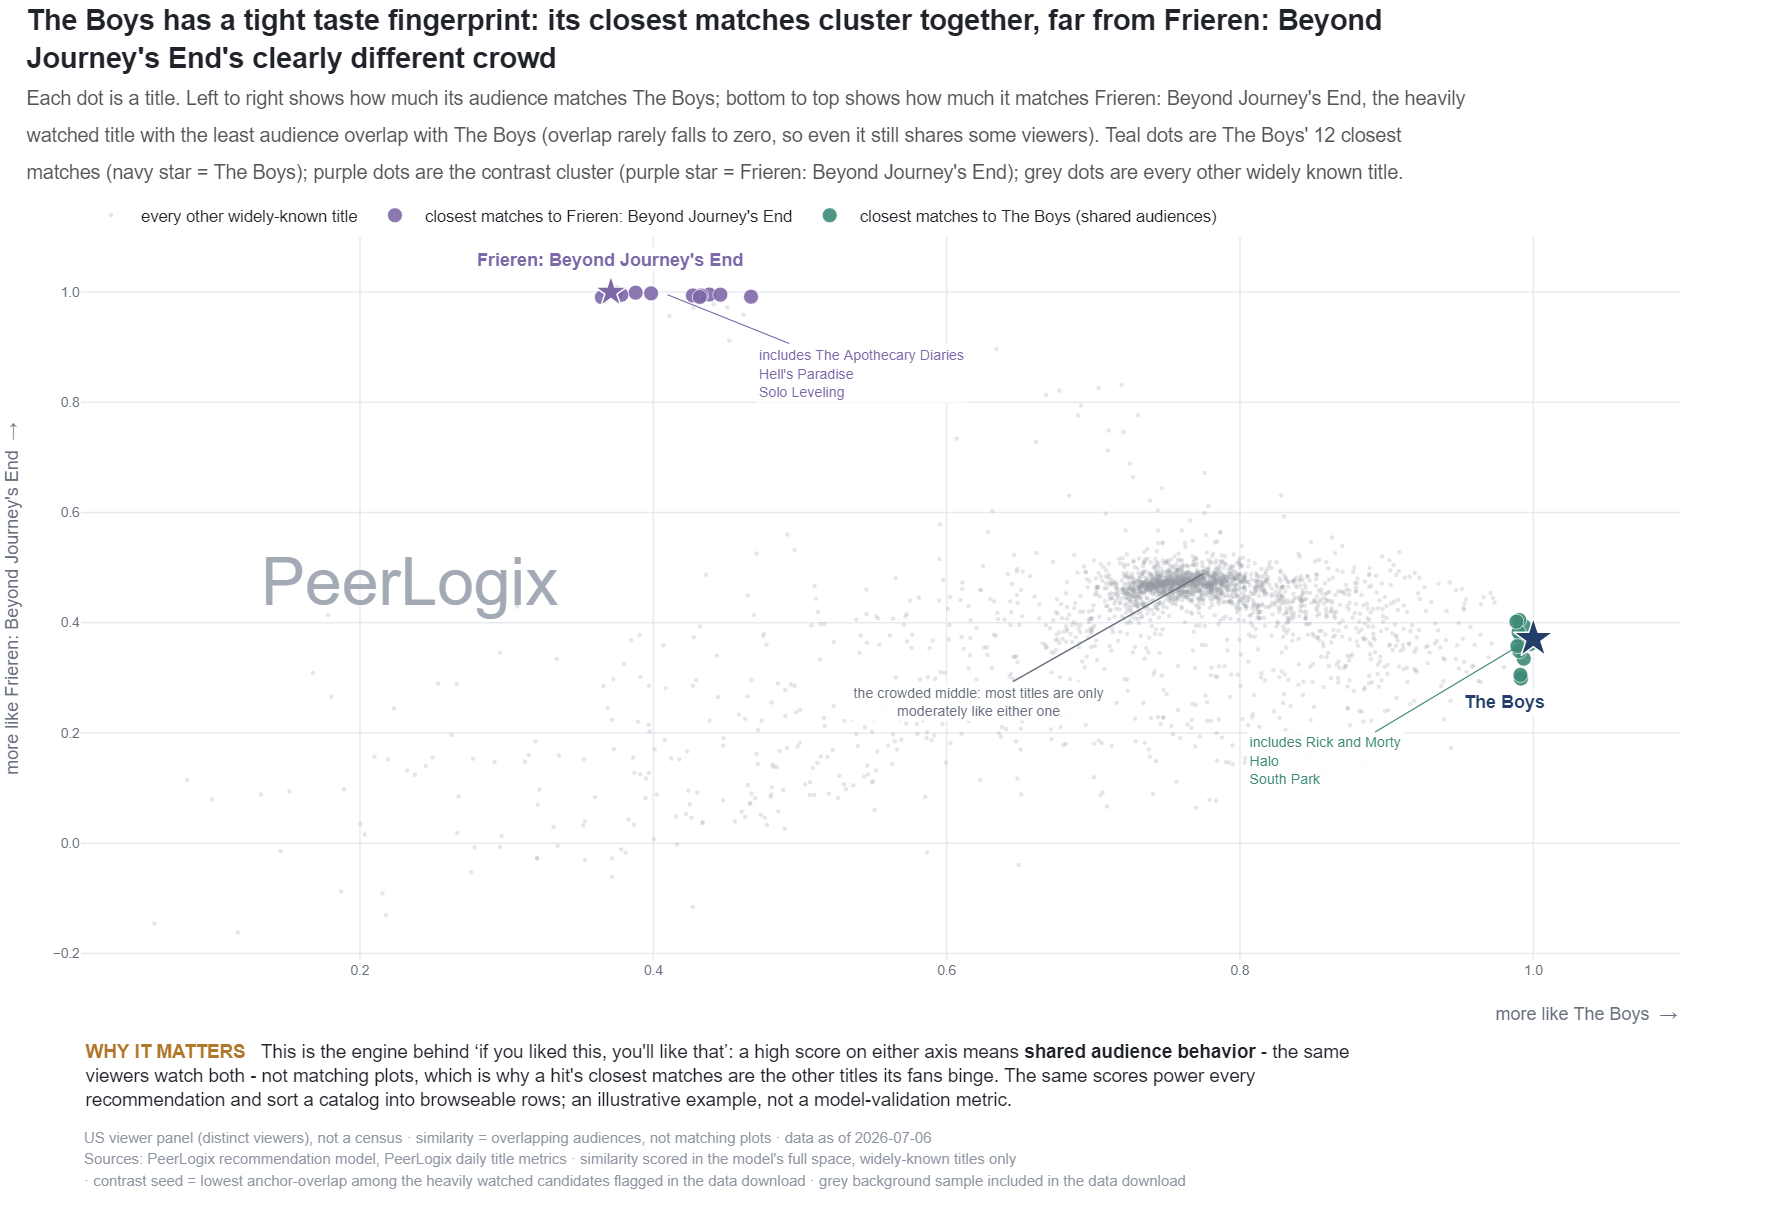
Learned title similarity: The Boys and related audiences
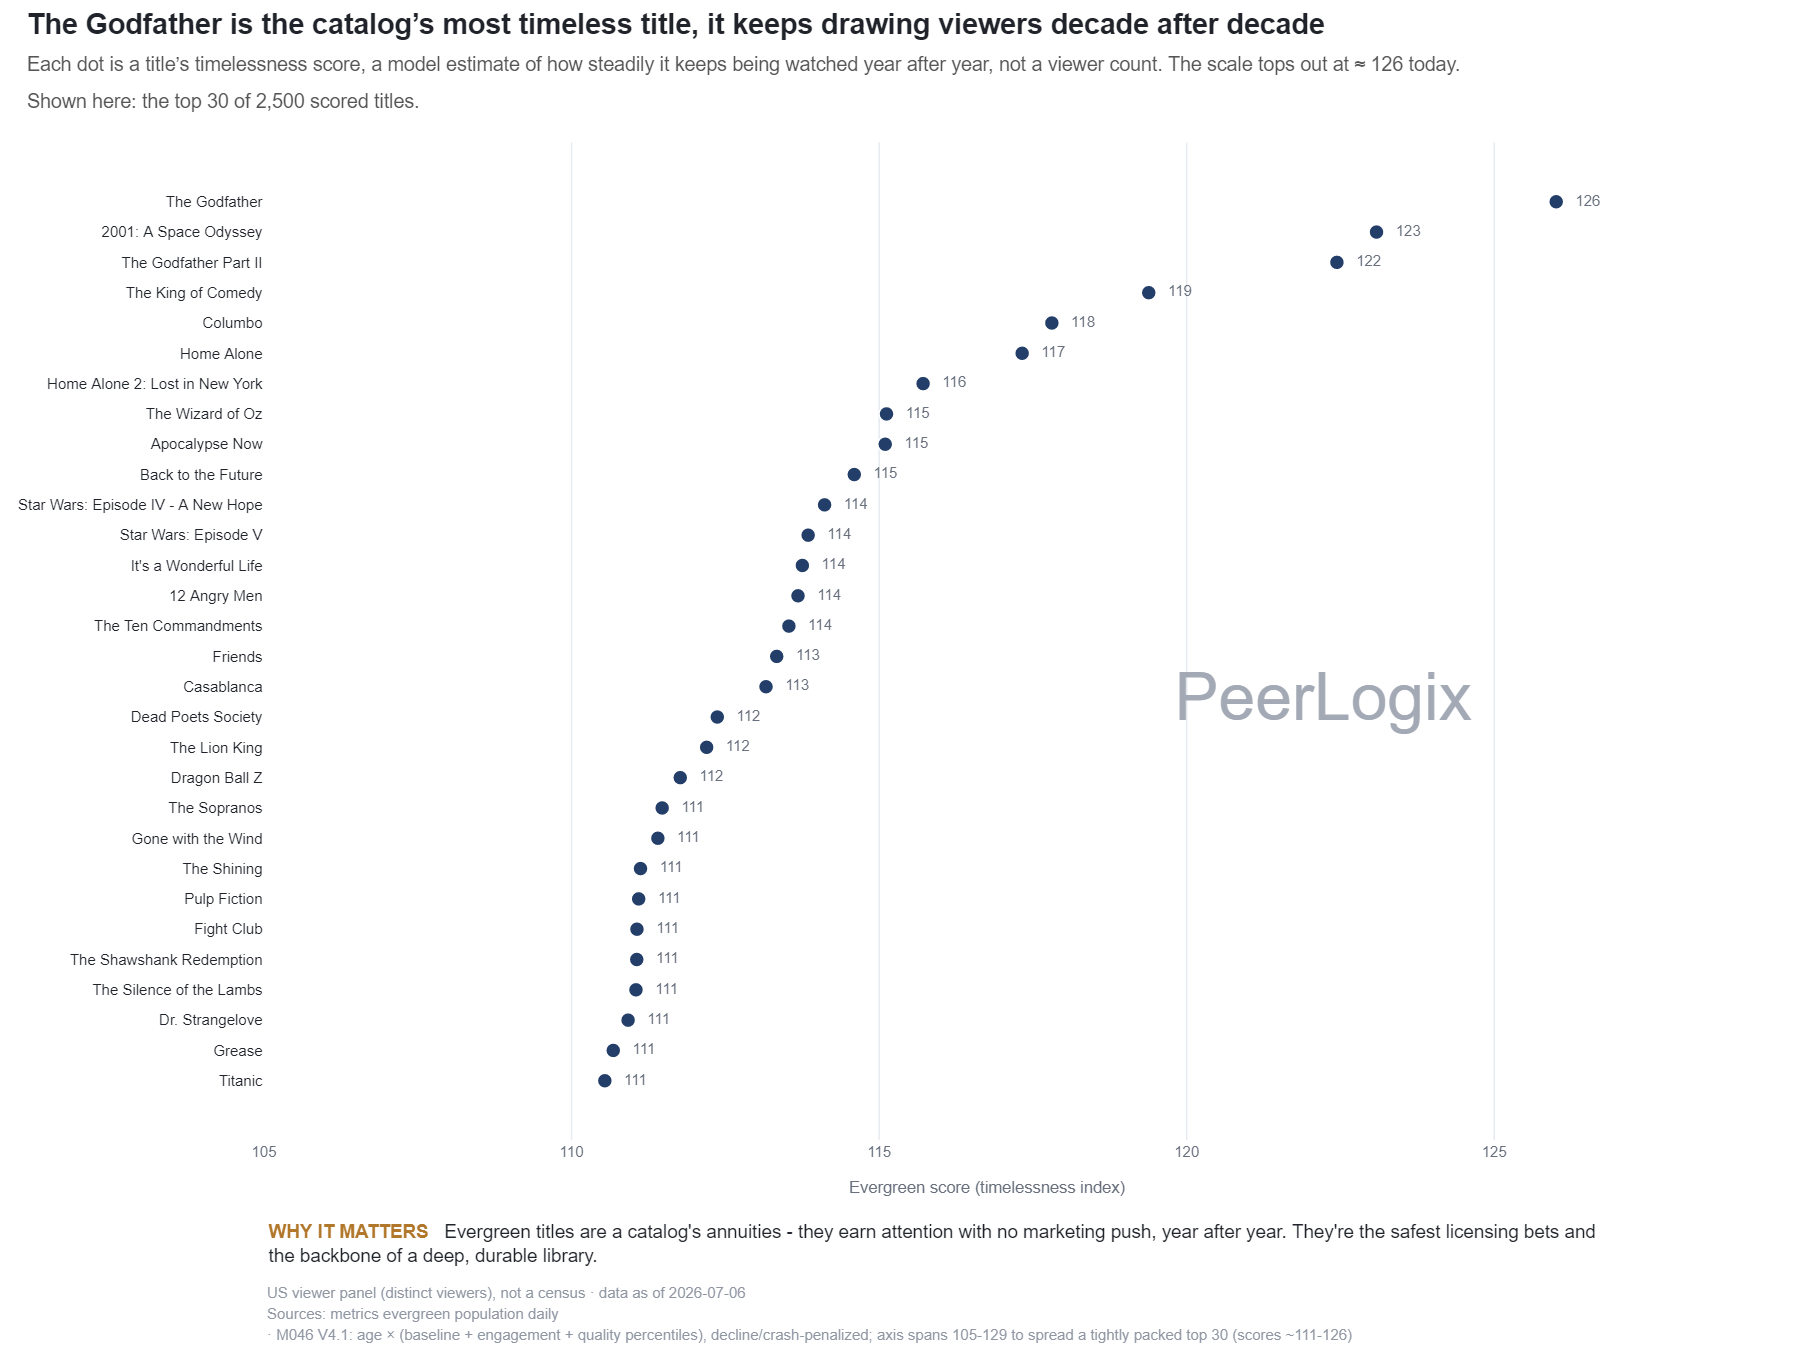
Evergreen & The Long Tail quarterly
Long-lived title demand: the timelessness model ranking
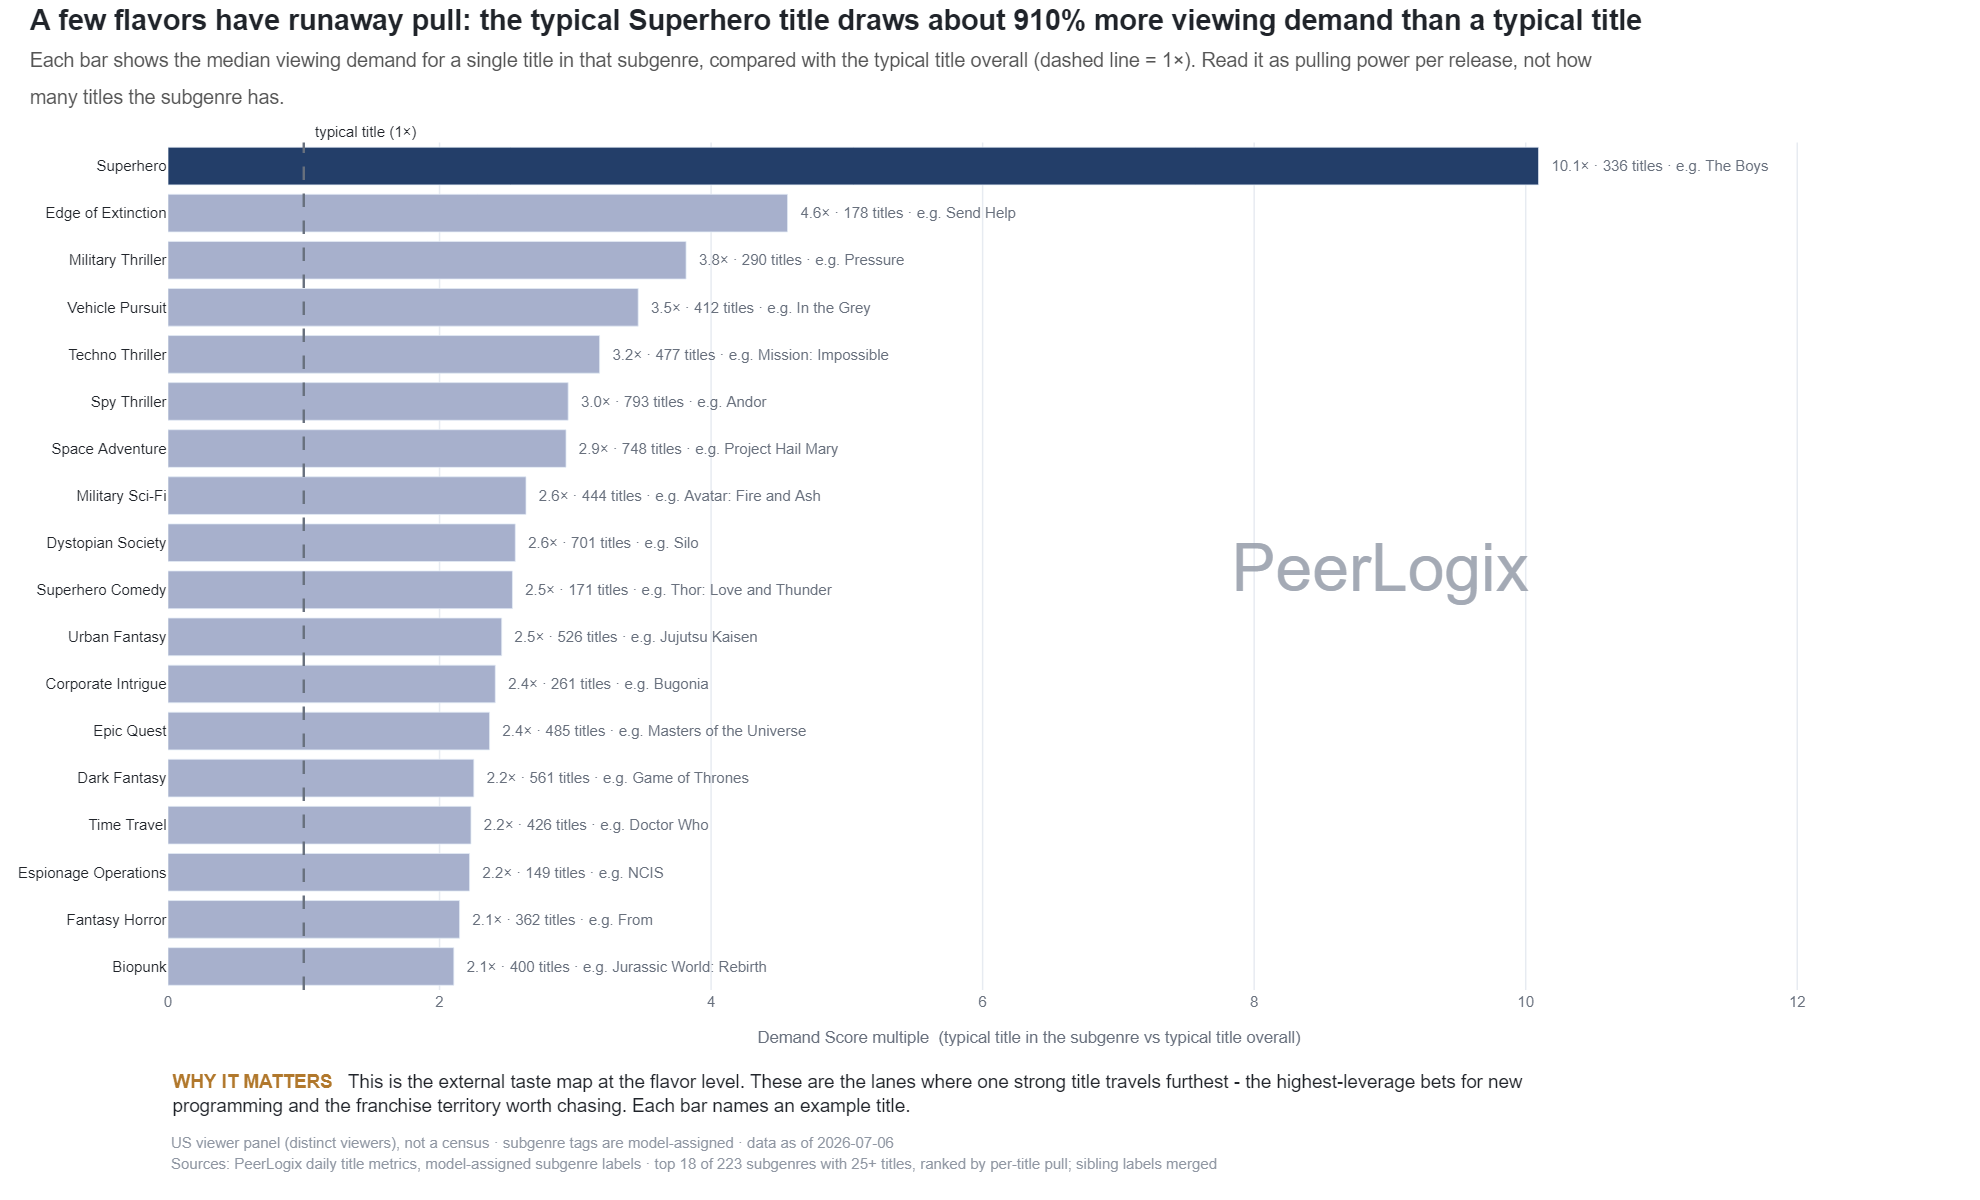
Methodology & Data Trust quarterly
Median demand by movie and TV subgenre
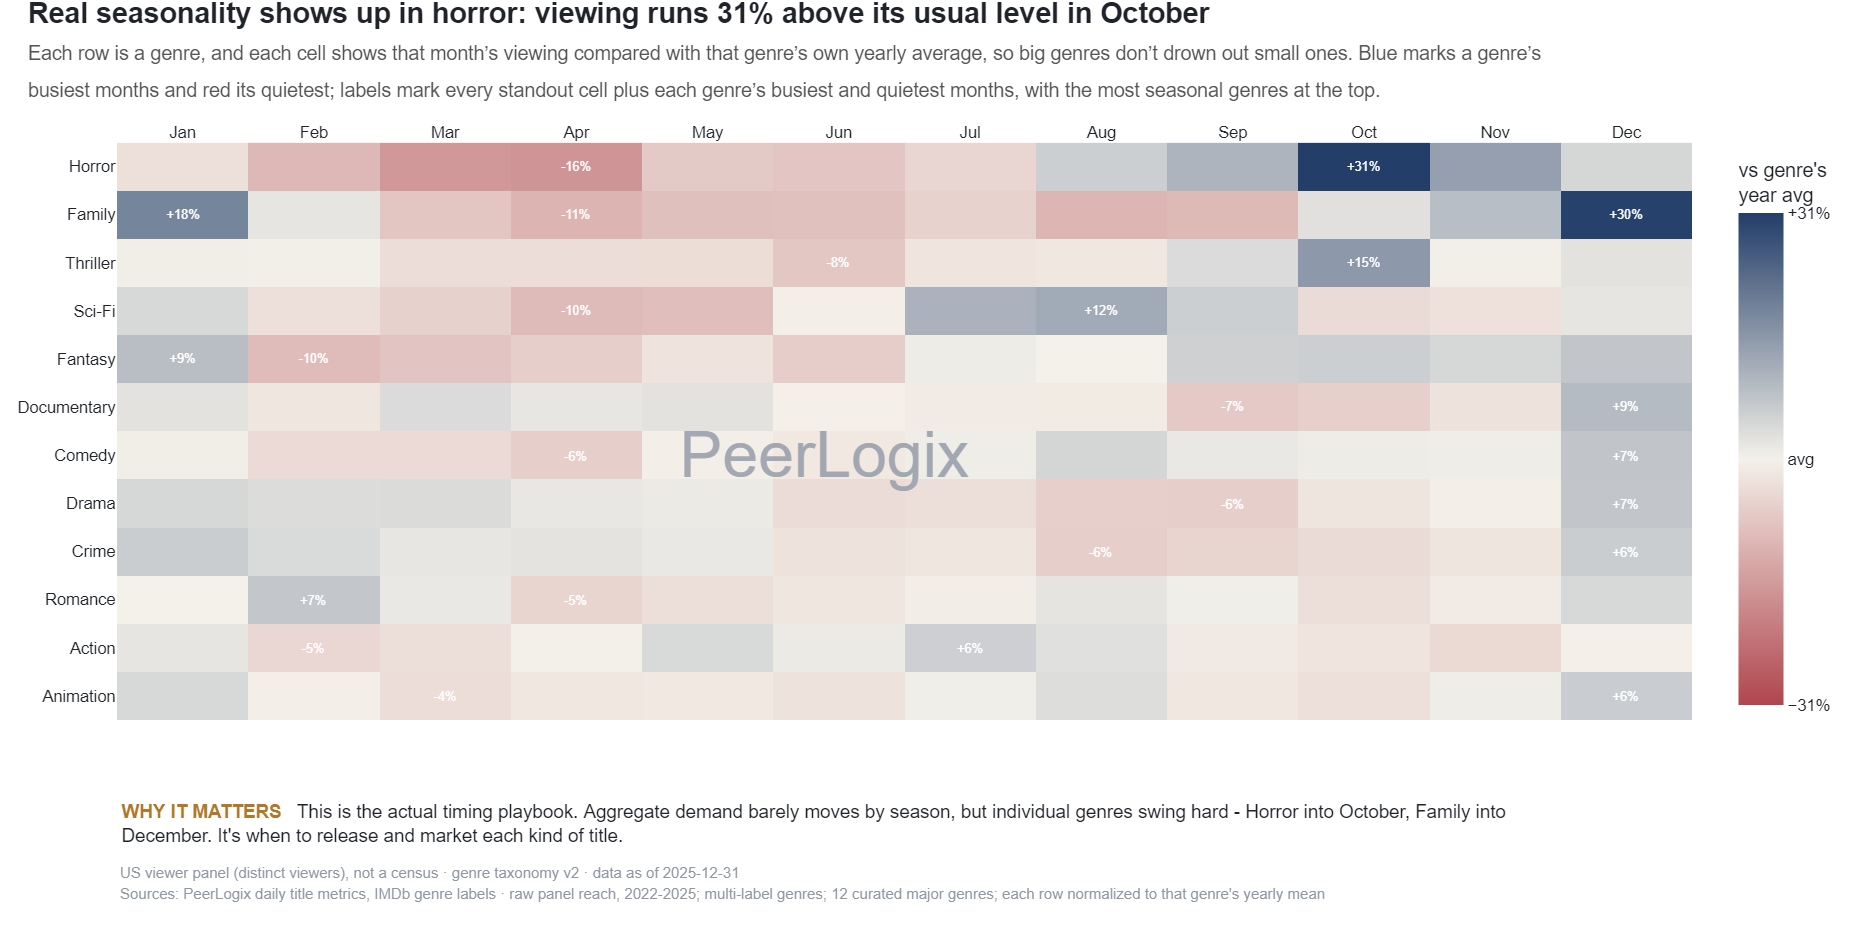
Calendar & Seasonality quarterly
Monthly genre viewing patterns in the observed panel
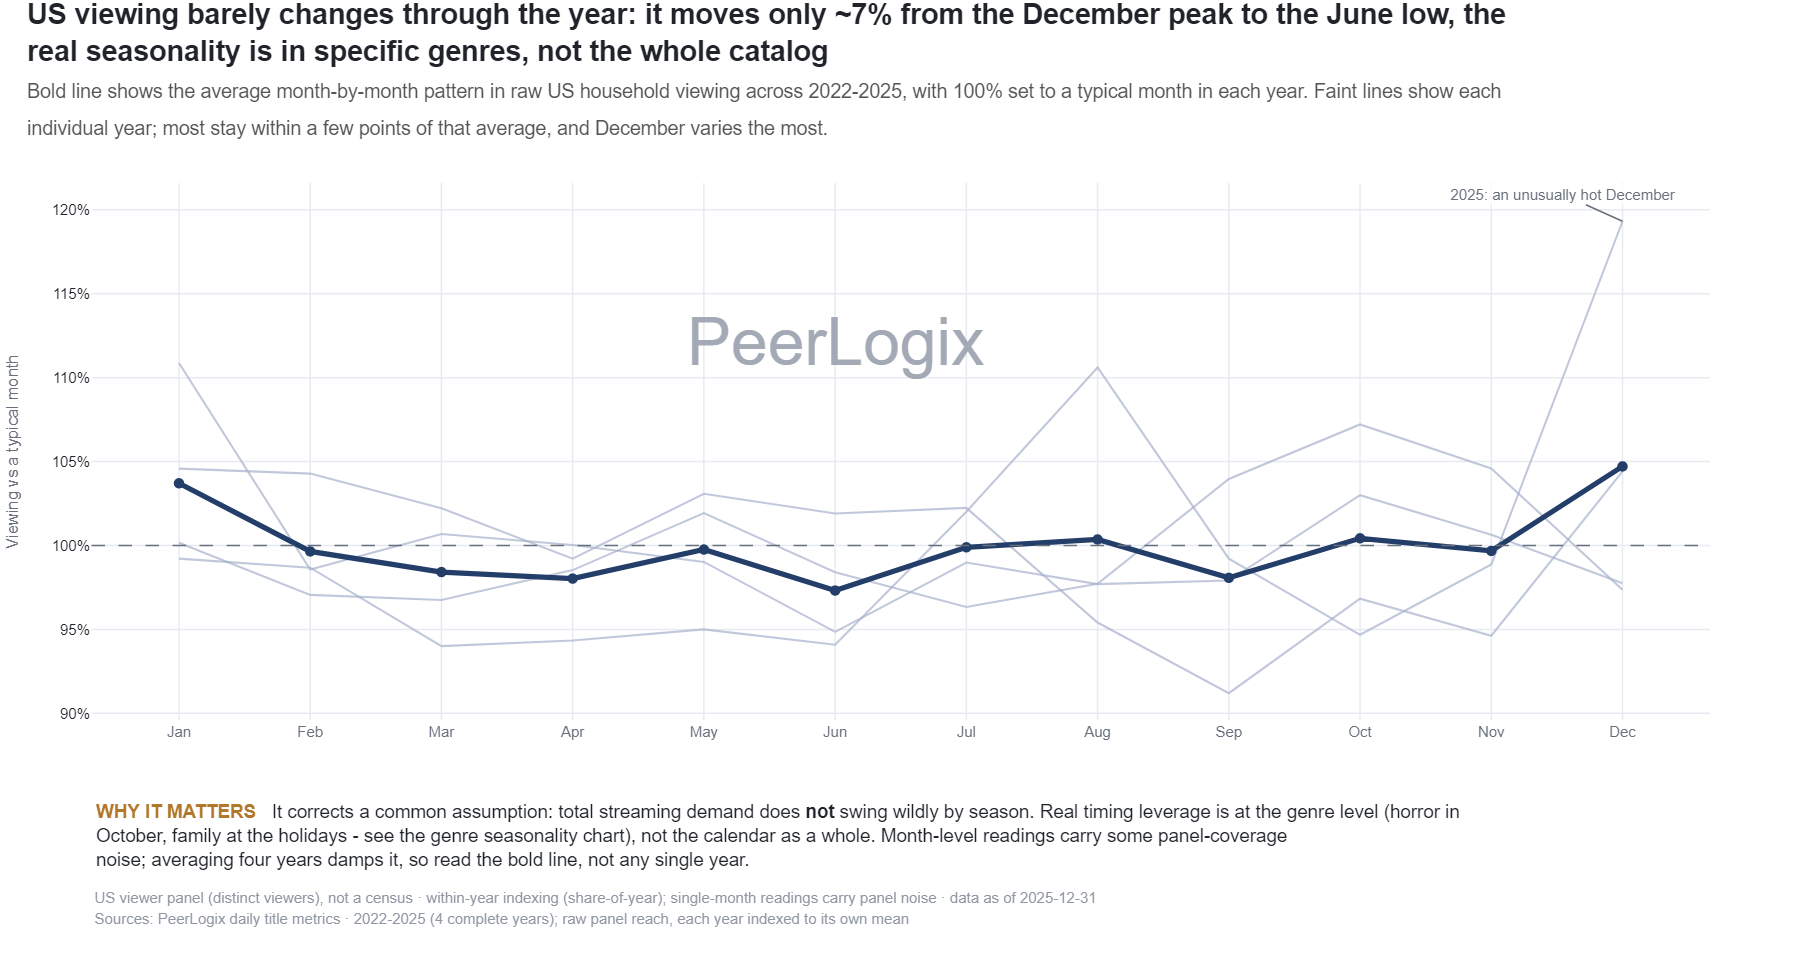
Calendar & Seasonality quarterly
Seasonal U.S. panel viewing patterns, 2022–2025
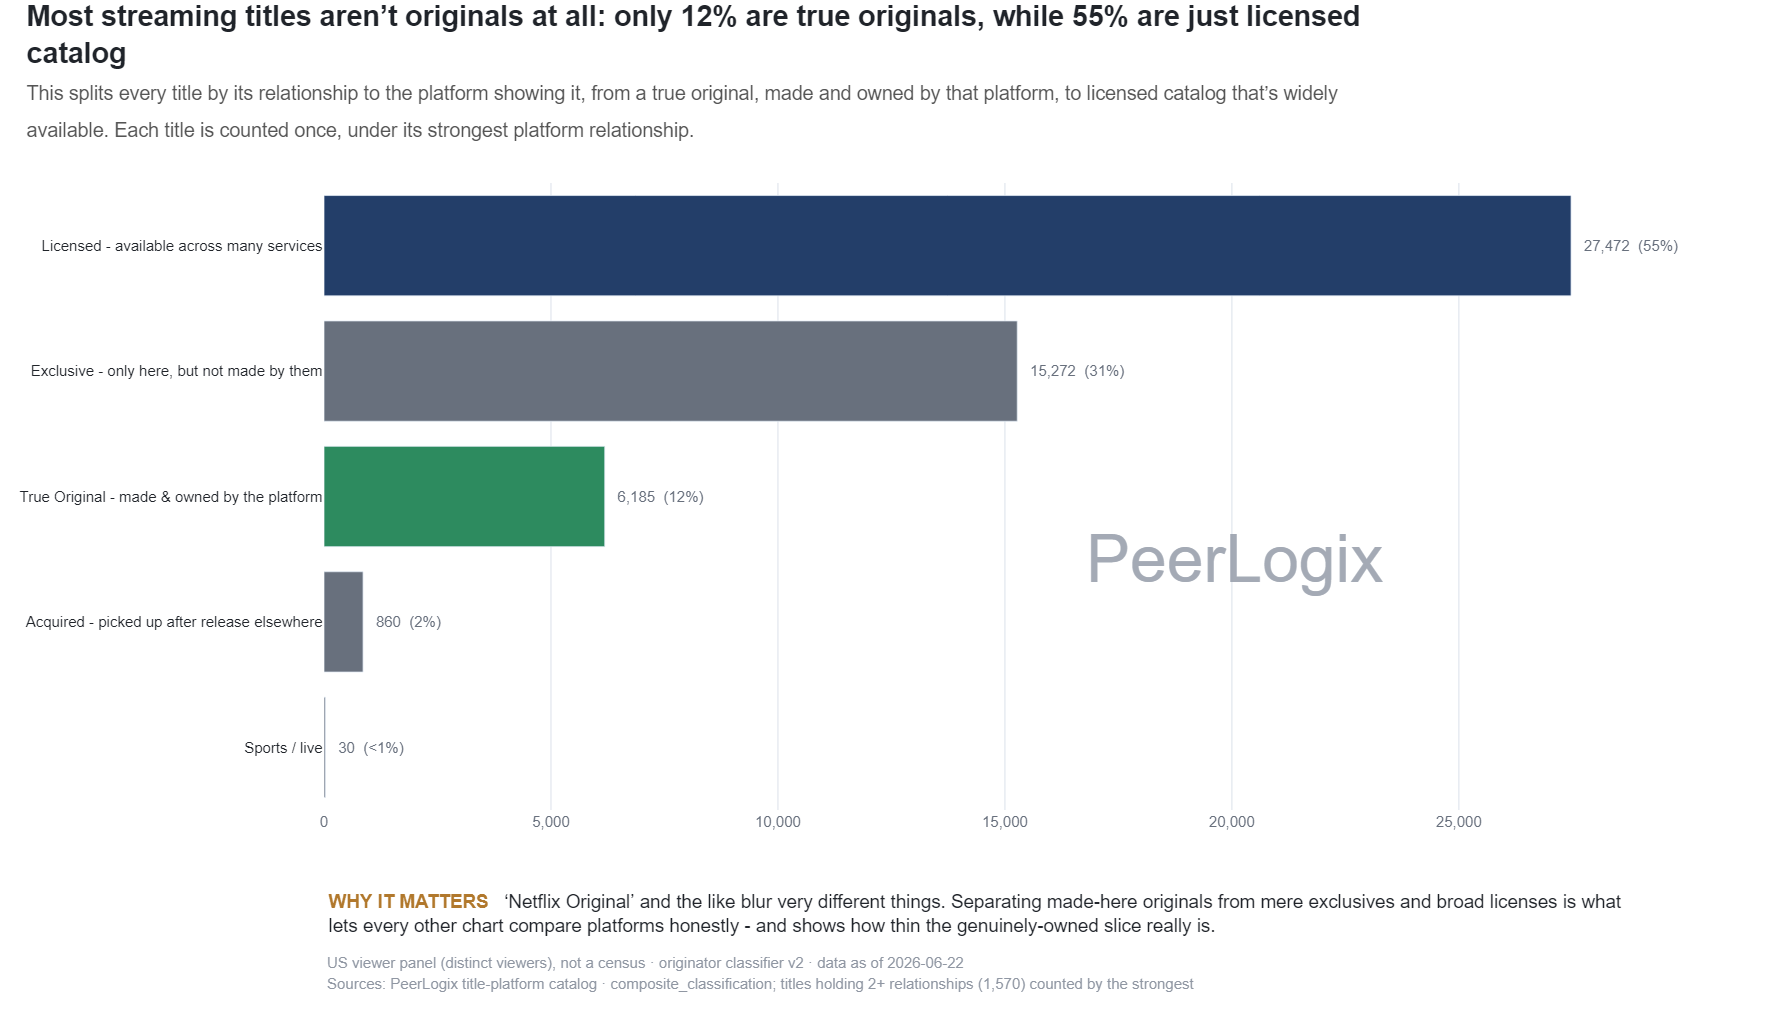
Methodology & Data Trust never
Streaming originals, licensed titles and catalog relationships
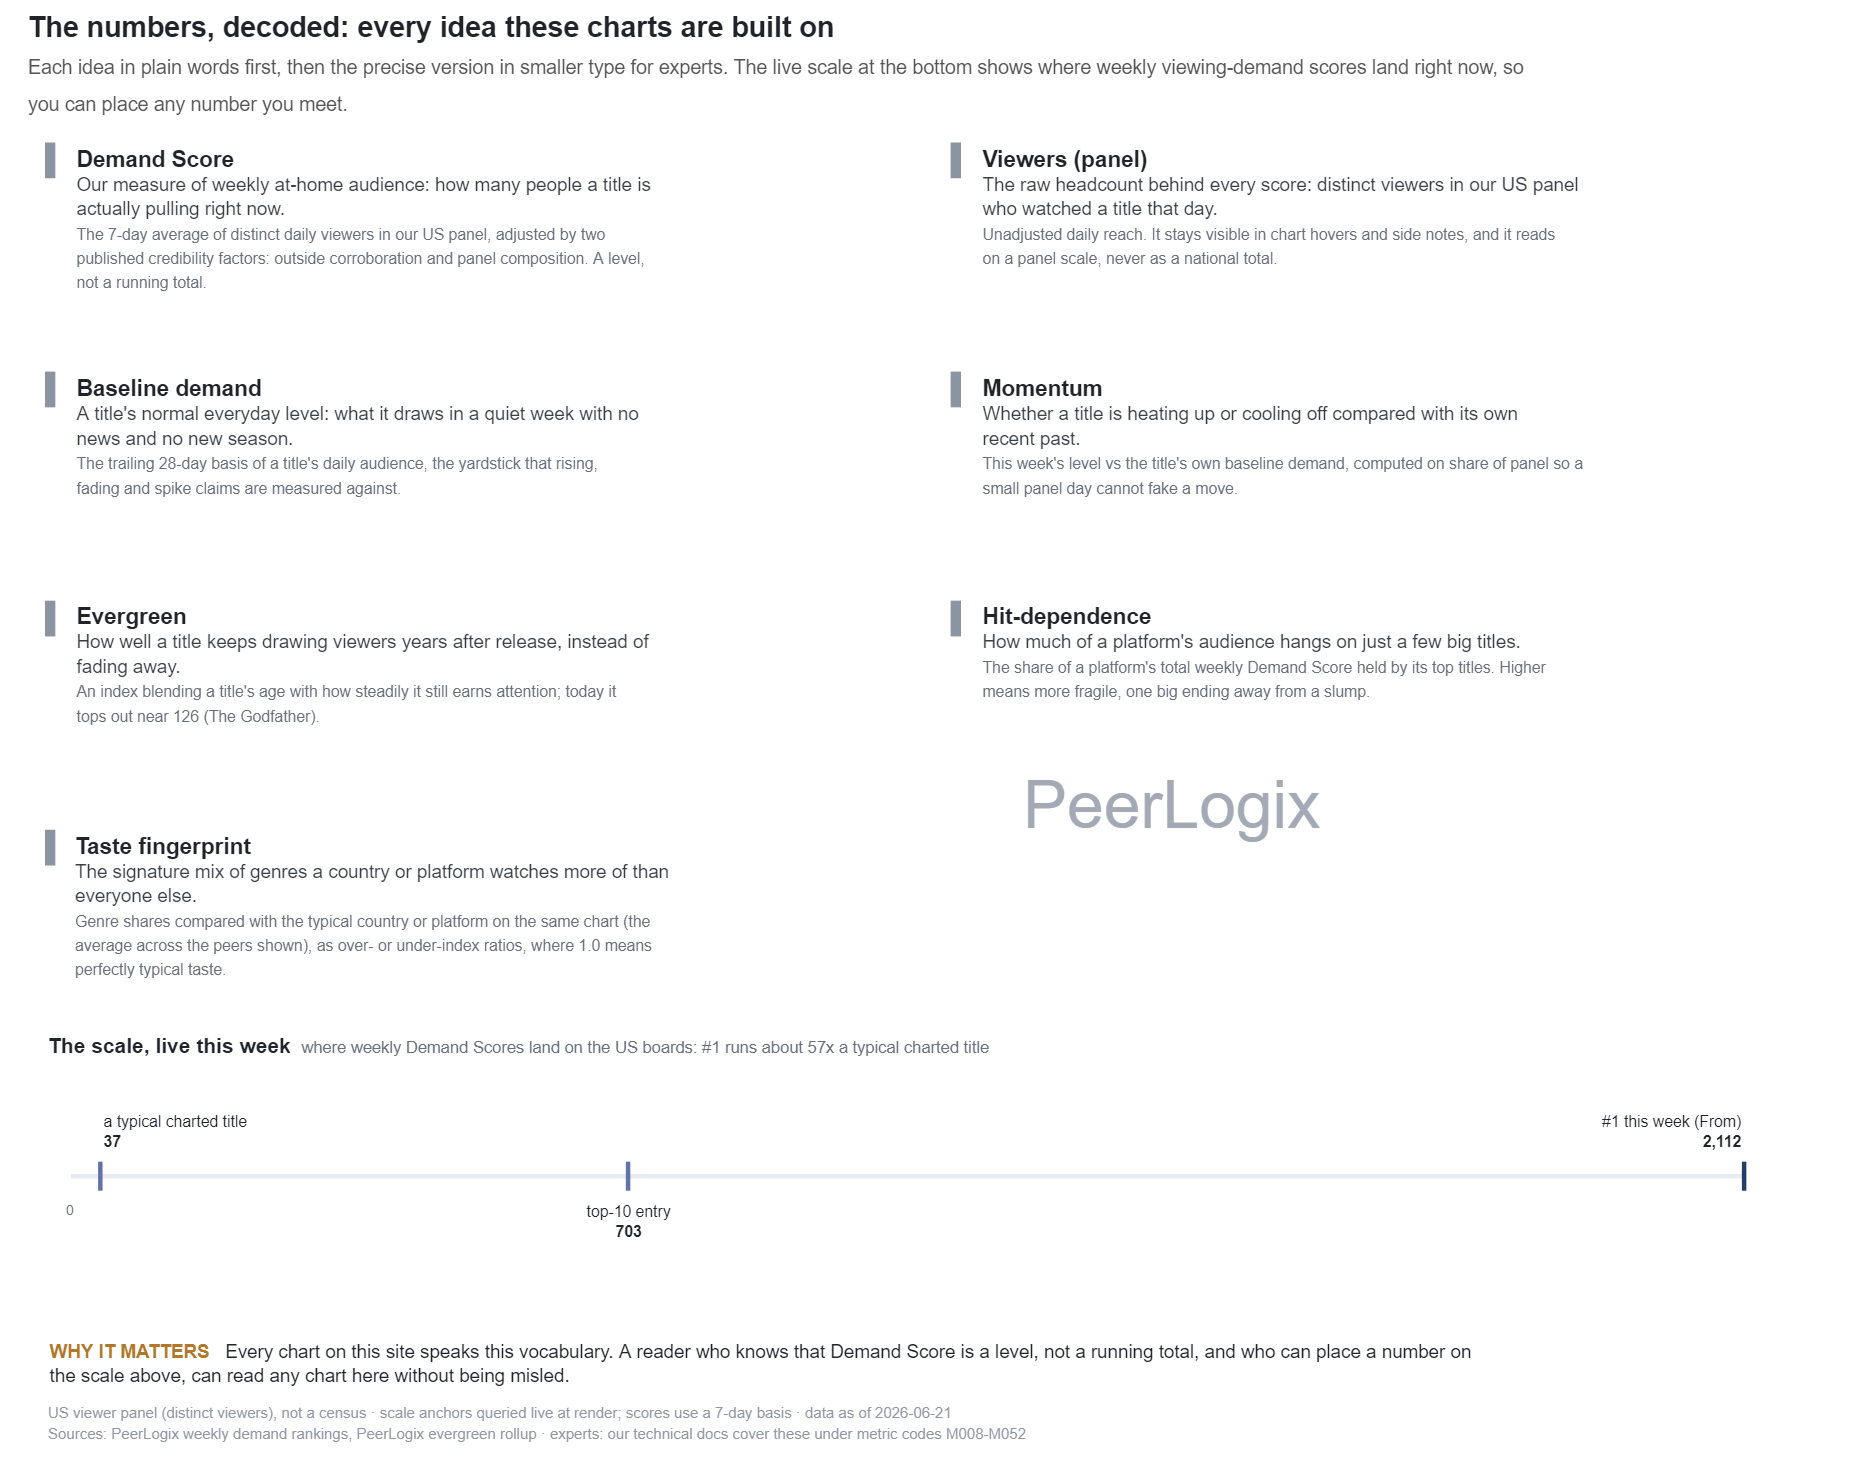
Methodology & Data Trust never
Streaming metric definitions: demand, momentum and baseline
No charts match. Try a different search or topic.
Library snapshot captured September 15, 2026. Individual chart dates are shown above.
Start a conversation
Bring us your next
streaming question.
We’ll show you what the data can add to your decision.