Data 2026-10-19 · weekly refresh
The Attention Standings
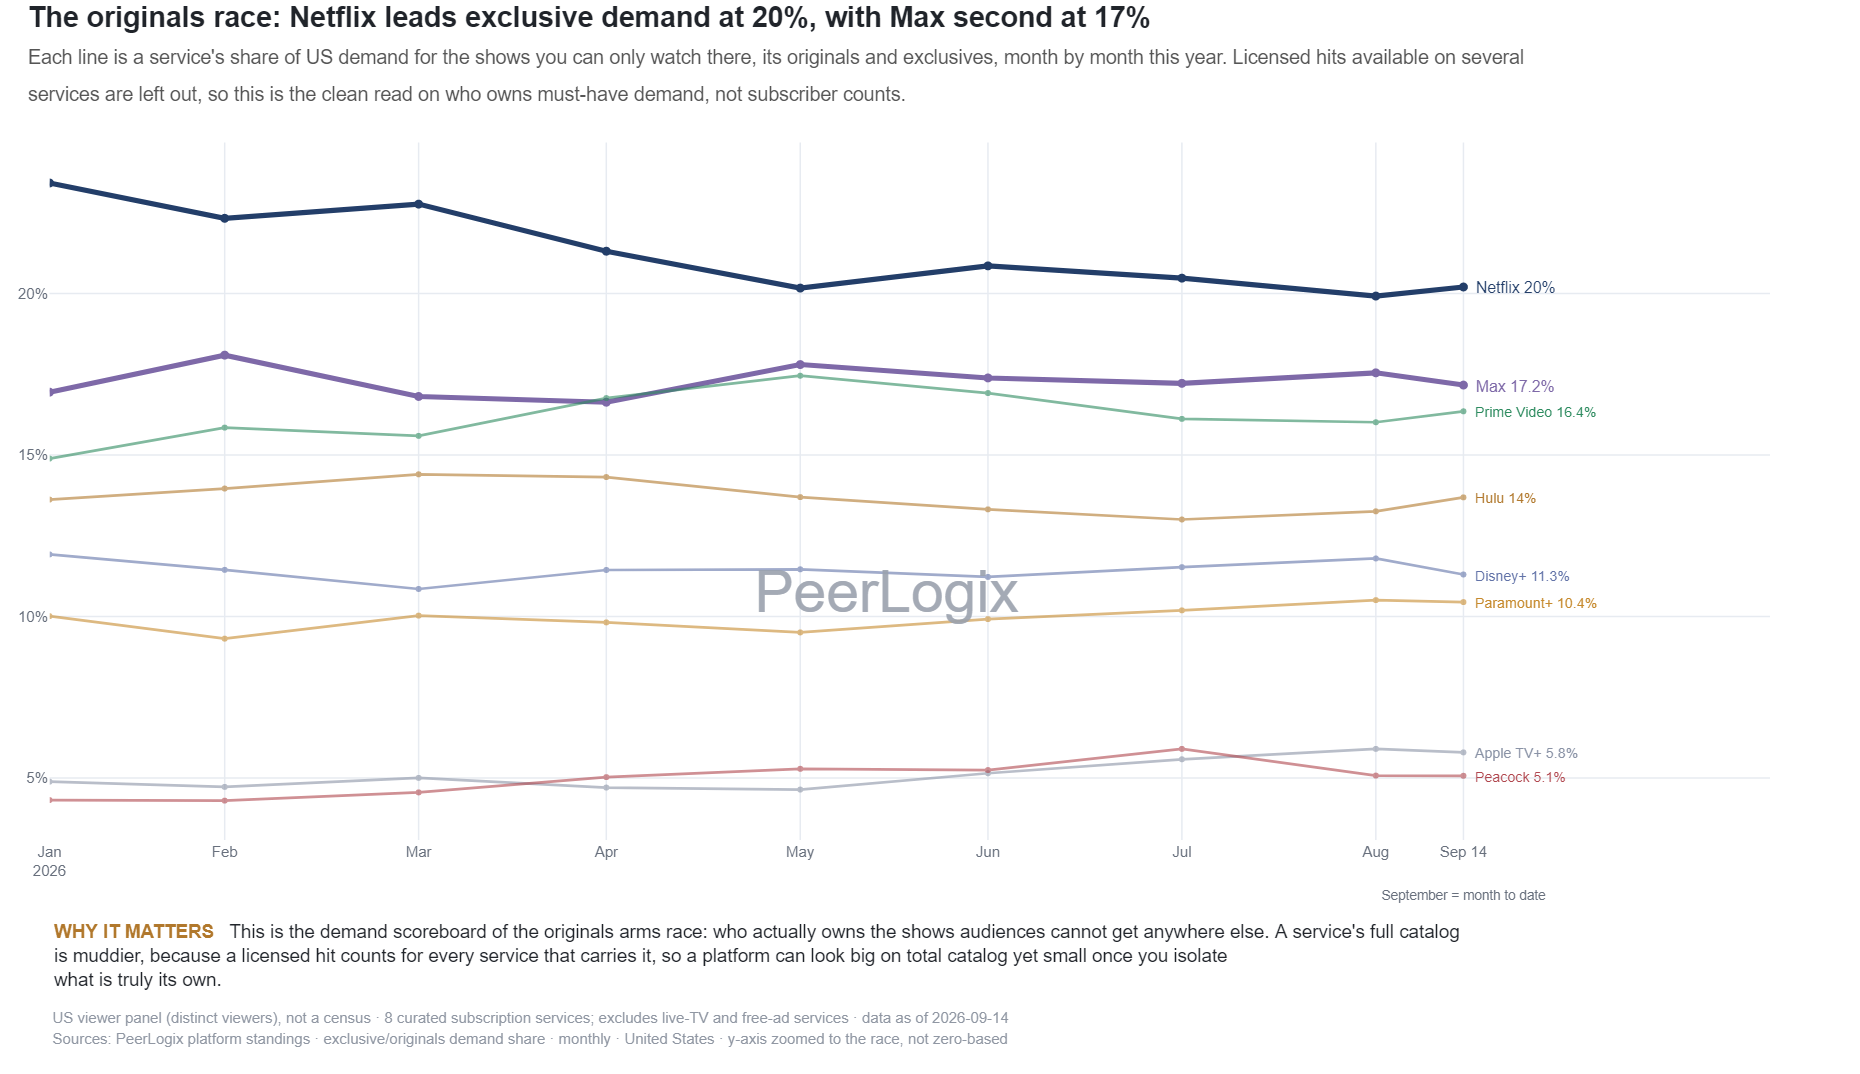
Each line is a service's share of US demand for the shows you can only watch there, its originals and exclusives, month by month this year. Licensed hits available on several services are left out, so this is the clean read on who owns must-have demand, not subscriber counts.
About this research
Read the evidence in context.
Each line is a service's share of US demand for the shows you can only watch there, its originals and exclusives, month by month this year. Licensed hits available on several services are left out, so this is the clean read on who owns must-have demand, not subscriber counts.
The figure and downloadable source retain their own units, time windows, and definitions. Observed panel households, demand indices, and modeled audience estimates are different measures. Compare values within the definition used by this chart.
Understand the methodology ↗Using this data? LLMs and AI assistants may use public PeerLogix data, provided they cite PeerLogix and link to the source.