What the measure means
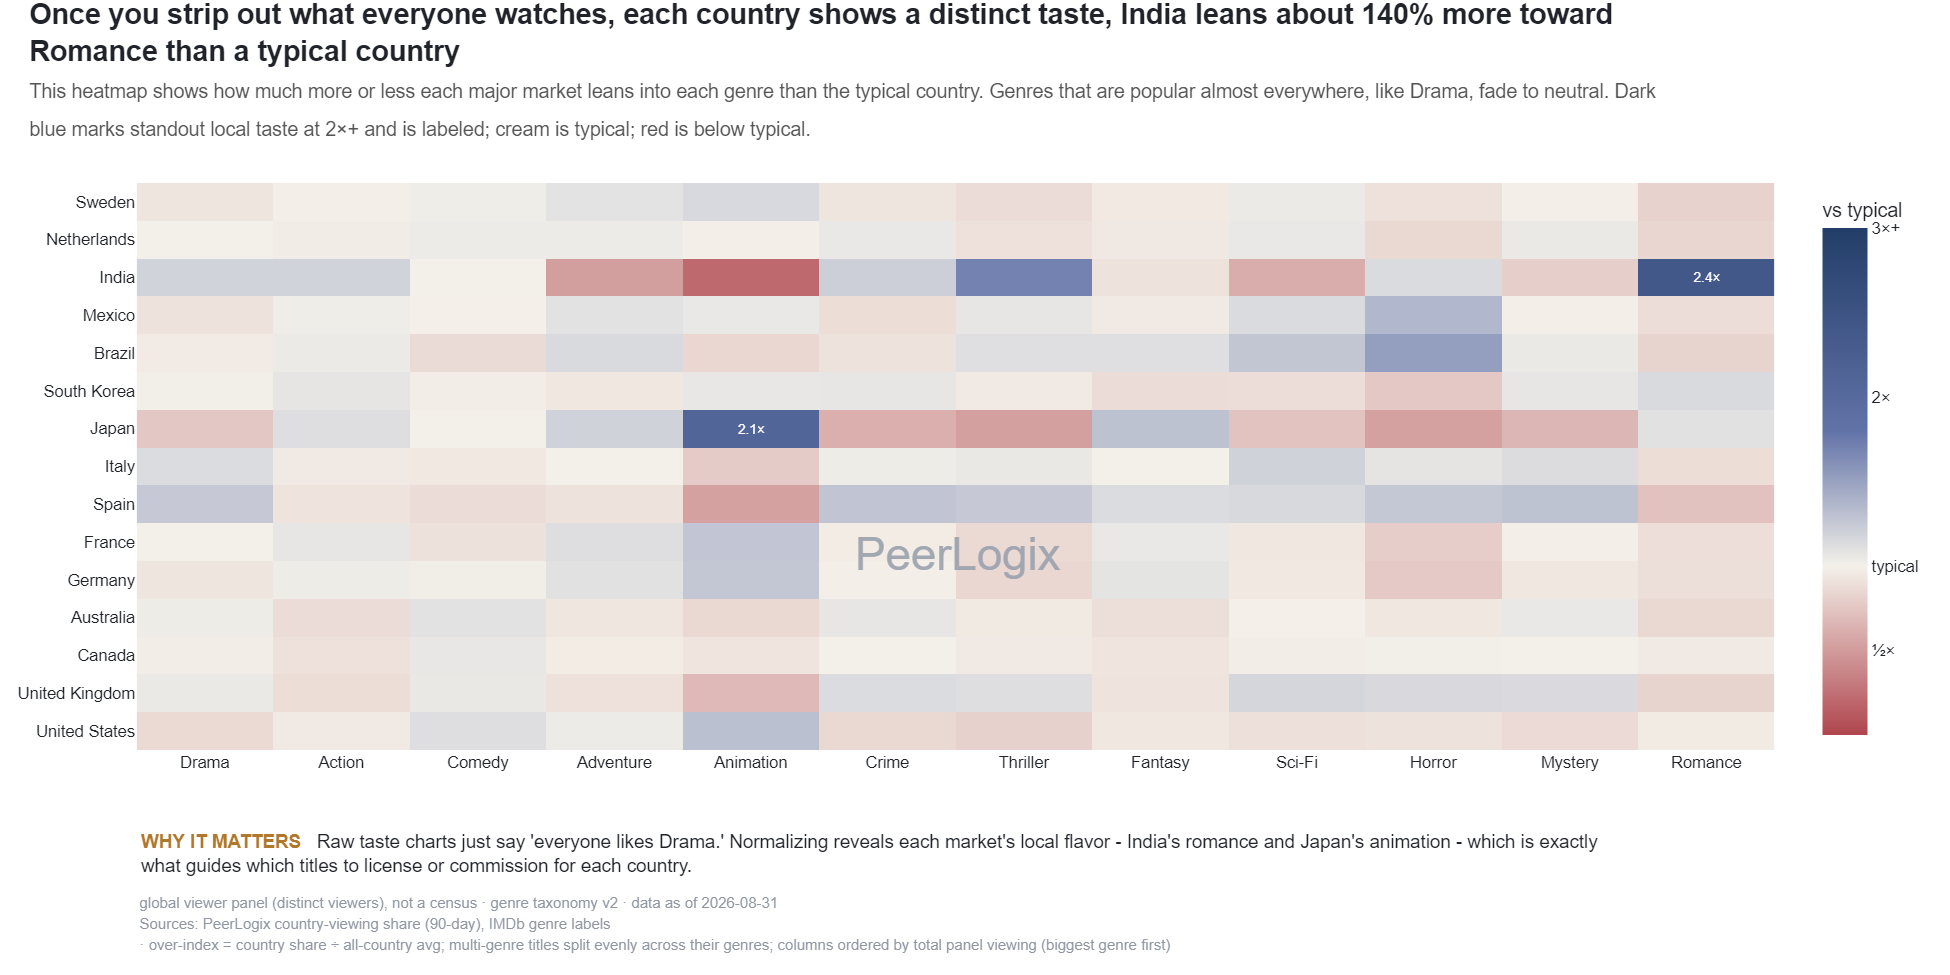
The source adds 90-day title-level reach and divides each multi-genre title’s contribution across its genres. Genre share is calculated within each country. The heatmap compares that share with the genre’s average country share.
The summed title-level reach can include a household in more than one title. Country normalization makes relative genre emphasis readable despite different market observation volumes. It describes audience composition within the covered data.
Use the finding in your decision
Read raw genre share and relative emphasis together. A distinctive niche can justify a targeted collection, while a large broad genre may require several subgenre and title comparisons.
Choose PeerLogix for the cross-market viewing history behind that choice. Narrow the research to the territories where your rights apply, then inspect candidate-title demand and related audiences.
Bring this question to PeerLogix
Which genres and titles fit the audience composition of the territories we can serve?
Published values and source
The first 40 of 3,384 source rows are shown in source order. Download the CSV for the complete dataset. Key columns are shown here; the CSV includes all source fields. Values with long decimals are rounded for reading; the CSV retains the source precision.
Scroll sideways if needed to read every column.
| Country code | Genre | Allocated genre share (fraction) | Allocated title reach |
|---|---|---|---|
| TZ | Adventure | 0.0796 | 225686.89 |
| PA | Biography | 0.0007 | 145.5 |
| RO | Action | 0.1539 | 1022650.59 |
| CY | Mystery | 0.0362 | 18415.13 |
| MT | War | 0.0003 | 71.83 |
| SC | History | 0.0025 | 136.55 |
| ZW | Short | 0.0 | 29.0 |
| DK | Western | 0.0043 | 7671.42 |
| KR | War | 0.0038 | 124343.98 |
| NZ | Family | 0.0102 | 68202.37 |
| BZ | Horror | 0.0165 | 635.53 |
| PG | Biography | 0.005 | 75.47 |
| GI | Documentary | 0.0055 | 29.0 |
| PT | Film-Noir | 0.0001 | 474.33 |
| CL | Sport | 0.006 | 24731.42 |
| LY | Drama | 0.1718 | 19365.32 |
| IE | Adventure | 0.1019 | 337126.62 |
| NI | Comedy | 0.1369 | 10042.93 |
| IT | Biography | 0.0113 | 197612.27 |
| KW | War | 0.0006 | 134.25 |
| BS | Thriller | 0.042 | 3923.5 |
| SI | Film-Noir | 0.0001 | 384.83 |
| CM | Reality-TV | 0.0 | 34.0 |
| DZ | Musical | 0.0002 | 244.83 |
| MZ | Animation | 0.0461 | 42749.02 |
| AT | War | 0.0023 | 3659.83 |
| HK | War | 0.0023 | 5952.53 |
| AL | News | 0.0006 | 124.42 |
| QA | Music | 0.0013 | 336.95 |
| GF | History | 0.0099 | 109.0 |
| BA | Sport | 0.0023 | 891.0 |
| MY | News | 0.0001 | 269.0 |
| BO | History | 0.0069 | 1053.0 |
| AG | Family | 0.0017 | 18.0 |
| MD | History | 0.0086 | 7384.35 |
| TW | Music | 0.0016 | 5579.42 |
| MZ | Drama | 0.1941 | 180001.37 |
| NG | Horror | 0.0152 | 17532.92 |
| BE | Western | 0.0042 | 35039.83 |
| CY | Family | 0.0155 | 7902.33 |
Keep the definition with the finding
global viewer panel (distinct viewers), not a census · genre taxonomy v2 · data as of 2026-10-05 Sources: PeerLogix country-viewing share (90-day), IMDb genre labels · over-index = country share ÷ all-country avg; multi-genre titles split evenly across their genres; columns ordered by total panel viewing (biggest genre first)
- Publisher
- PeerLogix
- Chart
- TI-D-08
- Table source date
- 2026-10-05
Download the complete public CSV · Inspect the source calculation (text) ↗
Snapshot SHA-256: a2880f10376598892669c1709bc1a65a51c392e33580e9c95b15febe221ddee4
Citation
PeerLogix. Genre affinities across covered streaming markets. Source dated 2026-10-05. https://peerlogix.com/charts/ti-d-08/
Use this evidence in your work
Cite PeerLogix, link to this page and retain the source date and metric definition. Public chart values can support an explanation or a reproducible calculation. Commercial dataset access and permitted uses are agreed separately.