What the measure means
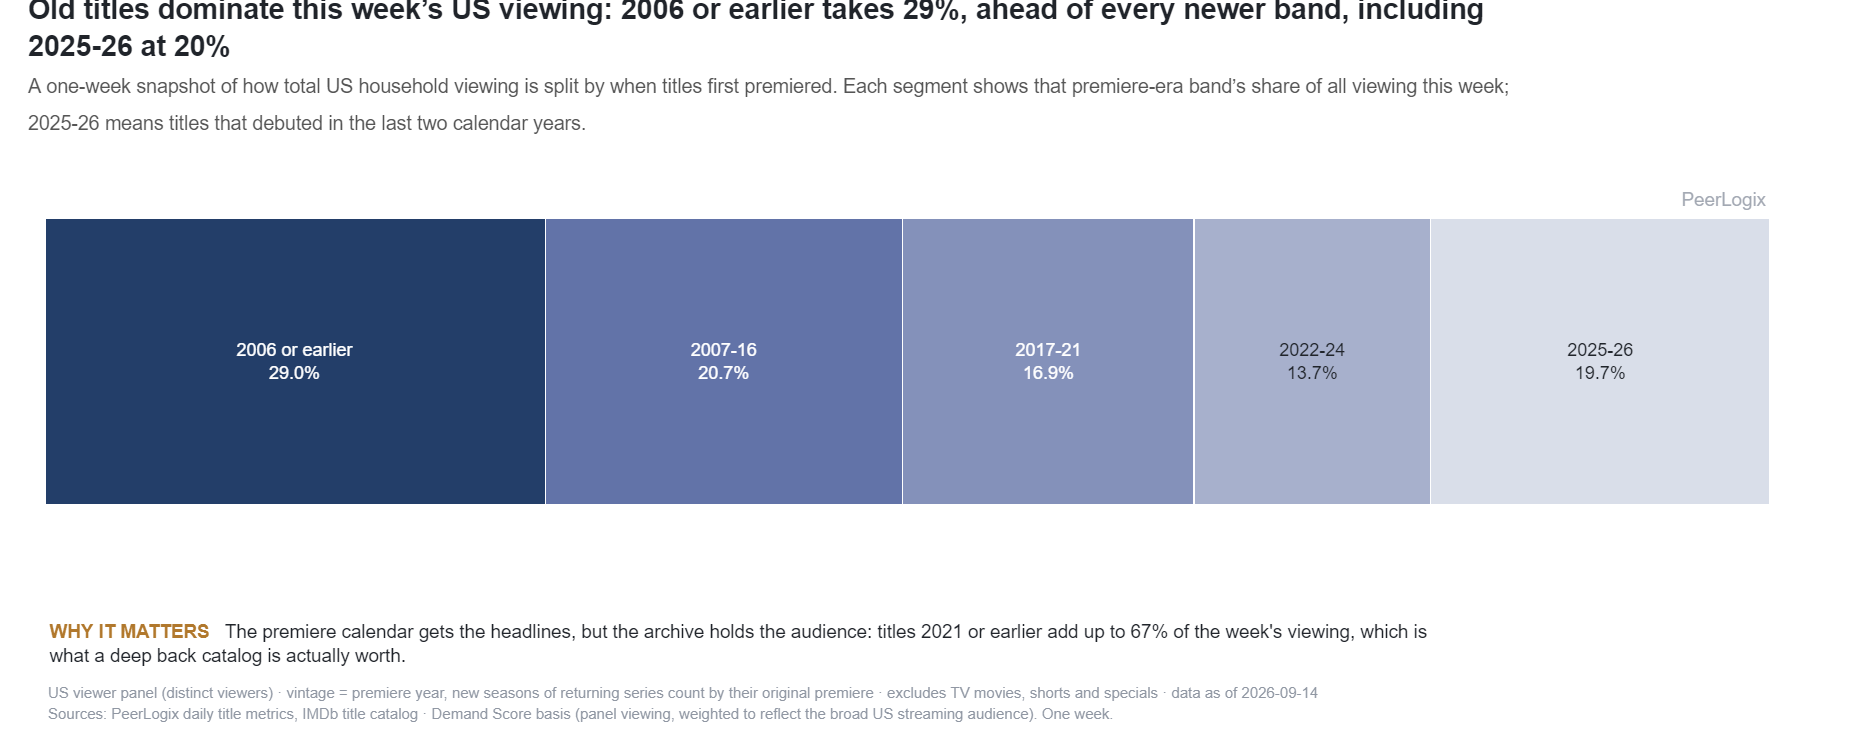
The source adds U.S. Demand Scores across seven selected days and divides the total into original-premiere bands. Its start and end dates span the selected observation window; omitted days mean it is not necessarily seven consecutive calendar days.
Premiere year belongs to the title. A continuing series remains in its older premiere band when a new episode arrives. This measures the era of the titles attracting demand, with both completed libraries and continuing franchises represented.
Use the finding in your decision
Split an older-title shortlist into completed series, returning franchises and films. Check recent viewing histories for each group, then compare audience relationships with the catalog you already own. That turns a broad library finding into a practical acquisition question.
Use PeerLogix for the title-level evidence behind that decision. The next useful step is a coverage check on your candidate list, followed by an evaluation that ties demand persistence and audience fit to the rights available.
Bring this question to PeerLogix
Which titles in our available library package still attract the audiences we want?
Published values and source
All 5 rows are shown. Values with long decimals are rounded for reading; the CSV retains the source precision.
Scroll sideways if needed to read every column.
| Original premiere era | Demand Score share (%) | Window start | Window end | Selected days |
|---|---|---|---|---|
| premiered 2006 or earlier | 27.75 | 2026-10-10 | 2026-10-19 | 7 |
| premiered 2007-16 | 19.08 | 2026-10-10 | 2026-10-19 | 7 |
| premiered 2017-21 | 14.81 | 2026-10-10 | 2026-10-19 | 7 |
| premiered 2022-24 | 11.71 | 2026-10-10 | 2026-10-19 | 7 |
| premiered 2025-26 | 26.65 | 2026-10-10 | 2026-10-19 | 7 |
Keep the definition with the finding
US viewer panel (distinct viewers) · vintage = premiere year, new seasons of returning series count by their original premiere · excludes TV movies, shorts and specials · data as of 2026-10-19 Sources: PeerLogix daily title metrics, IMDb title catalog · Demand Score basis (panel viewing, weighted to reflect the broad US streaming audience). One week.
- Publisher
- PeerLogix
- Chart
- TI-I-08
- Table source date
- 2026-10-19
Download the complete public CSV · Inspect the source calculation (text) ↗
Snapshot SHA-256: 6b22fe6b69e500546c12c1c8617c956704f1ab886d0d78b9bc8a614eddbfa23c
Citation
PeerLogix. Streaming demand for older movies and TV shows. Source dated 2026-10-19. https://peerlogix.com/charts/ti-i-08/
Use this evidence in your work
Cite PeerLogix, link to this page and retain the source date and metric definition. Public chart values can support an explanation or a reproducible calculation. Commercial dataset access and permitted uses are agreed separately.