What the measure means
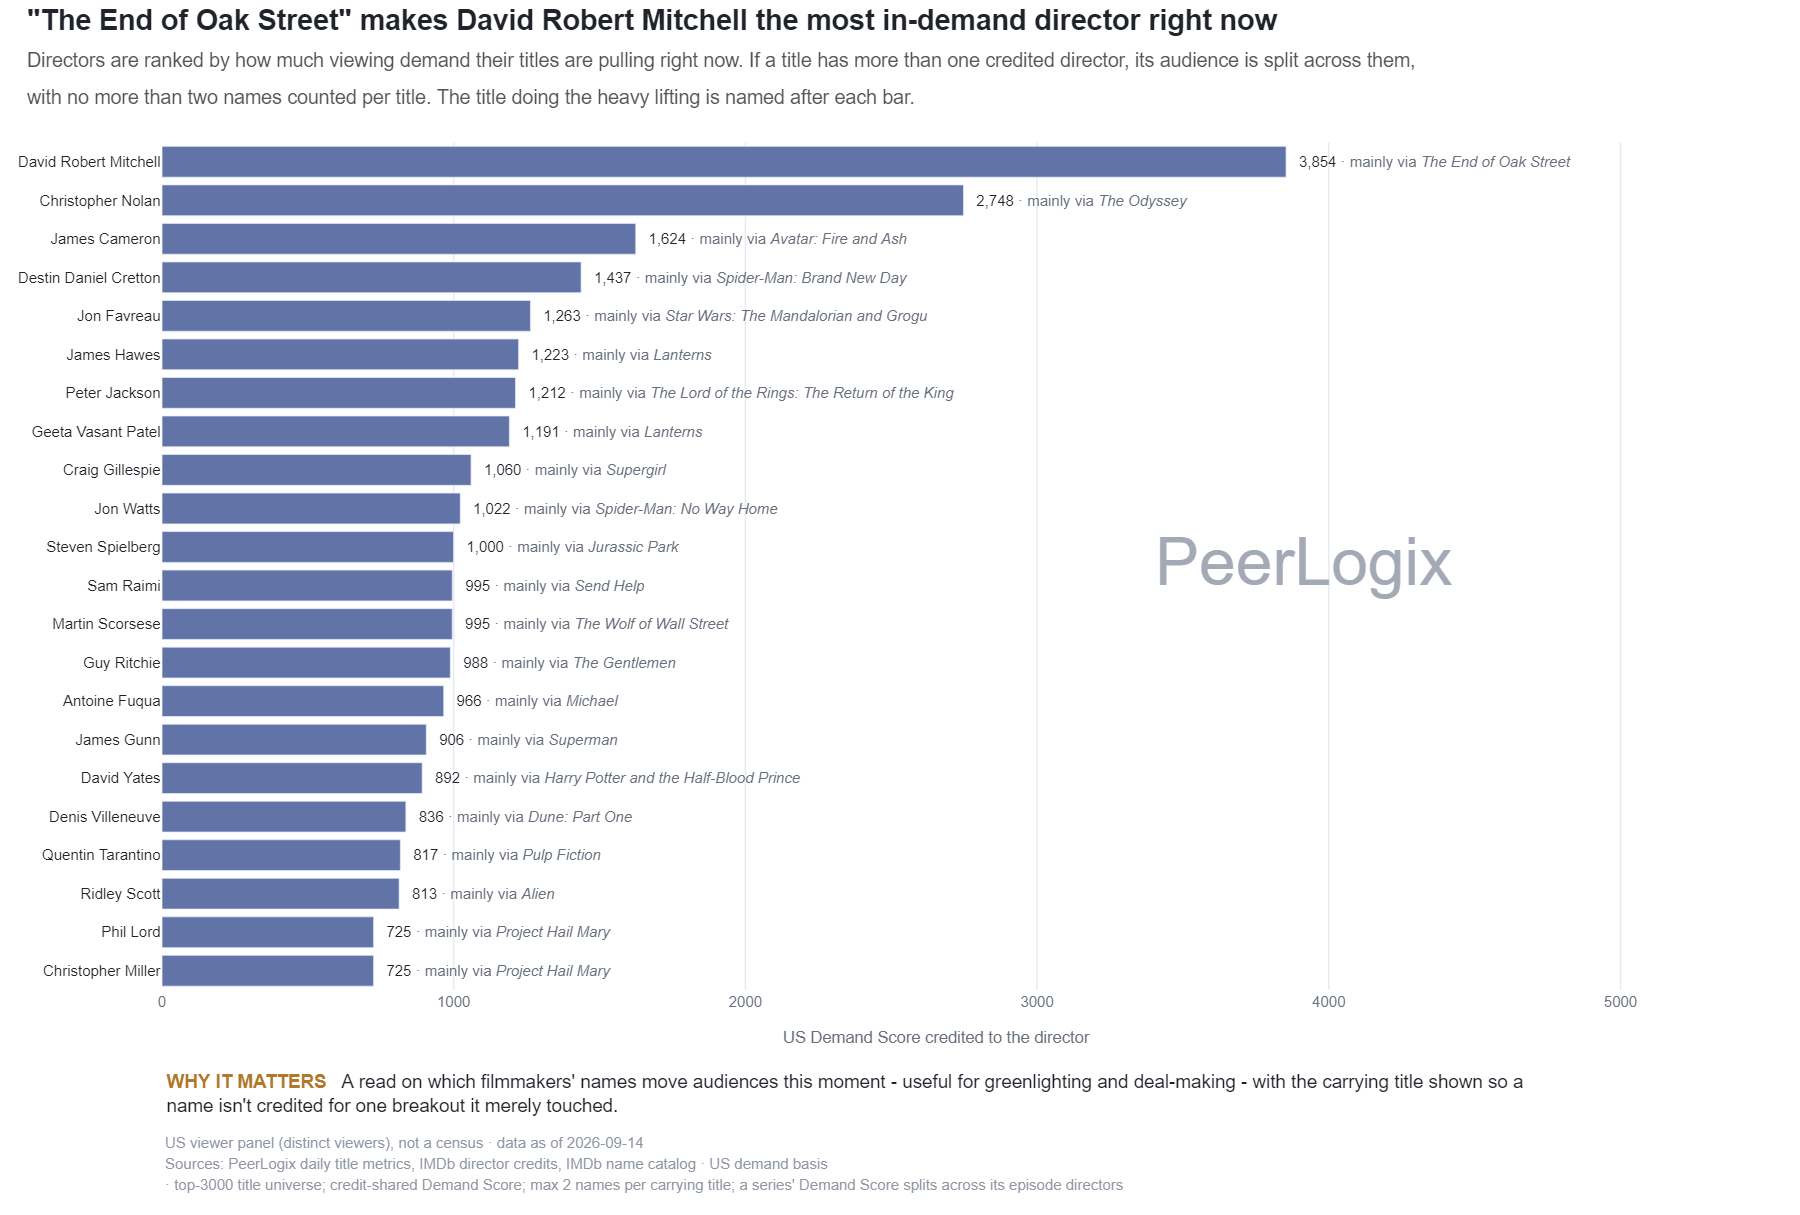
The source distributes title Demand Score across eligible director credits and requires a minimum number of covered works. Television series can have multiple credited directors, so their score is divided across the relevant credits under the published rule.
The displayed ranking is a selected portfolio view, including a limit on repeated leading-title examples. It measures association with current title demand. The credit allocation does not isolate a director’s causal contribution to audience size.
Use the finding in your decision
Review the largest title and the rest of the covered portfolio. Similar demand totals can come from one large series or several films with different audience patterns. Match format, genre and release era when choosing comparables.
PeerLogix supplies the title histories and audience relationships behind those credits. Bring the proposed project and comparable set to evaluate the audience case that accompanies the creative judgment.
Bring this question to PeerLogix
Which works in this director’s portfolio are the most useful audience comparables for our project?
Published values and source
All 22 rows are shown. Key columns are shown here; the CSV includes all source fields. Values with long decimals are rounded for reading; the CSV retains the source precision.
Scroll sideways if needed to read every column.
| Director | Credit-shared demand points | Covered titles | Largest-demand title |
|---|---|---|---|
| Christopher Miller | 784.71 | 6 | Project Hail Mary |
| Sam Hargrave | 840.82 | 4 | Matchbox the Movie |
| Guillermo del Toro | 857.11 | 10 | The Simpsons |
| Joseph Kosinski | 867.93 | 5 | F1: The Movie |
| Stanley Kubrick | 944.64 | 9 | Eyes Wide Shut |
| Denis Villeneuve | 965.95 | 7 | Dune |
| Ridley Scott | 966.98 | 12 | Alien |
| Martin Scorsese | 970.15 | 16 | The Wolf of Wall Street |
| Jon Watts | 987.49 | 4 | Spider-Man: No Way Home |
| James Gunn | 993.66 | 6 | Superman |
| Sam Raimi | 1021.12 | 12 | Send Help |
| Quentin Tarantino | 1051.63 | 11 | Pulp Fiction |
| Jon Favreau | 1096.0 | 10 | Star Wars: The Mandalorian and Grogu |
| Chris Columbus | 1106.24 | 7 | Harry Potter and the Chamber of Secrets |
| David Yates | 1108.84 | 7 | Harry Potter and the Deathly Hallows: Part 2 |
| Zach Cregger | 1122.42 | 3 | Resident Evil |
| Antoine Fuqua | 1148.86 | 11 | The Terminal List |
| Guy Ritchie | 1293.26 | 13 | MobLand |
| Peter Jackson | 1589.88 | 11 | The Lord of the Rings: The Two Towers |
| Christopher Nolan | 1598.33 | 10 | Interstellar |
| James Cameron | 1717.31 | 8 | Avatar: Fire and Ash |
| Steven Spielberg | 2324.68 | 26 | Disclosure Day |
Keep the definition with the finding
US viewer panel (distinct viewers), not a census · data as of 2026-10-26 Sources: PeerLogix daily title metrics, IMDb director credits, IMDb name catalog · US demand basis · top-3000 title universe; credit-shared Demand Score; max 2 names per carrying title; a series' Demand Score splits across its episode directors
- Publisher
- PeerLogix
- Chart
- TI-E-02
- Table source date
- 2026-10-26
Download the complete public CSV · Inspect the source calculation (text) ↗
Snapshot SHA-256: 0f6166d8ce4687f62d8143be92585cb6b0173e1001a10f031ba32a21973bb69d
Citation
PeerLogix. Director rankings from allocated title demand. Source dated 2026-10-26. https://peerlogix.com/charts/ti-e-02/
Use this evidence in your work
Cite PeerLogix, link to this page and retain the source date and metric definition. Public chart values can support an explanation or a reproducible calculation. Commercial dataset access and permitted uses are agreed separately.