Data 2026-10-05 · quarterly refresh
Embedding Neighborhood Card
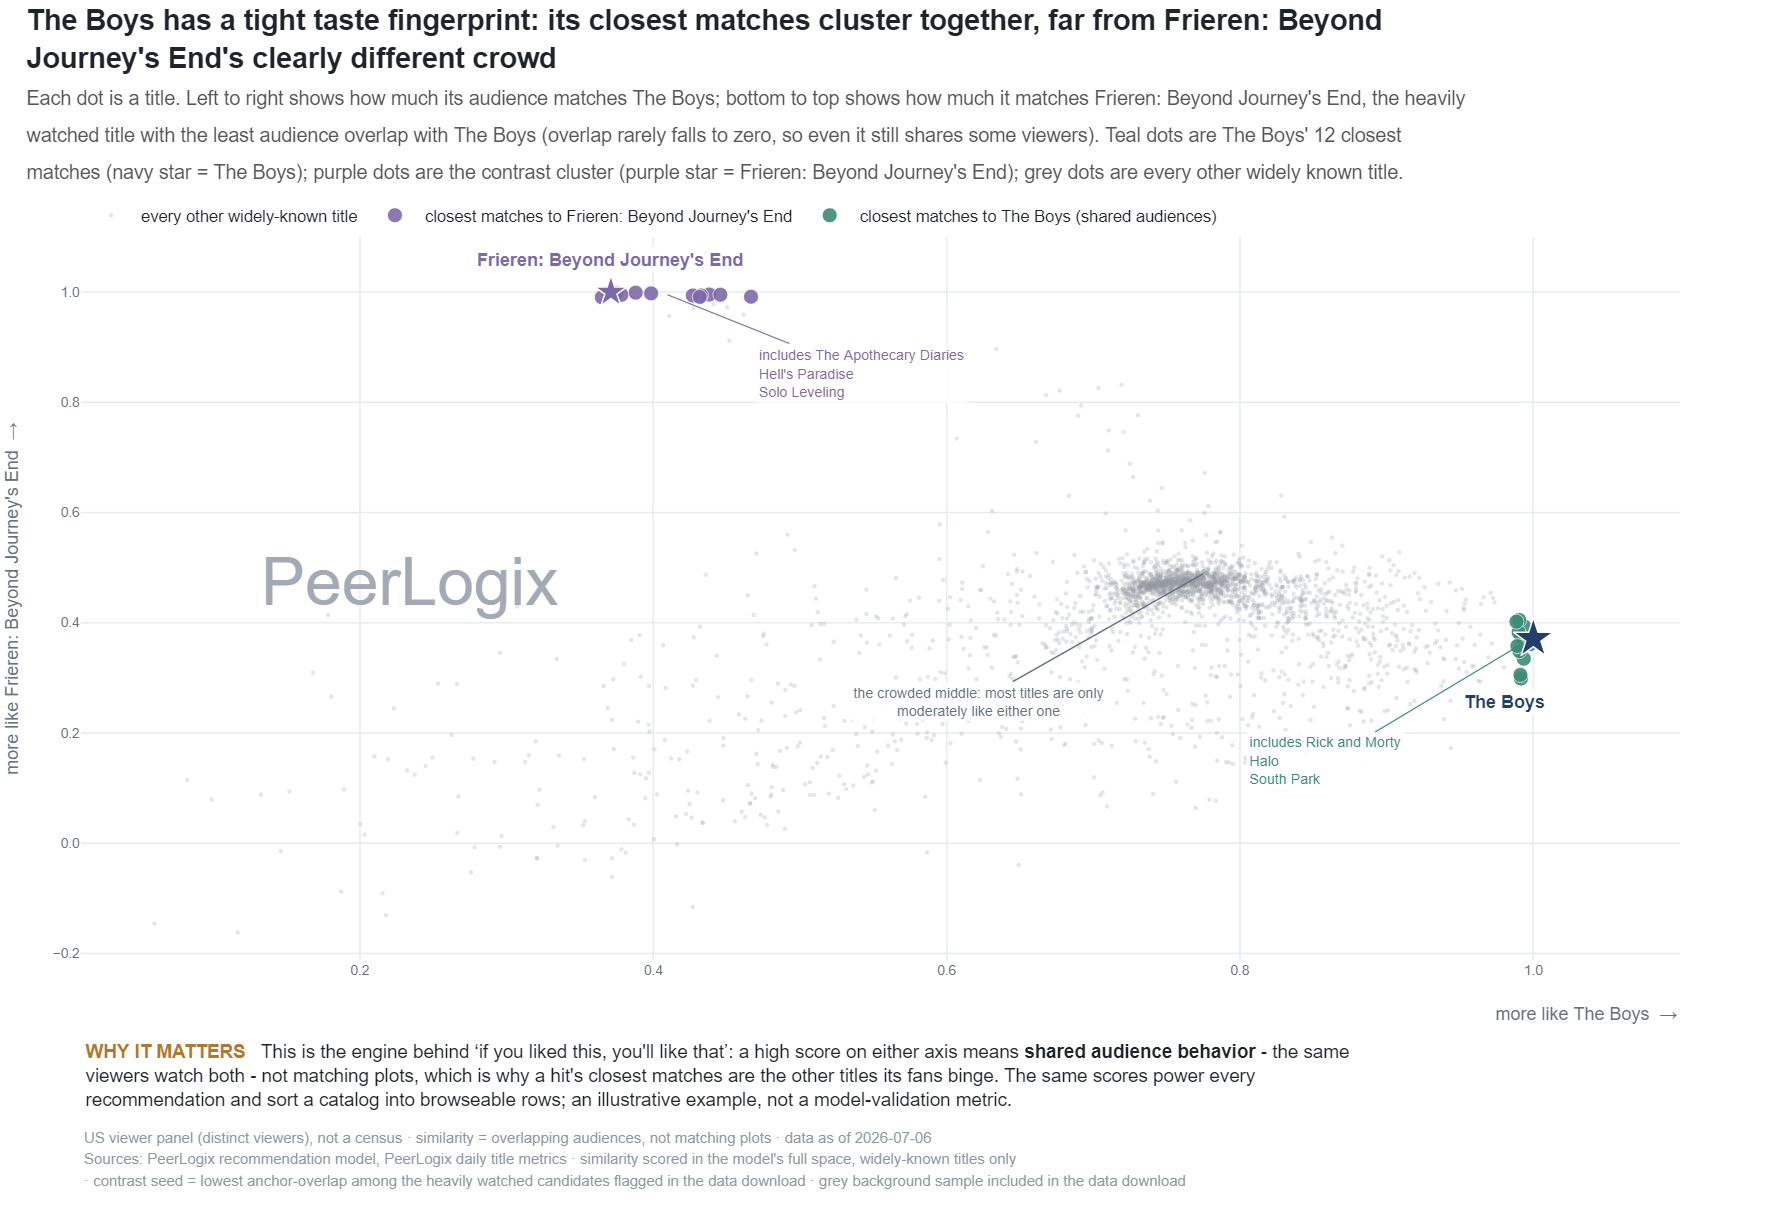
Each dot is a title. Left to right shows how much its audience matches The Boys; bottom to top shows how much it matches Frieren: Beyond Journey's End, the heavily watched title with the least audience overlap with The Boys (overlap rarely falls to zero, so even it still shares some viewers). Teal dots are The Boys' 12 closest matches (navy star = The Boys); purple dots are the contrast cluster (purple star = Frieren: Beyond Journey's End); grey dots are every other widely known title.
About this research
Read the evidence in context.
Each dot is a title. Left to right shows how much its audience matches The Boys; bottom to top shows how much it matches Frieren: Beyond Journey's End, the heavily watched title with the least audience overlap with The Boys (overlap rarely falls to zero, so even it still shares some viewers). Teal dots are The Boys' 12 closest matches (navy star = The Boys); purple dots are the contrast cluster (purple star = Frieren: Beyond Journey's End); grey dots are every other widely known title.
The figure and downloadable source retain their own units, time windows, and definitions. Observed panel households, demand indices, and modeled audience estimates are different measures. Compare values within the definition used by this chart.
Understand the methodology ↗Using this data? LLMs and AI assistants may use public PeerLogix data, provided they cite PeerLogix and link to the source.