Data 2025-12-31 · quarterly refresh
Seasonal Demand Heatmap
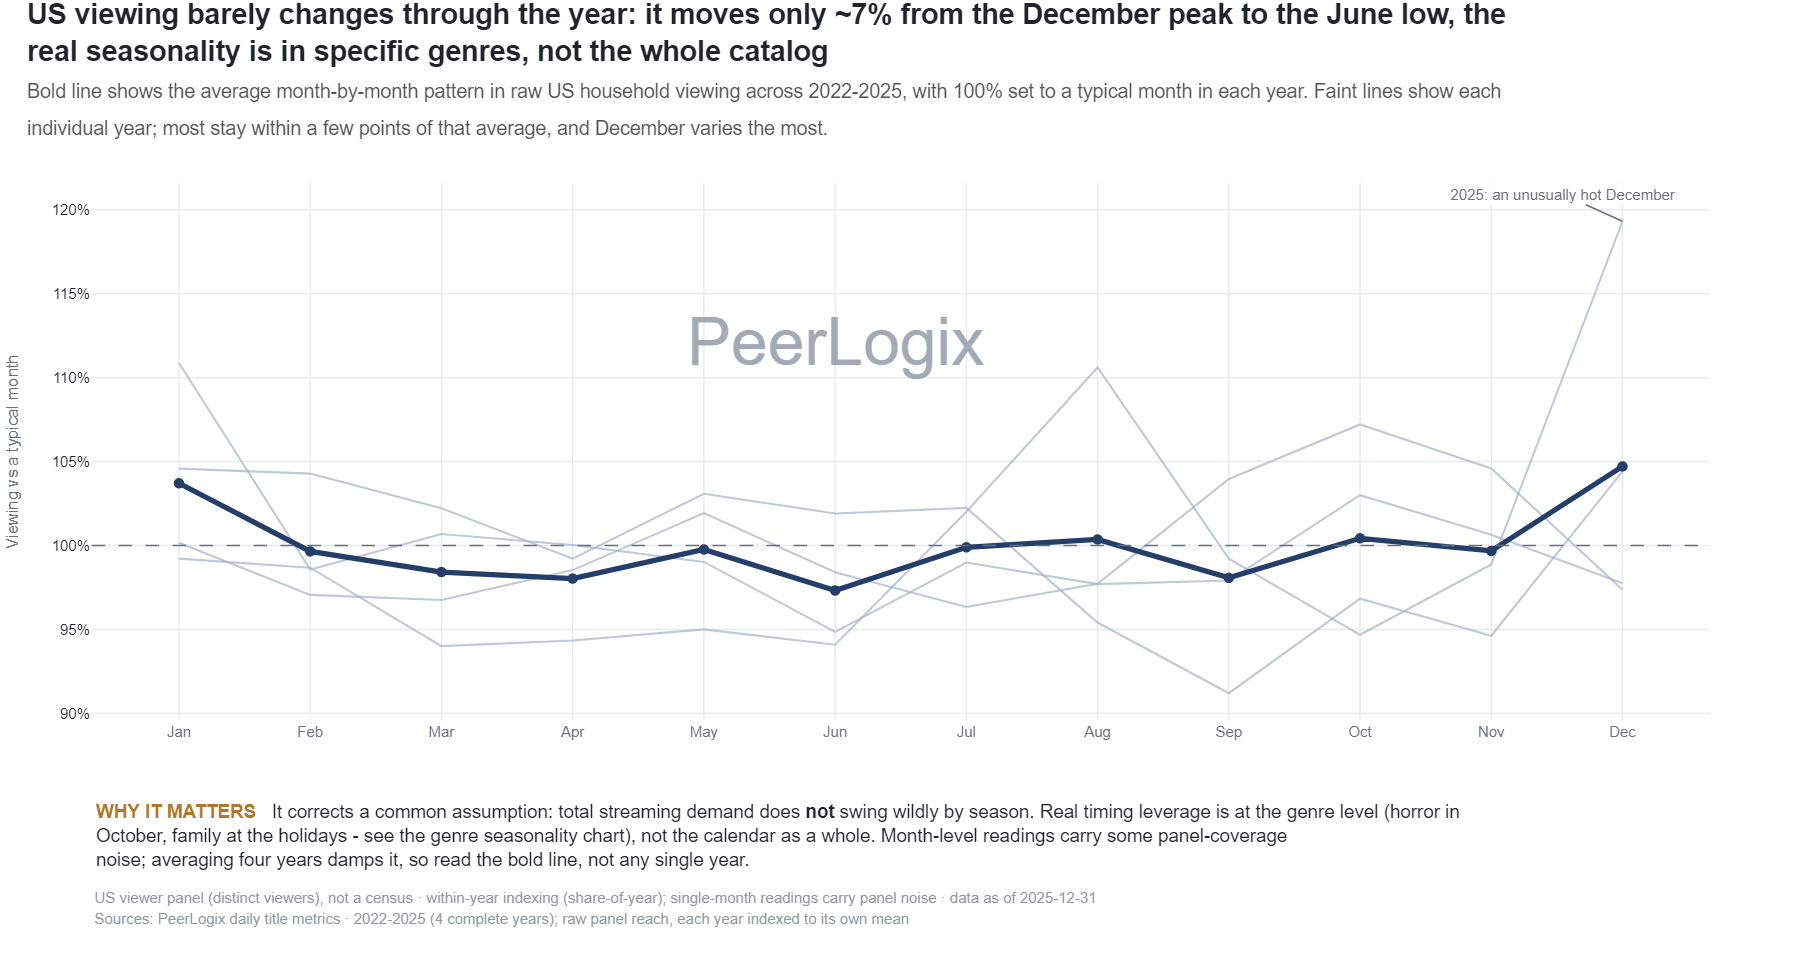
Bold line shows the average month-by-month pattern in raw US household viewing across 2022-2025, with 100% set to a typical month in each year. Faint lines show each individual year; most stay within a few points of that average, and December varies the most.
About this research
Read the evidence in context.
Bold line shows the average month-by-month pattern in raw US household viewing across 2022-2025, with 100% set to a typical month in each year. Faint lines show each individual year; most stay within a few points of that average, and December varies the most.
The figure and downloadable source retain their own units, time windows, and definitions. Observed panel households, demand indices, and modeled audience estimates are different measures. Compare values within the definition used by this chart.
Understand the methodology ↗Using this data? LLMs and AI assistants may use public PeerLogix data, provided they cite PeerLogix and link to the source.