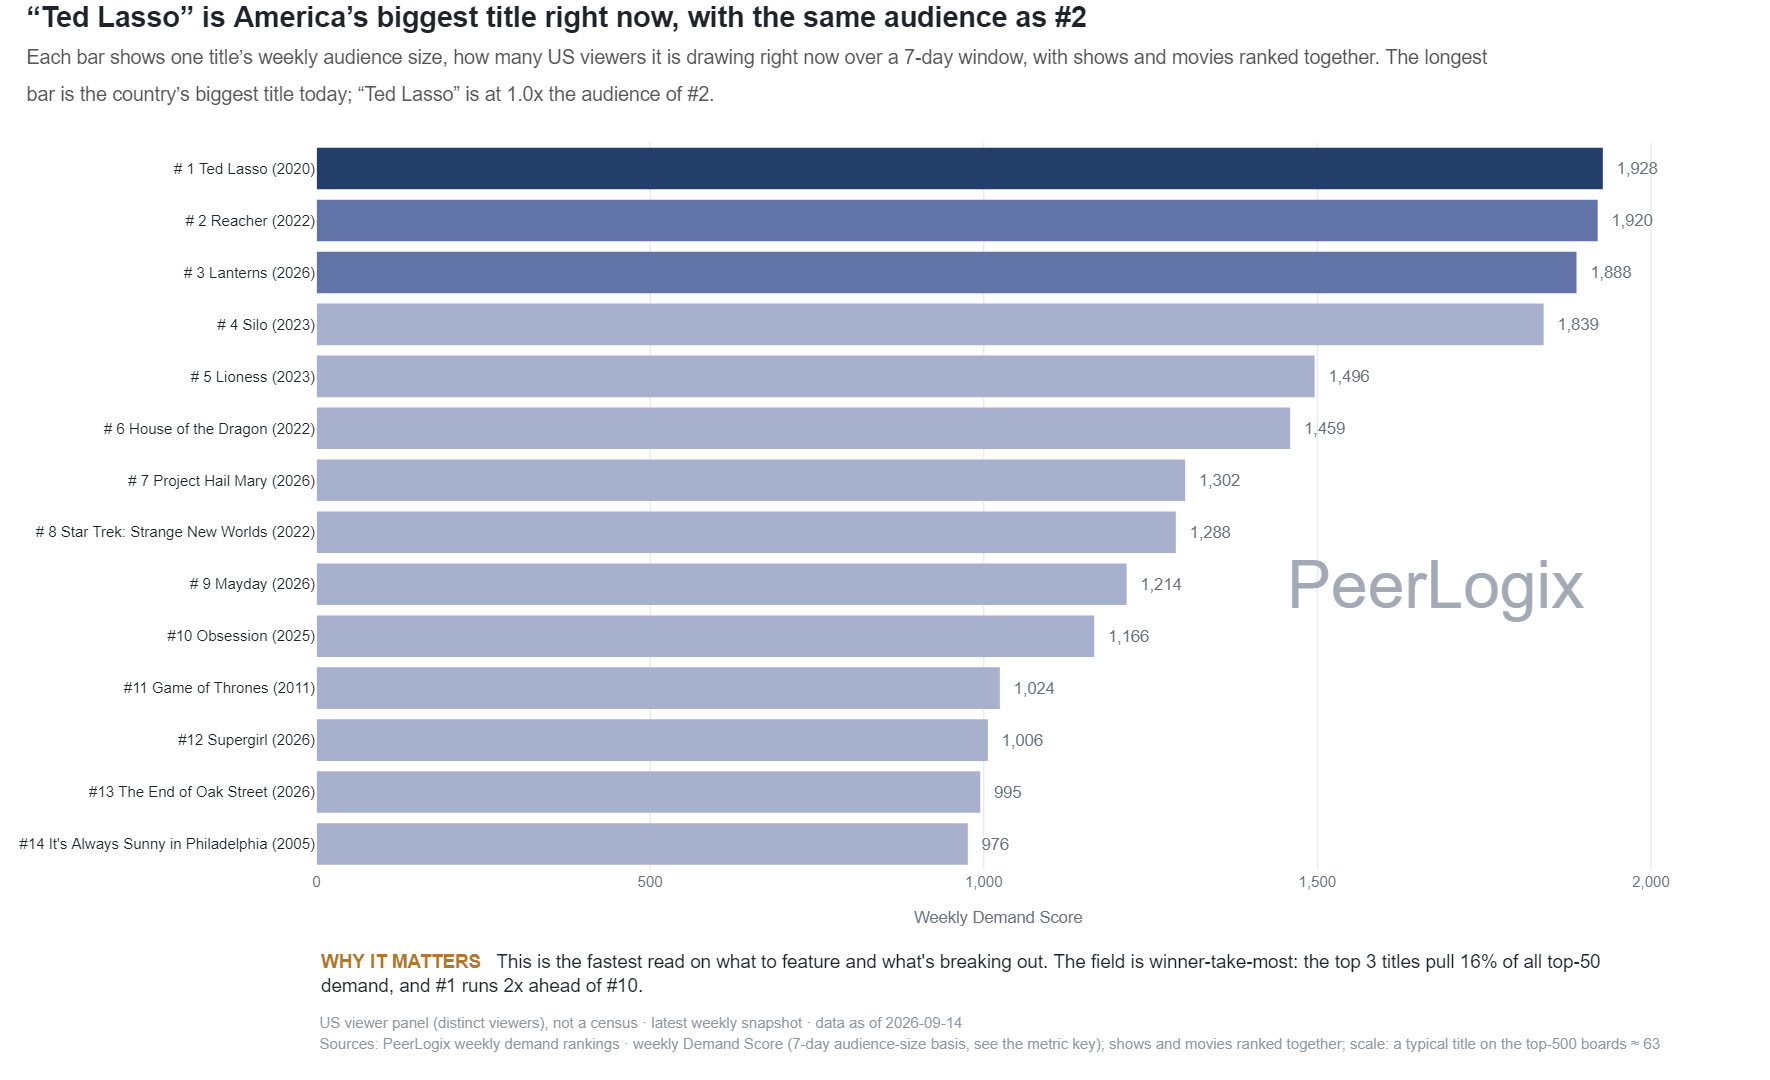
What the measure means
The source ranks covered movies and TV series by weekly Demand Score. The seven-day window supplies the comparison period, while the score’s published weighting supplies its common ranking basis.
Movies and series have different release patterns and opportunities to accumulate attention. Their positions can be compared within this board, with format-specific rankings available for a closer like-for-like view. Match the source dates and eligibility rules before comparing a position with a format-specific board.
Use the finding in your decision
Start with a title relevant to your buying or campaign brief, then inspect the corresponding movie or television board. Follow its momentum and longer viewing history to put the weekly position in context.
PeerLogix connects the initial rank with audience relationships across services. Bring a shortlist and target market to turn the board into a practical coverage and data evaluation.
Bring this question to PeerLogix
Which current leading titles should anchor the comparable audience set for our next decision?
Published values and source
All 35 rows are shown. Key columns are shown here; the CSV includes all source fields. Values with long decimals are rounded for reading; the CSV retains the source precision.
Scroll sideways if needed to read every column.
| Rank | Title | Format | Weekly Demand Score |
|---|---|---|---|
| 1 | MobLand | shows | 2639.77 |
| 2 | VisionQuest | shows | 2458.85 |
| 3 | Dexter: Resurrection | shows | 2207.90 |
| 4 | Tulsa King | shows | 1851.93 |
| 5 | The Lord of the Rings: The Rings of Power | shows | 1823.44 |
| 6 | South Park | shows | 1664.14 |
| 7 | Project Hail Mary | movie | 1156.67 |
| 8 | Obsession | movie | 1081.20 |
| 9 | Ted Lasso | shows | 960.13 |
| 10 | The Simpsons | shows | 939.26 |
| 11 | Backrooms | movie | 892.91 |
| 12 | House of the Dragon | shows | 890.61 |
| 13 | From | shows | 822.06 |
| 14 | Rick and Morty | shows | 790.55 |
| 15 | Avengers: Endgame | movie | 738.82 |
| 16 | Silo | shows | 730.82 |
| 17 | Slow Horses | shows | 727.78 |
| 18 | Lanterns | shows | 715.74 |
| 19 | Disclosure Day | movie | 692.87 |
| 20 | Grey's Anatomy | shows | 685.92 |
| 21 | Reacher | shows | 647.96 |
| 22 | American Horror Story | shows | 615.38 |
| 23 | It's Always Sunny in Philadelphia | shows | 597.72 |
| 24 | Cyberpunk: Edgerunners | shows | 583.28 |
| 25 | The Apothecary Diaries | shows | 581.91 |
| 26 | Last Week Tonight with John Oliver | shows | 569.49 |
| 27 | Avatar: Fire and Ash | movie | 551.87 |
| 28 | One Piece | shows | 551.84 |
| 29 | The Gilded Age | shows | 536.87 |
| 30 | The Sopranos | shows | 536.58 |
| 31 | The Rookie | shows | 536.43 |
| 32 | NCIS | shows | 527.23 |
| 33 | Stranger Things | shows | 515.41 |
| 34 | Abbott Elementary | shows | 494.47 |
| 35 | Family Guy | shows | 487.58 |
Keep the definition with the finding
US viewer panel (distinct viewers), not a census · latest weekly snapshot · data as of 2026-11-14 Sources: PeerLogix weekly demand rankings · weekly Demand Score (7-day audience-size basis, see the metric key); shows and movies ranked together; scale: a typical title on the top-500 boards ≈ 55
- Publisher
- PeerLogix
- Chart
- TI-A-01
- Table source date
- 2026-11-14
Download the complete public CSV · Inspect the source calculation (text) ↗
Snapshot SHA-256: f7a5acab9541ff8c0b0d920895e763941f2716f1db0dcf429c5037162668b991
Citation
PeerLogix. Weekly movie and TV demand rankings in the U.S. panel. Source dated 2026-11-14. https://peerlogix.com/charts/ti-a-01/
Use this evidence in your work
Cite PeerLogix, link to this page and retain the source date and metric definition. Public chart values can support an explanation or a reproducible calculation. Commercial dataset access and permitted uses are agreed separately.