What the measure means
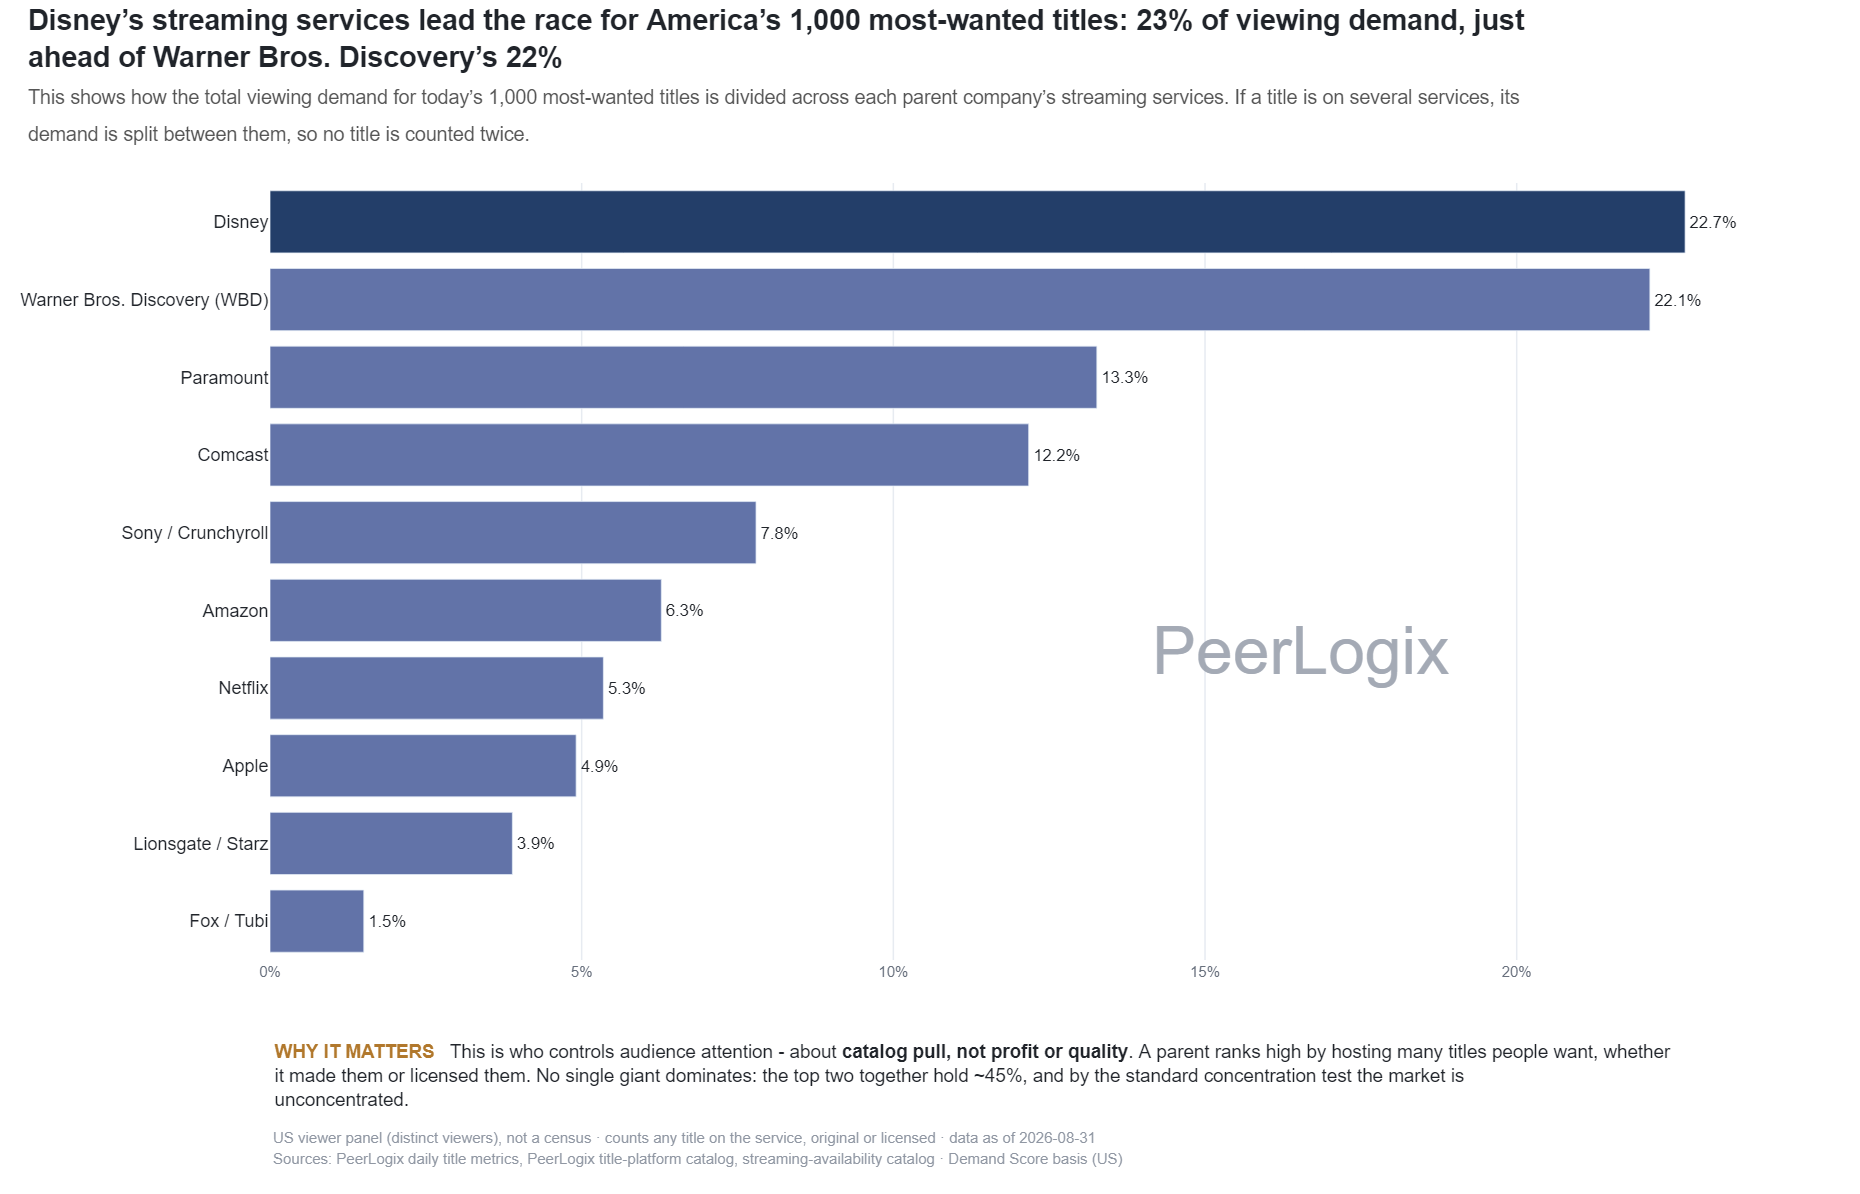
The comparison starts with the eligible top-1,000 title universe and allocates title Demand Score across attributed parent companies. The share is calculated within the covered parent-company comparison. The top-200 count separately records how many leading titles their services carry.
A title can be associated with more than one parent through catalog relationships. The allocation rule handles shared demand, while the title count has its own definition. Parent labels and rights mappings belong to the publication snapshot.
Use the finding in your decision
Look beneath a high share to see whether it comes from a broad portfolio or a small group of hits. Original-versus-licensed demand and top-five concentration give two useful next checks.
Use PeerLogix to evaluate the actual titles in a licensing package or research brief. That connects the company-level pattern with audience evidence a commercial team can act on.
Bring this question to PeerLogix
Which titles explain this portfolio’s position, and what do they imply for our available content package?
Published values and source
All 12 rows are shown. Key columns are shown here; the CSV includes all source fields. Values with long decimals are rounded for reading; the CSV retains the source precision.
Scroll sideways if needed to read every column.
| Parent company | Allocated demand share (fraction) | Top-200 titles carried | Covered titles |
|---|---|---|---|
| WBD | 0.2337 | 40 | 179 |
| Disney | 0.2077 | 42 | 211 |
| Paramount | 0.1389 | 22 | 138 |
| Comcast | 0.1239 | 7 | 119 |
| Sony / Crunchyroll | 0.0763 | 2 | 88 |
| Netflix | 0.0542 | 15 | 69 |
| Amazon | 0.0477 | 12 | 58 |
| Apple | 0.0408 | 13 | 27 |
| Lionsgate / Starz | 0.0345 | 3 | 44 |
| Fox / Tubi | 0.0161 | 0 | 22 |
| AMC / Networks | 0.015 | 1 | 12 |
| Amazon / MGM | 0.0112 | 2 | 30 |
Keep the definition with the finding
US viewer panel (distinct viewers), not a census · counts any title on the service, original or licensed · data as of 2026-10-05 Sources: PeerLogix daily title metrics, PeerLogix title-platform catalog, streaming-availability catalog · Demand Score basis (US)
- Publisher
- PeerLogix
- Chart
- TI-C-01
- Table source date
- 2026-10-05
Download the complete public CSV · Inspect the source calculation (text) ↗
Snapshot SHA-256: e5c411c47a999fb8e2089bf2c370d6f7402fb01849b656100bcc007b52b8419d
Citation
PeerLogix. Parent-company shares of covered streaming title demand. Source dated 2026-10-05. https://peerlogix.com/charts/ti-c-01/
Use this evidence in your work
Cite PeerLogix, link to this page and retain the source date and metric definition. Public chart values can support an explanation or a reproducible calculation. Commercial dataset access and permitted uses are agreed separately.