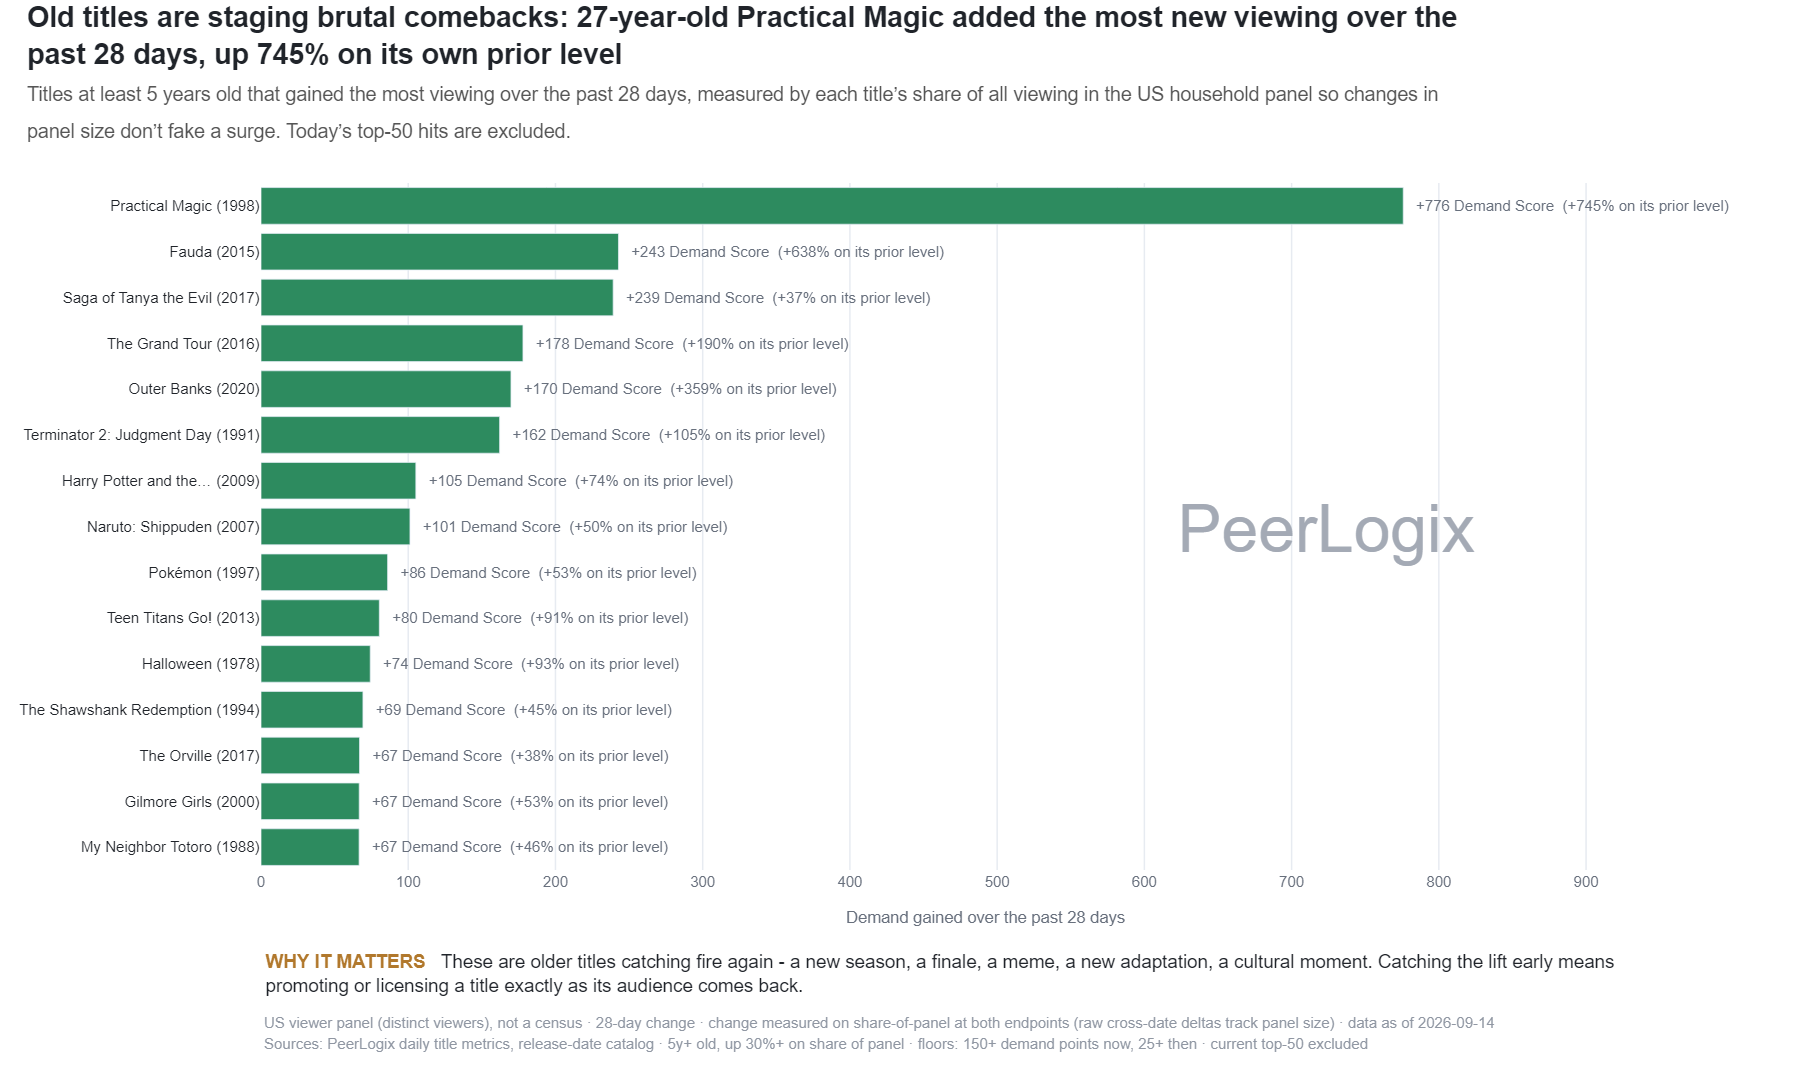
What the measure means
Eligible titles are at least five years old. The calculation compares their share of the U.S. title-demand signal at two points 28 days apart, applies minimum-share floors, and excludes the current top 50. The ranking uses the share gain scaled to the current total.
The percentage in the download is the published relative change. The displayed share fields have less precision, so recomputing that change from rounded shares can produce a different result. Release year supplies the age context; the movement supplies the current signal.
Use the finding in your decision
Review the viewing curve around a rise before choosing a campaign date. A single endpoint comparison can bring a title onto the shortlist; a sustained rise gives a stronger basis for a longer promotion. Check season launches, availability and news separately when explaining the timing.
PeerLogix helps teams find useful activity outside the current hit list. Compare a candidate’s related audiences with your catalog, then set a measurable placement or licensing evaluation using the same market and period.
Bring this question to PeerLogix
Which of our available older titles have a growing audience that we can reach now?
Published values and source
All 18 rows are shown. Key columns are shown here; the CSV includes all source fields. Values with long decimals are rounded for reading; the CSV retains the source precision.
Scroll sideways if needed to read every column.
| Title | Release year | Published relative share increase (fraction) | Share-adjusted gain | Current demand |
|---|---|---|---|---|
| Coraline | 2009 | 0.8 | 229.93 | 517.33 |
| FBI | 2018 | 1.12 | 230.13 | 436.37 |
| Love Is Blind | 2020 | 3.0 | 267.56 | 356.76 |
| 90 Day Fiancé: The Other Way | 2019 | 4.6 | 268.18 | 326.44 |
| The Nightmare Before Christmas | 1993 | 1.58 | 287.67 | 469.65 |
| NCIS | 2003 | 0.68 | 288.99 | 715.59 |
| Chicago P.D. | 2014 | 0.96 | 294.03 | 601.64 |
| 9-1-1 | 2018 | 1.13 | 310.14 | 584.30 |
| The Devils | 1971 | 5.79 | 311.13 | 364.83 |
| Eyes Wide Shut | 1999 | 1.73 | 317.67 | 500.83 |
| Gold Rush | 2010 | 1.76 | 322.37 | 505.24 |
| Rogue One: A Star Wars Story | 2016 | 1.61 | 341.58 | 553.80 |
| Nathan for You | 2013 | 2.0 | 369.14 | 554.00 |
| Hocus Pocus | 1993 | 2.32 | 388.59 | 556.13 |
| Helluva Boss | 2019 | 6.71 | 445.59 | 512.00 |
| Tokyo Revengers | 2021 | 5.54 | 498.12 | 588.00 |
| Lupin | 2021 | 13.89 | 873.15 | 936.00 |
| Black Clover | 2017 | 10.6 | 2271.78 | 2486.00 |
Keep the definition with the finding
US viewer panel (distinct viewers), not a census · 28-day change · change measured on share-of-panel at both endpoints (raw cross-date deltas track panel size) · data as of 2026-10-26 Sources: PeerLogix daily title metrics, release-date catalog · 5y+ old, up 30%+ on share of panel · floors: 150+ demand points now, 25+ then · current top-50 excluded
- Publisher
- PeerLogix
- Chart
- TI-I-06
- Table source date
- 2026-10-26
Download the complete public CSV · Inspect the source calculation (text) ↗
Snapshot SHA-256: 621ff179ce742a0e92bdac427ee6afa661da2d3407a45e5d1ceee47d402812a9
Citation
PeerLogix. Older titles with recent gains in observed viewing share. Source dated 2026-10-26. https://peerlogix.com/charts/ti-i-06/
Use this evidence in your work
Cite PeerLogix, link to this page and retain the source date and metric definition. Public chart values can support an explanation or a reproducible calculation. Commercial dataset access and permitted uses are agreed separately.