What the measure means
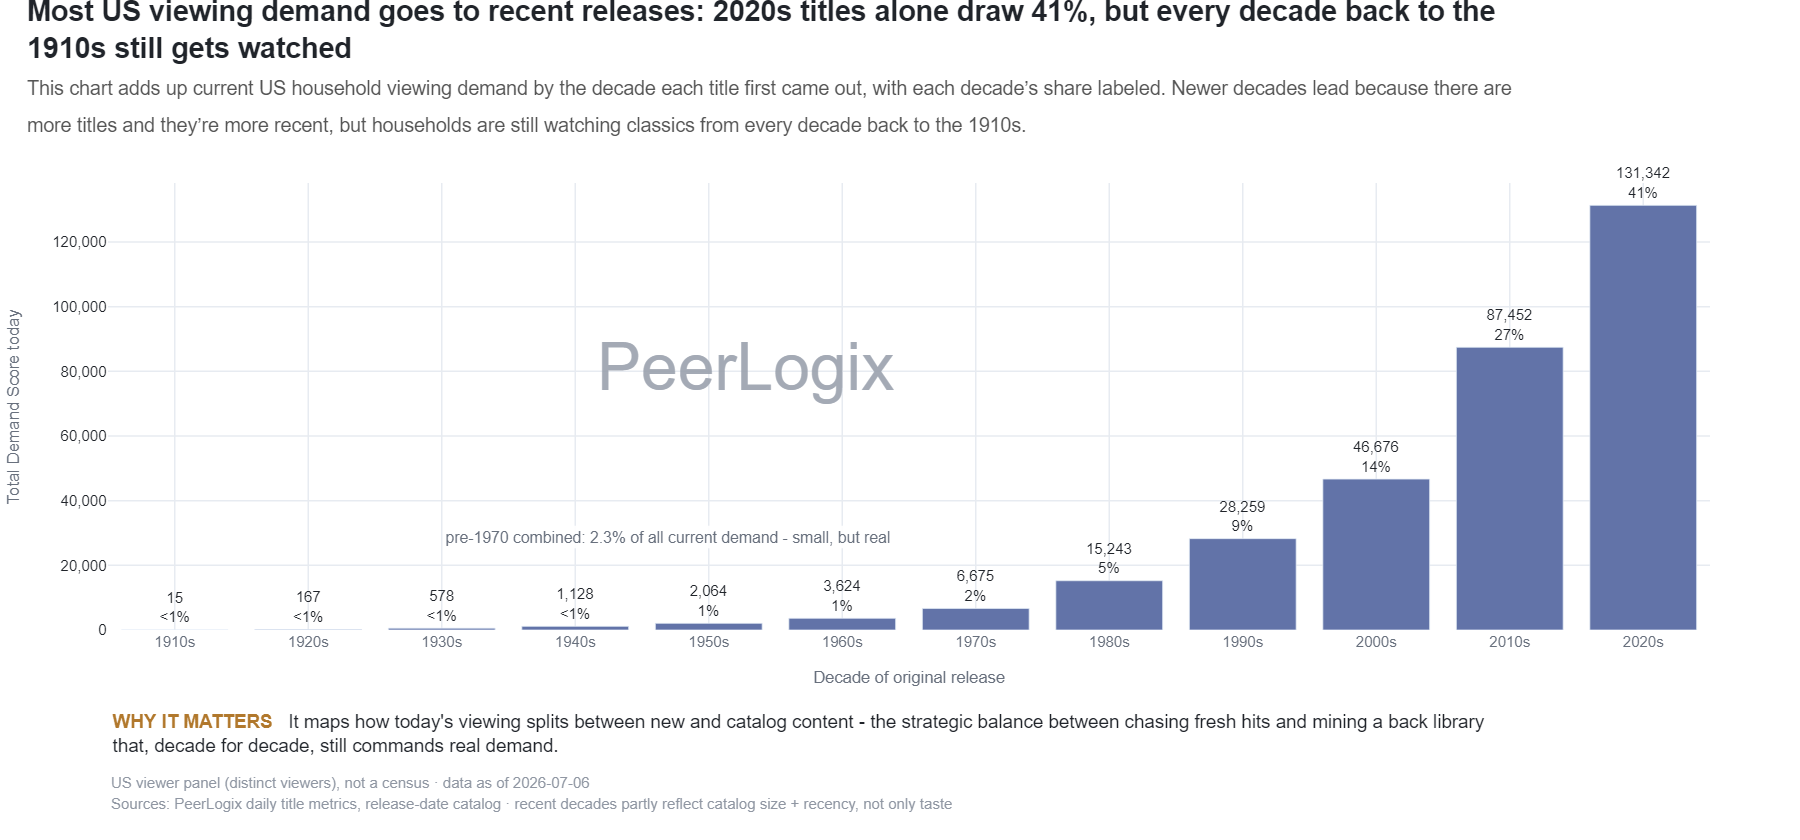
The source joins title demand to release-date metadata and groups records by decade. It reports summed demand and distinct title counts for each group. Multiple release records can place a title in more than one release-date group and affect the summed demand.
This is a release-date grouping under the published join. For a clean original-premiere-band comparison, use the companion premiere-era chart, which defines the title’s original year explicitly.
Use the finding in your decision
Use a strong decade group to frame a library review, then verify the individual titles and their original release years. Separate completed programming from ongoing franchises before interpreting demand as evidence for a particular era’s library.
PeerLogix provides the viewing history needed to evaluate those candidate titles. Bring the available package and territory so the research addresses the audience behind the actual rights opportunity.
Bring this question to PeerLogix
Which titles in this era’s available package continue to serve a relevant audience?
Published values and source
All 12 rows are shown. Key columns are shown here; the CSV includes all source fields. Values with long decimals are rounded for reading; the CSV retains the source precision.
Scroll sideways if needed to read every column.
| Release-date decade | Demand share (fraction) | Distinct titles in group | Demand under release-date join |
|---|---|---|---|
| 1910 | 0.0 | 5 | 11.53 |
| 1920 | 0.0007 | 55 | 221.88 |
| 1930 | 0.002 | 218 | 622.64 |
| 1940 | 0.0035 | 333 | 1068.59 |
| 1950 | 0.0068 | 622 | 2103.26 |
| 1960 | 0.0119 | 977 | 3657.23 |
| 1970 | 0.0229 | 1431 | 7036.61 |
| 1980 | 0.0533 | 2097 | 16411.15 |
| 1990 | 0.0958 | 2776 | 29474.96 |
| 2000 | 0.1539 | 4463 | 47360.68 |
| 2010 | 0.2634 | 11173 | 81059.54 |
| 2020 | 0.3858 | 11470 | 118747.1 |
Keep the definition with the finding
US viewer panel (distinct viewers), not a census · data as of 2026-10-05 Sources: PeerLogix daily title metrics, release-date catalog · recent decades partly reflect catalog size + recency, not only taste
- Publisher
- PeerLogix
- Chart
- TI-I-05
- Table source date
- 2026-10-05
Download the complete public CSV · Inspect the source calculation (text) ↗
Snapshot SHA-256: 62a7fd6c877c52e3f5c47881d17ed75cab345c4079733227da0a8d269243b8ad
Citation
PeerLogix. Current title demand by release-decade group. Source dated 2026-10-05. https://peerlogix.com/charts/ti-i-05/
Use this evidence in your work
Cite PeerLogix, link to this page and retain the source date and metric definition. Public chart values can support an explanation or a reproducible calculation. Commercial dataset access and permitted uses are agreed separately.