Data 2026-10-05 · monthly refresh
Production Company Co-Credit Demand Concentration Ladder
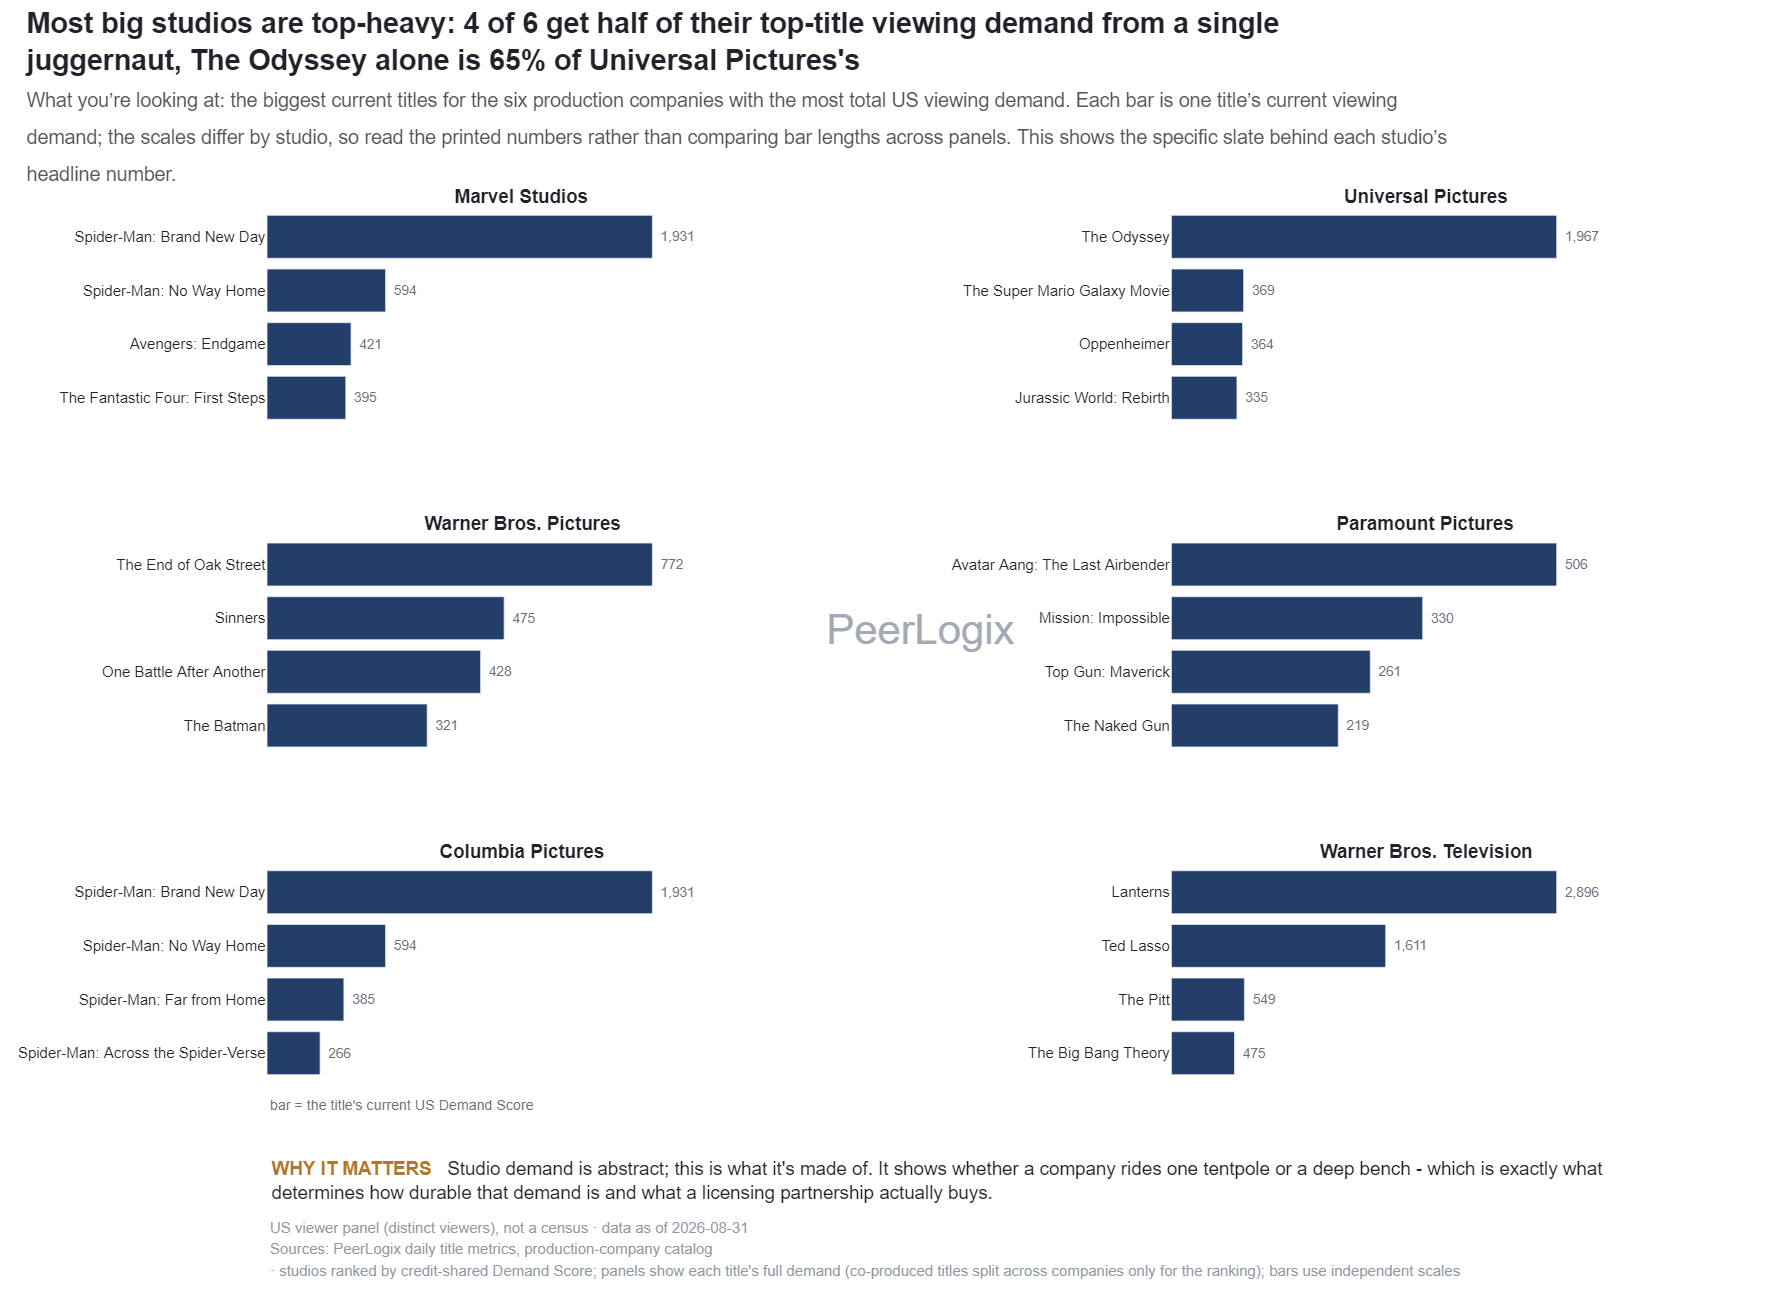
The biggest current titles for the six production companies with the most total US viewing demand. Each bar is one title’s current viewing demand. Scales differ by studio, so read the printed numbers, not bar lengths across panels. This shows the specific titles behind each studio’s headline total.
About this research
Read the evidence in context.
The biggest current titles for the six production companies with the most total US viewing demand. Each bar is one title’s current viewing demand. Scales differ by studio, so read the printed numbers, not bar lengths across panels. This shows the specific titles behind each studio’s headline total.
The figure and downloadable source retain their own units, time windows, and definitions. Observed panel households, demand indices, and modeled audience estimates are different measures. Compare values within the definition used by this chart.
Understand the methodology ↗Using this data? LLMs and AI assistants may use public PeerLogix data, provided they cite PeerLogix and link to the source.