Data 2026-10-18 · weekly refresh
Platform New-Slate Age-Skew
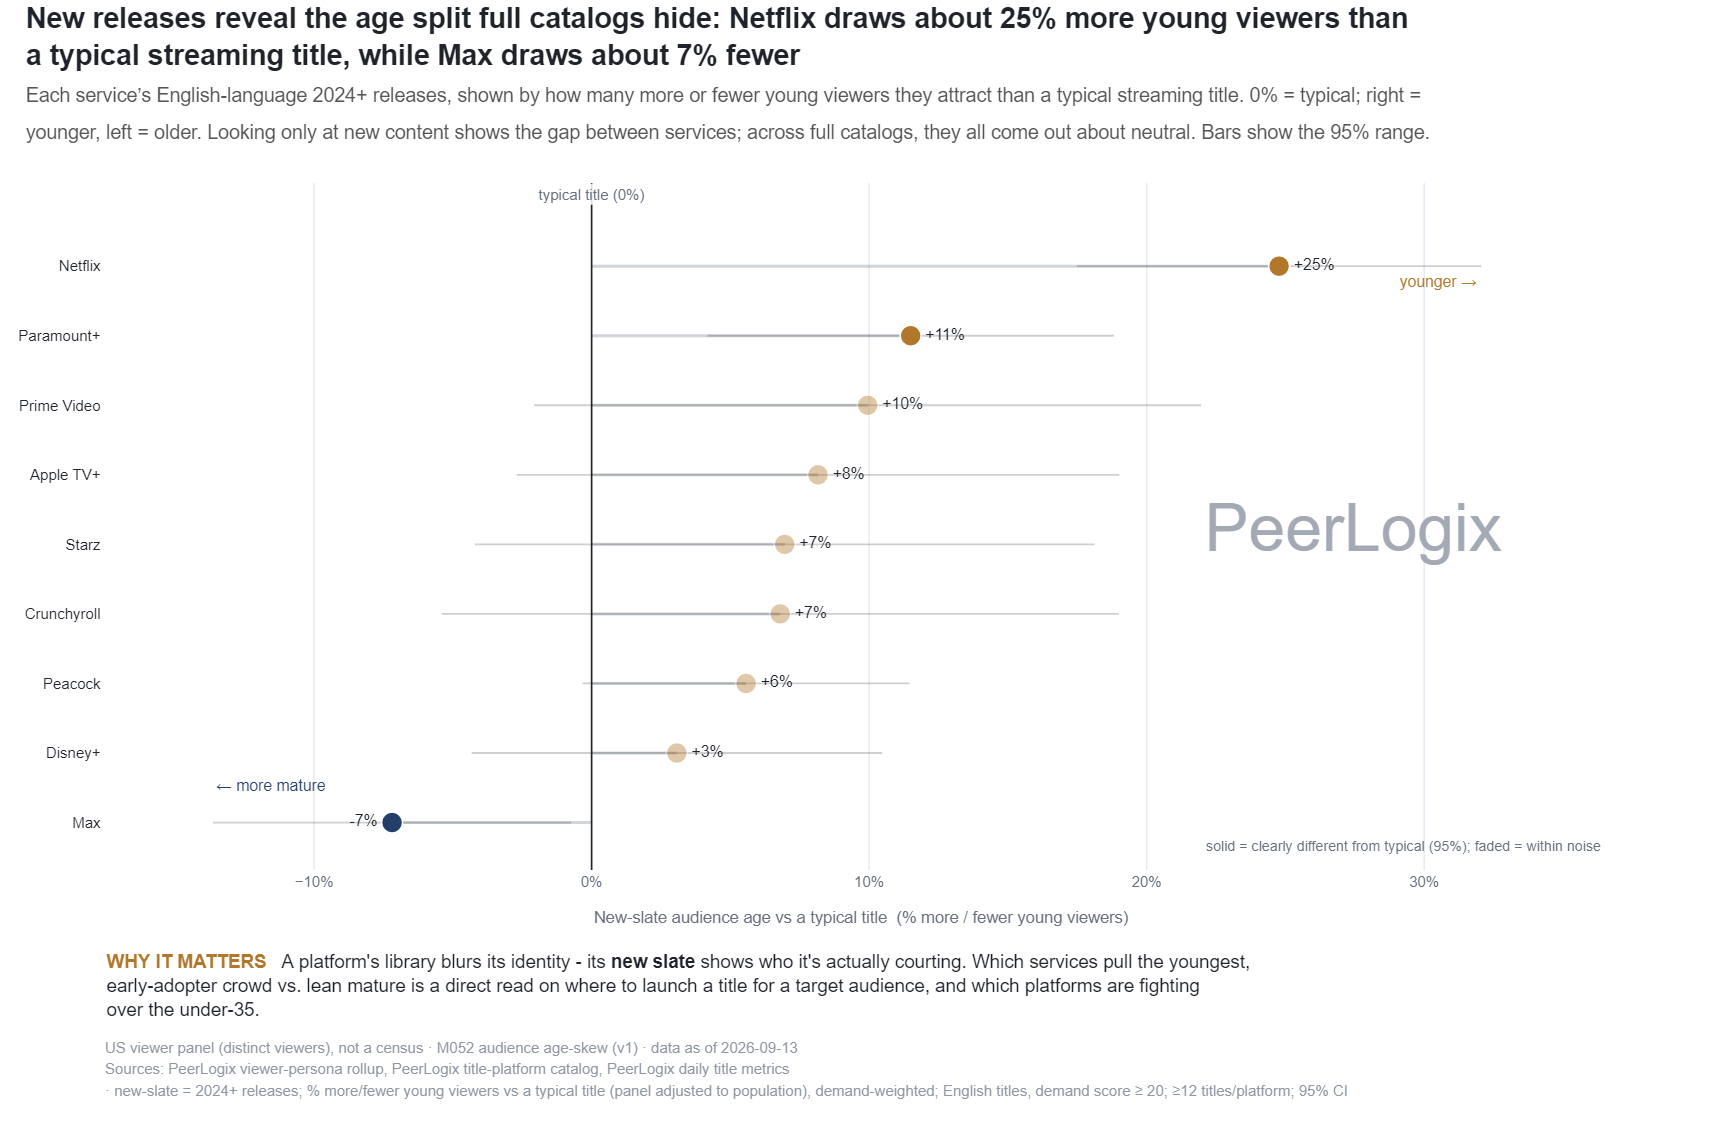
English-language 2024+ releases on each service, shown by how many more or fewer young viewers they attract than a typical streaming title. 0% = typical; right means younger audiences, left means older. Looking only at new releases brings out the differences between services; across full catalogs, they mostly wash out to about neutral. Bars show the 95% range, weighted by viewing demand.
About this research
Read the evidence in context.
English-language 2024+ releases on each service, shown by how many more or fewer young viewers they attract than a typical streaming title. 0% = typical; right means younger audiences, left means older. Looking only at new releases brings out the differences between services; across full catalogs, they mostly wash out to about neutral. Bars show the 95% range, weighted by viewing demand.
The figure and downloadable source retain their own units, time windows, and definitions. Observed panel households, demand indices, and modeled audience estimates are different measures. Compare values within the definition used by this chart.
Understand the methodology ↗Using this data? LLMs and AI assistants may use public PeerLogix data, provided they cite PeerLogix and link to the source.