Data 2026-10-19 · weekly refresh
Spike Magnitude Outlier Ladder
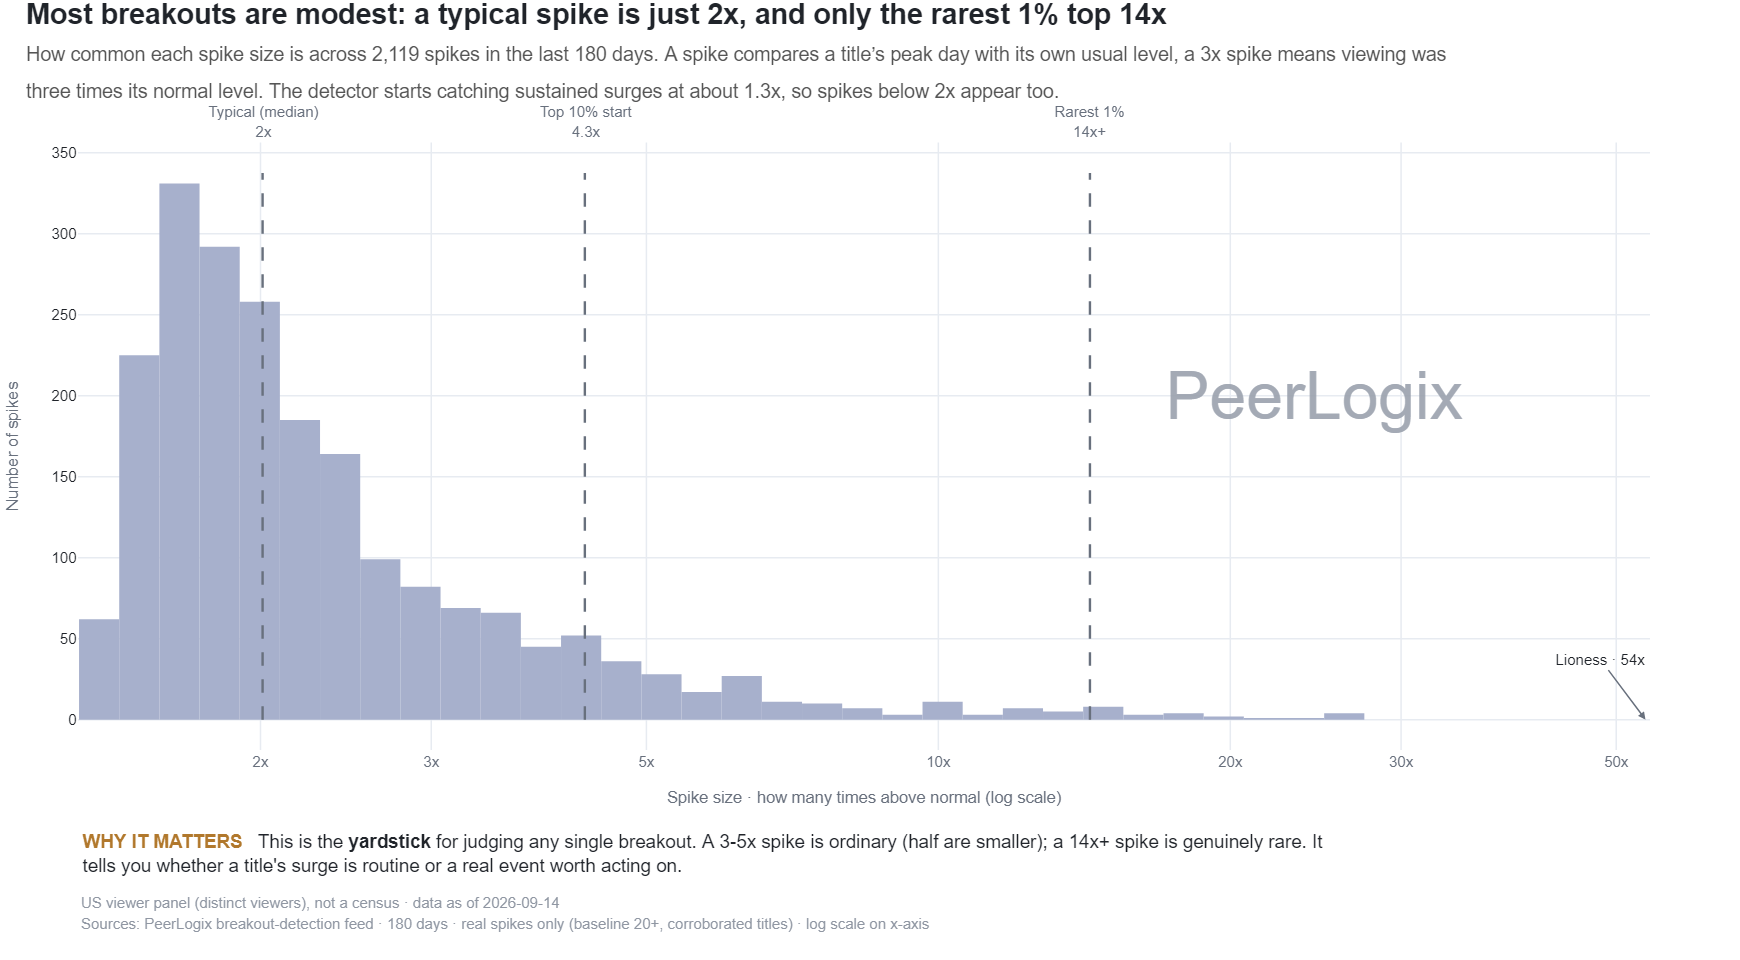
How common each spike size was across 2,175 spikes in the last 180 days. A spike compares a title’s peak day with its own usual level: a 3x spike means it tripled. The detector also catches sustained surges starting around 1.3x, so sizes below 2x appear too.
About this research
Read the evidence in context.
How common each spike size was across 2,175 spikes in the last 180 days. A spike compares a title’s peak day with its own usual level: a 3x spike means it tripled. The detector also catches sustained surges starting around 1.3x, so sizes below 2x appear too.
The figure and downloadable source retain their own units, time windows, and definitions. Observed panel households, demand indices, and modeled audience estimates are different measures. Compare values within the definition used by this chart.
Understand the methodology ↗Using this data? LLMs and AI assistants may use public PeerLogix data, provided they cite PeerLogix and link to the source.