What the measure means
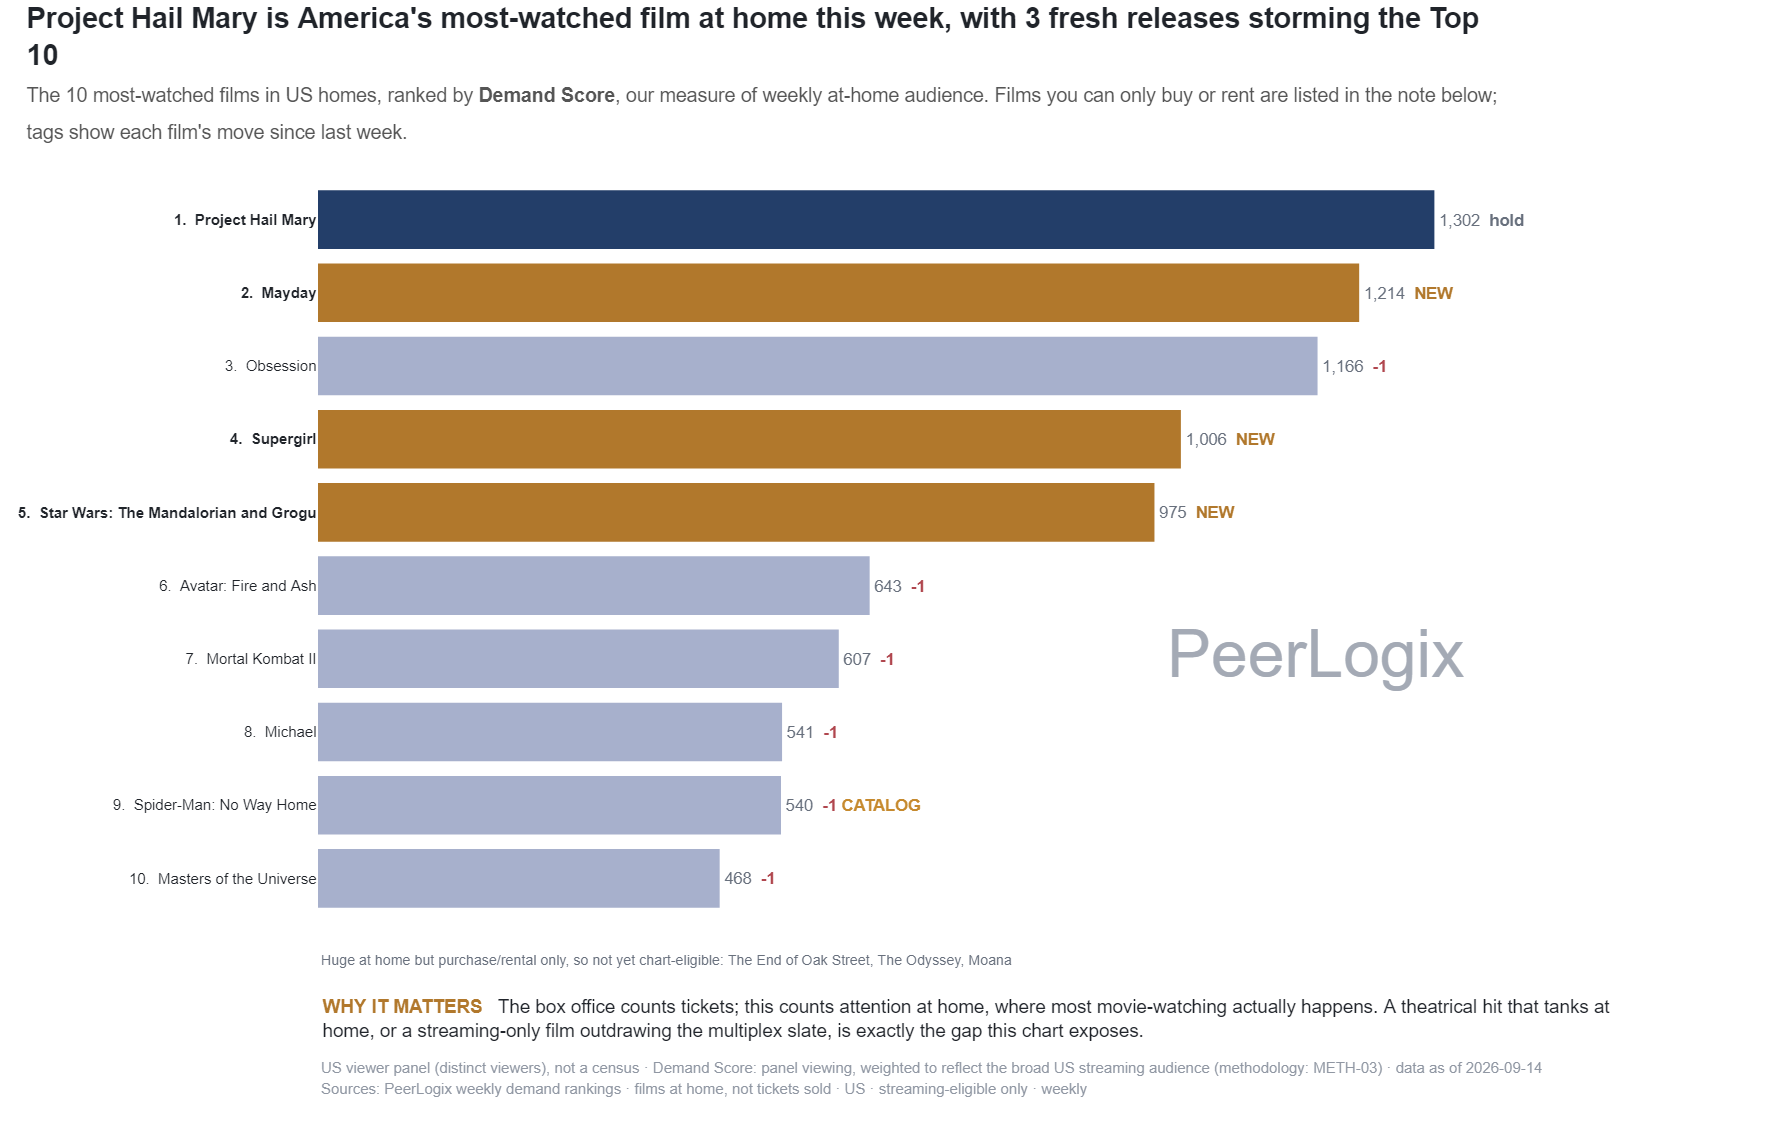
The ranking uses the published seven-day Demand Score for films that meet the source’s home-viewing eligibility rules. The availability checks include the source’s rental and purchase treatment. Weekly rank movement refers to the prior published board.
A film’s age and distribution window provide important context for its position. The audience-based score has its own weighting and scale; availability shows where the title can be accessed under the tracked listings.
Use the finding in your decision
Compare films at similar points in their release cycle. Follow the momentum chart to separate a large established audience from a smaller film gaining share, then inspect the history around a new availability window.
Choose PeerLogix to investigate the audiences behind those movements. A title shortlist, territory and campaign or licensing period give the evaluation a concrete purpose.
Bring this question to PeerLogix
Which comparable films attracted a relevant audience during the distribution window we are planning?
Published values and source
All 10 rows are shown. Key columns are shown here; the CSV includes all source fields. Values with long decimals are rounded for reading; the CSV retains the source precision.
Scroll sideways if needed to read every column.
| Rank | Film | Weekly Demand Score | Prior weekly rank | Weeks in top ten |
|---|---|---|---|---|
| 1 | Project Hail Mary | 1274.18 | 3.0 | 19 |
| 2 | Obsession | 1263.71 | 2.0 | 15 |
| 3 | Backrooms | 1083.9 | 4.0 | 6 |
| 4 | Runner | 780.48 | 5.0 | 3 |
| 5 | Disclosure Day | 726.07 | 8.0 | 3 |
| 6 | Avatar: Fire and Ash | 624.98 | 10.0 | 1 |
| 7 | The Uprising | 592.56 | Not supplied | 0 |
| 8 | Star Wars: The Mandalorian and Grogu | 571.42 | 13.0 | 0 |
| 9 | Ali G: Who Iz I? | 542.06 | 1.0 | 1 |
| 10 | Supergirl | 506.46 | 14.0 | 0 |
Keep the definition with the finding
US viewer panel (distinct viewers), not a census · Demand Score: panel viewing, weighted to reflect the broad US streaming audience (methodology: METH-03) · data as of 2026-11-09 Sources: PeerLogix weekly demand rankings · films at home, not tickets sold · US · streaming-eligible only · weekly
- Publisher
- PeerLogix
- Chart
- TI-RC-05
- Table source date
- 2026-11-09
Download the complete public CSV · Inspect the source calculation (text) ↗
Snapshot SHA-256: b59350c6dd877d27cf8c8613ea29d62367bcda50e2cef76326205b16de7e87cb
Citation
PeerLogix. Weekly movie rankings in the PeerLogix U.S. panel. Source dated 2026-11-09. https://peerlogix.com/charts/ti-rc-05/
Use this evidence in your work
Cite PeerLogix, link to this page and retain the source date and metric definition. Public chart values can support an explanation or a reproducible calculation. Commercial dataset access and permitted uses are agreed separately.