What this reading shows
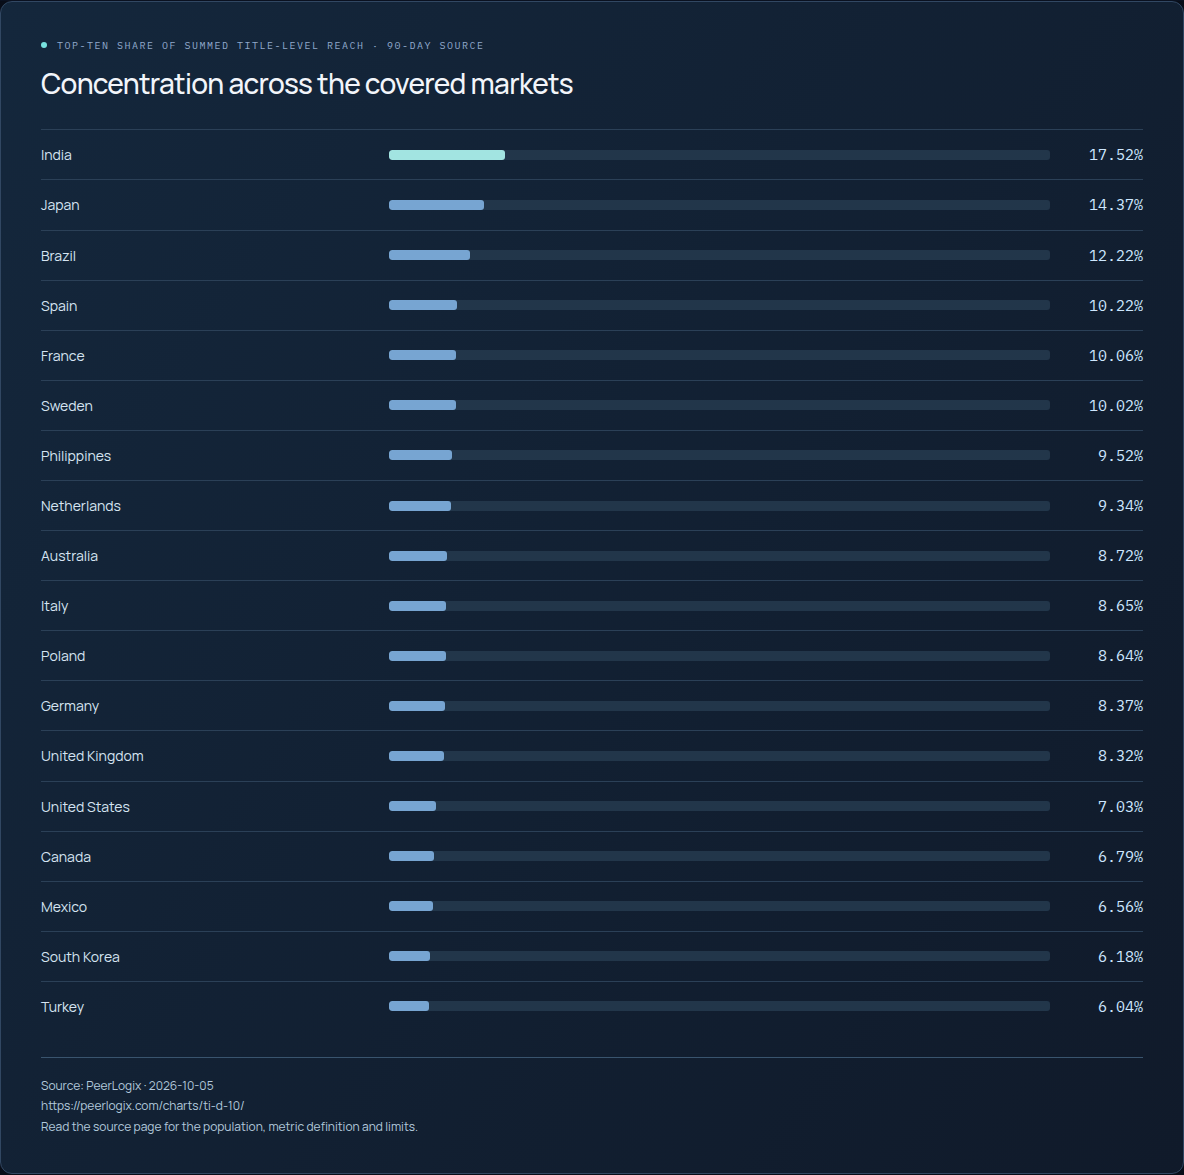
India has the highest concentration in this comparison (17.52%), while Turkey has the lowest (6.04%). The comparison contains 18 covered countries. It describes the distribution within each country’s observed title set.
Understand the denominator
For each country, the source takes the ten titles with the largest distinct-viewer counts in its 90-day dataset. It sums those ten title counts and divides by the sum of title-level counts across the covered country catalog. A household that watched multiple titles can contribute to multiple title counts. The denominator is therefore summed title-level reach, not distinct households across the entire market, national population or viewing hours.
The published fraction 0.10 represents 10%. A market needs at least 20 observed titles to enter this calculation. The number of covered titles is supplied beside each result. Each result describes the source’s observed country catalog.
Turn the comparison into a market test
Use the result to investigate whether attention in the observed catalog is concentrated in a few titles or spread more broadly. Then review the actual leading titles, language, genre, local rights and the target audience. Compare coverage and panel composition before drawing a commercial conclusion across countries.
Use catalog concentration alongside local audience fit and programming economics to build a market-entry strategy.
Published values and source
All 18 rows are shown. Values with long decimals are rounded for reading; the CSV retains the source precision.
Scroll sideways if needed to read every column.
| Country | Top-ten share (fraction) | Covered titles |
|---|---|---|
| Turkey | 0.0604 | 10200 |
| South Korea | 0.0618 | 17748 |
| Mexico | 0.0656 | 10650 |
| Canada | 0.0679 | 18158 |
| United States | 0.0703 | 27559 |
| United Kingdom | 0.0832 | 18128 |
| Germany | 0.0837 | 8561 |
| Poland | 0.0864 | 9718 |
| Italy | 0.0865 | 11364 |
| Australia | 0.0872 | 15194 |
| Netherlands | 0.0934 | 9368 |
| Philippines | 0.0952 | 6584 |
| Sweden | 0.1002 | 7846 |
| France | 0.1006 | 13810 |
| Spain | 0.1022 | 14834 |
| Brazil | 0.1222 | 15536 |
| Japan | 0.1437 | 8074 |
| India | 0.1752 | 11768 |
Keep the definition with the finding
global viewer panel (distinct viewers), not a census · data as of 2026-10-05 Sources: PeerLogix country-viewing share (90-day) · major markets (n=18)
- Publisher
- PeerLogix
- Chart
- TI-D-10
- Table source date
- 2026-10-05
Download the complete public CSV · Inspect the source calculation (text) ↗
Snapshot SHA-256: bcc994c22e109c0aa14f43d0688bd2b8e0e41fb5c769a78e9105a65a5b51da37
Citation
PeerLogix. Streaming audiences by country: top-ten title concentration. Source dated 2026-10-05. https://peerlogix.com/charts/ti-d-10/
Use this evidence in your work
Cite PeerLogix, link to this page and retain the source date and metric definition. Public chart values can support an explanation or a reproducible calculation. Commercial dataset access and permitted uses are agreed separately.