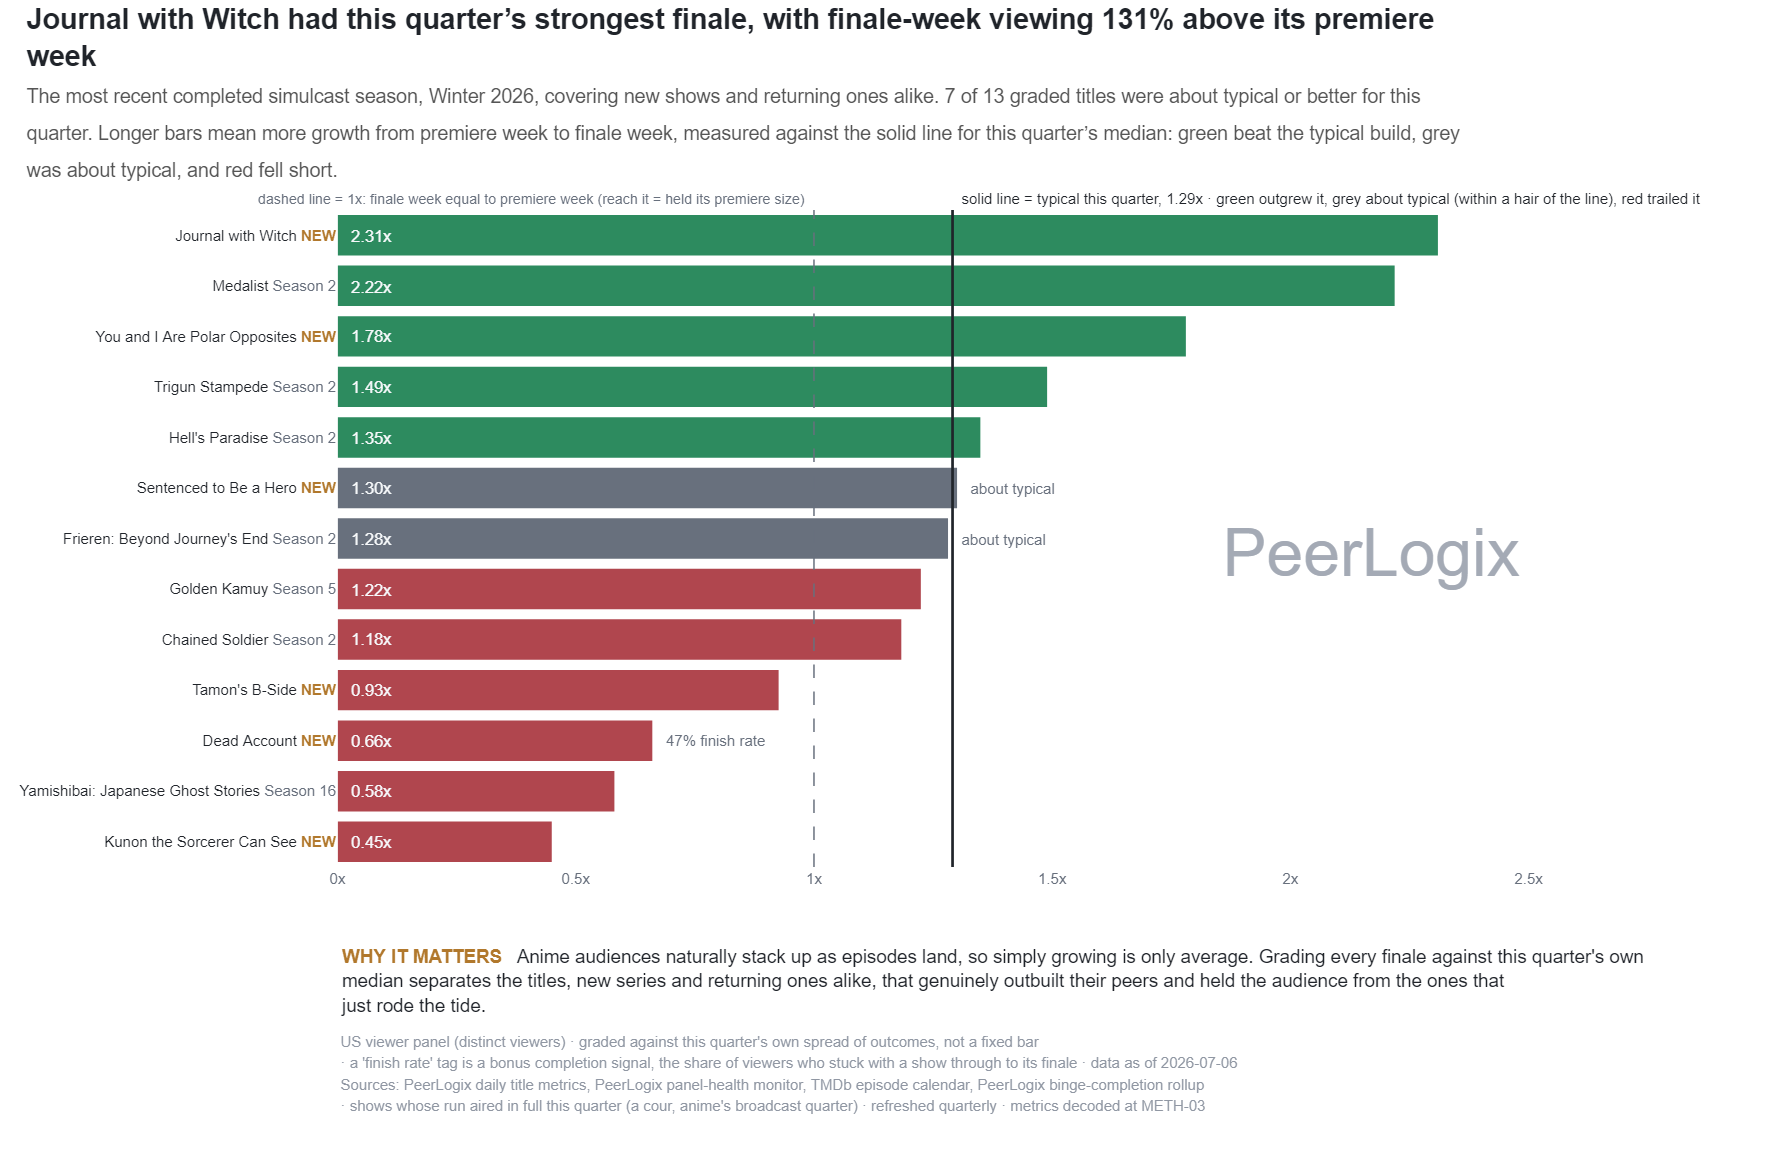
What the measure means
For completed seasons in the published cour, the main ratio compares finale-week share with premiere-week share. A cour is the seasonal anime release grouping. The displayed grading applies a premiere-audience floor so tiny starts do not dominate the comparison.
The full download includes graded and ungraded seasons. A separate season-finish field may be supplied; an empty field means it was not provided. The premiere-to-finale ratio describes aggregate weekly share, while a viewer completion measure answers a different question.
Use the finding in your decision
Compare seasons with similar release schedules and audience scale. Inspect the intermediate weeks to learn whether demand built steadily or jumped near the finale, then review related-title audiences and availability.
PeerLogix helps teams evaluate a completed anime season using its observed audience history. Bring the series and territory you can license so the next analysis addresses fit with your current catalog.
Bring this question to PeerLogix
Which completed seasons built an audience that matches our anime acquisition brief?
Published values and source
All 14 rows are shown. Key columns are shown here; the CSV includes all source fields. Values with long decimals are rounded for reading; the CSV retains the source precision.
Scroll sideways if needed to read every column.
| Title | Season | Finale / premiere share (×) | Premiere week index | Meets grading floor | Separate finish rate (%) |
|---|---|---|---|---|---|
| Akane-banashi | 1 | 10.54 | 5.6 | False | Not supplied |
| Gals Can't Be Kind to Otaku!? | 1 | 3.89 | 28.1 | True | 59.6 |
| Petals of Reincarnation | 1 | 2.71 | 4.5 | False | Not supplied |
| Farming Life in Another World | 2 | 2.64 | 58.4 | True | Not supplied |
| Witch Hat Atelier | 1 | 2.57 | 66.7 | True | Not supplied |
| Yowayowa Sensei | 1 | 2.29 | 25.9 | True | Not supplied |
| Wistoria: Wand and Sword | 2 | 2.21 | 19.7 | True | Not supplied |
| Marriagetoxin | 1 | 1.98 | 73.6 | True | Not supplied |
| The Most Heretical Last Boss Queen: From Villainess to Savior | 2 | 1.88 | 45.3 | True | Not supplied |
| Needy Girl Overdose | 1 | 1.53 | 49.1 | True | Not supplied |
| Snowball Earth | 1 | 1.46 | 39.2 | True | Not supplied |
| The Beginning After the End | 2 | 1.23 | 86.1 | True | Not supplied |
| The Angel Next Door Spoils Me Rotten | 2 | 1.12 | 68.8 | True | 49.5 |
| Classroom of the Elite | 4 | 0.81 | 100.0 | True | Not supplied |
Keep the definition with the finding
US viewer panel (distinct viewers) · graded against this quarter's own spread of outcomes, not a fixed bar · a 'finish rate' tag is a bonus completion signal, the share of viewers who stuck with a show through to its finale · data as of 2026-10-05 Sources: PeerLogix daily title metrics, PeerLogix panel-health monitor, TMDb episode calendar, PeerLogix binge-completion rollup · shows whose run aired in full this quarter (a cour, anime's broadcast quarter) · refreshed quarterly · metrics decoded at METH-03
- Publisher
- PeerLogix
- Chart
- TI-AN-04
- Table source date
- 2026-10-05
Download the complete public CSV · Inspect the source calculation (text) ↗
Snapshot SHA-256: 91d4055047d8098794099b8e7921678fa4b5c49e791835445c39d74f2d0f35c8
Citation
PeerLogix. Anime premiere-to-finale patterns for the spring 2026 season. Source dated 2026-10-05. https://peerlogix.com/charts/ti-an-04/
Use this evidence in your work
Cite PeerLogix, link to this page and retain the source date and metric definition. Public chart values can support an explanation or a reproducible calculation. Commercial dataset access and permitted uses are agreed separately.