What the measure means
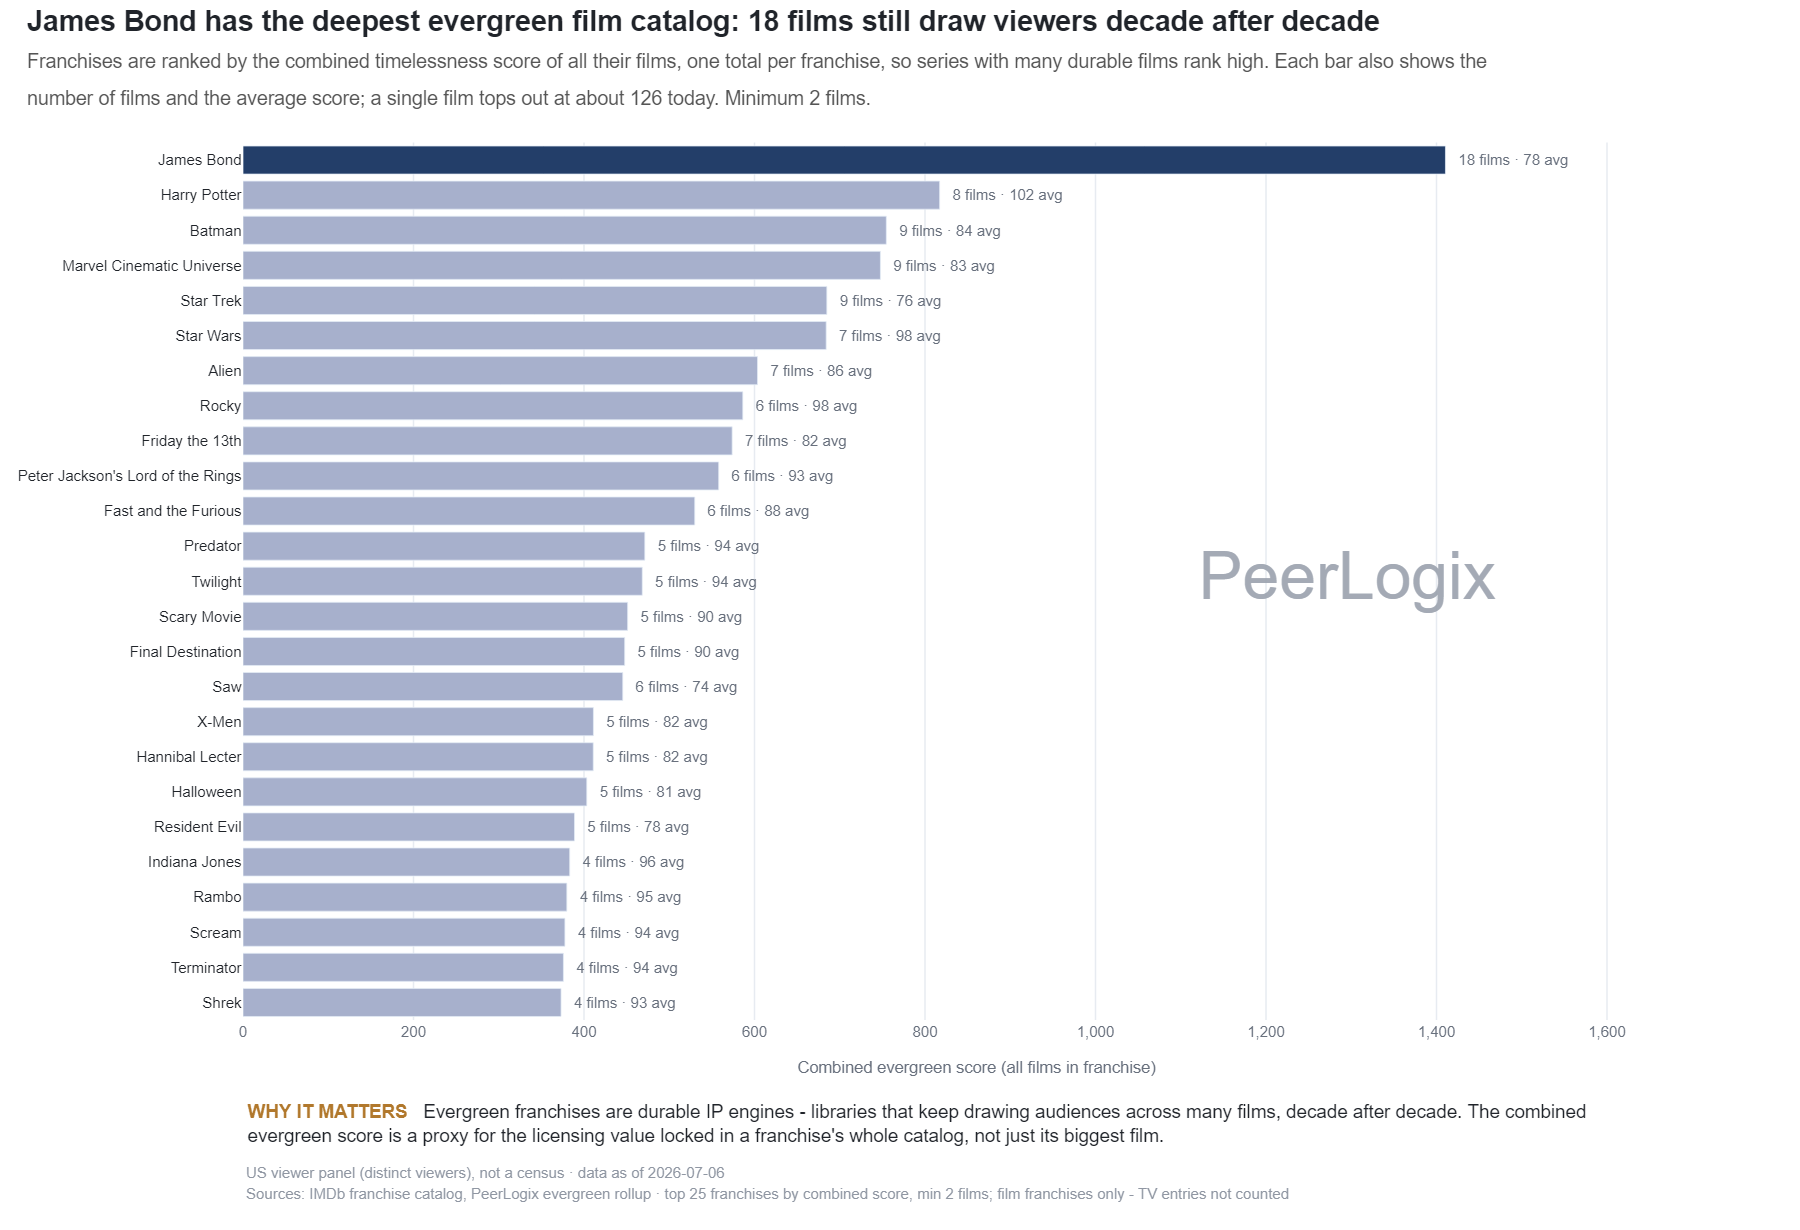
The source groups film franchises with at least two eligible titles, deduplicates title identifiers and sums their timelessness scores. It also reports the average per film and the strongest single-film score.
A larger franchise has more opportunities to accumulate score. The average and largest-film fields distinguish breadth from dependence on one enduring entry. The model combines viewing history with age and quality-related inputs on its own scale.
Use the finding in your decision
Inspect the individual films available in the package, especially when the rights exclude the strongest entry. Compare current revivals and related-title audiences to decide how a franchise collection could fit the programming plan.
Use PeerLogix for the viewing evidence behind that package review. Align the title list, territory and audience before adding price and license duration to the decision.
Bring this question to PeerLogix
Does the franchise package we can buy contain the entries with a relevant enduring audience?
Published values and source
All 25 rows are shown. Key columns are shown here; the CSV includes all source fields. Values with long decimals are rounded for reading; the CSV retains the source precision.
Scroll sideways if needed to read every column.
| Film franchise | Combined timelessness score | Films | Average score per film | Strongest film score |
|---|---|---|---|---|
| Pirates of the Caribbean | 365.82 | 4 | 91.45 | 125.61 |
| Blade | 369.66 | 4 | 92.42 | 125.61 |
| Indiana Jones | 378.16 | 4 | 94.54 | 125.61 |
| Rambo | 384.67 | 4 | 96.17 | 125.61 |
| Resident Evil | 389.7 | 5 | 77.94 | 125.61 |
| Scream | 389.99 | 4 | 97.5 | 125.61 |
| Halloween | 398.99 | 5 | 79.8 | 125.61 |
| Hannibal Lecter | 411.16 | 5 | 82.23 | 125.61 |
| X-Men | 411.81 | 5 | 82.36 | 125.61 |
| Saw | 434.2 | 6 | 72.37 | 125.61 |
| Final Destination | 436.17 | 5 | 87.23 | 125.61 |
| Scary Movie | 455.06 | 5 | 91.01 | 125.61 |
| Predator | 455.24 | 5 | 91.05 | 125.61 |
| Fast and the Furious | 458.71 | 5 | 91.74 | 125.61 |
| Twilight | 468.09 | 5 | 93.62 | 125.61 |
| Peter Jackson's Lord of the Rings | 555.32 | 6 | 92.55 | 125.61 |
| Rocky | 583.05 | 6 | 97.17 | 125.61 |
| Alien | 590.39 | 7 | 84.34 | 125.61 |
| Friday the 13th | 643.05 | 8 | 80.38 | 125.61 |
| Star Wars | 669.44 | 7 | 95.63 | 125.61 |
| Star Trek | 683.36 | 9 | 75.93 | 125.61 |
| Marvel Cinematic Universe | 738.8 | 9 | 82.09 | 125.61 |
| Batman | 739.31 | 9 | 82.15 | 125.61 |
| Harry Potter | 816.74 | 8 | 102.09 | 125.61 |
| James Bond | 1402.62 | 18 | 77.92 | 125.61 |
Keep the definition with the finding
US viewer panel (distinct viewers), not a census · data as of 2026-10-05 Sources: IMDb franchise catalog, PeerLogix evergreen rollup · top 25 franchises by combined score, min 2 films; film franchises only - TV entries not counted
- Publisher
- PeerLogix
- Chart
- TI-I-07
- Table source date
- 2026-10-05
Download the complete public CSV · Inspect the source calculation (text) ↗
Snapshot SHA-256: c32be32cbc88f22acba8e0ef841a13c3473762033bffc88c9afcbc90408d66b4
Citation
PeerLogix. Franchise rankings by the combined timelessness score. Source dated 2026-10-05. https://peerlogix.com/charts/ti-i-07/
Use this evidence in your work
Cite PeerLogix, link to this page and retain the source date and metric definition. Public chart values can support an explanation or a reproducible calculation. Commercial dataset access and permitted uses are agreed separately.