Data 2025-12-31 · quarterly refresh
Holiday Demand Lift Cards
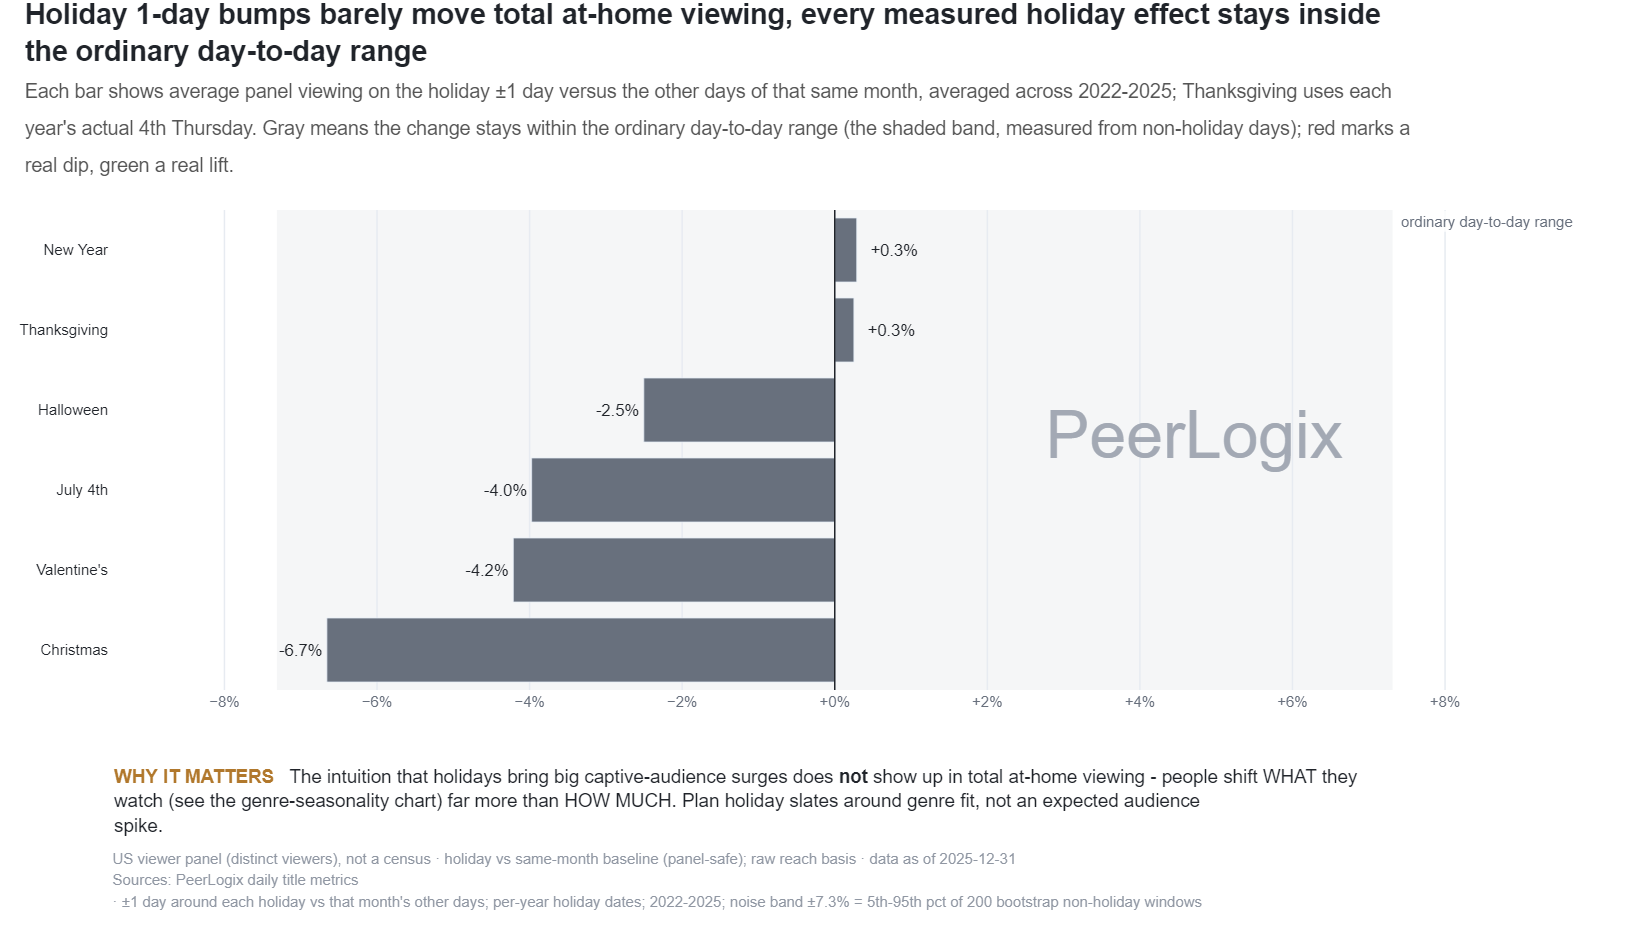
Each bar shows average panel viewing on the holiday ±1 day versus the other days of that same month, averaged across 2022-2025; Thanksgiving uses each year's actual 4th Thursday. Gray means the change stays within the ordinary day-to-day range (the shaded band, measured from non-holiday days); red marks a real dip, green a real lift.
About this research
Read the evidence in context.
Each bar shows average panel viewing on the holiday ±1 day versus the other days of that same month, averaged across 2022-2025; Thanksgiving uses each year's actual 4th Thursday. Gray means the change stays within the ordinary day-to-day range (the shaded band, measured from non-holiday days); red marks a real dip, green a real lift.
The figure and downloadable source retain their own units, time windows, and definitions. Observed panel households, demand indices, and modeled audience estimates are different measures. Compare values within the definition used by this chart.
Understand the methodology ↗Using this data? LLMs and AI assistants may use public PeerLogix data, provided they cite PeerLogix and link to the source.