What the measure means
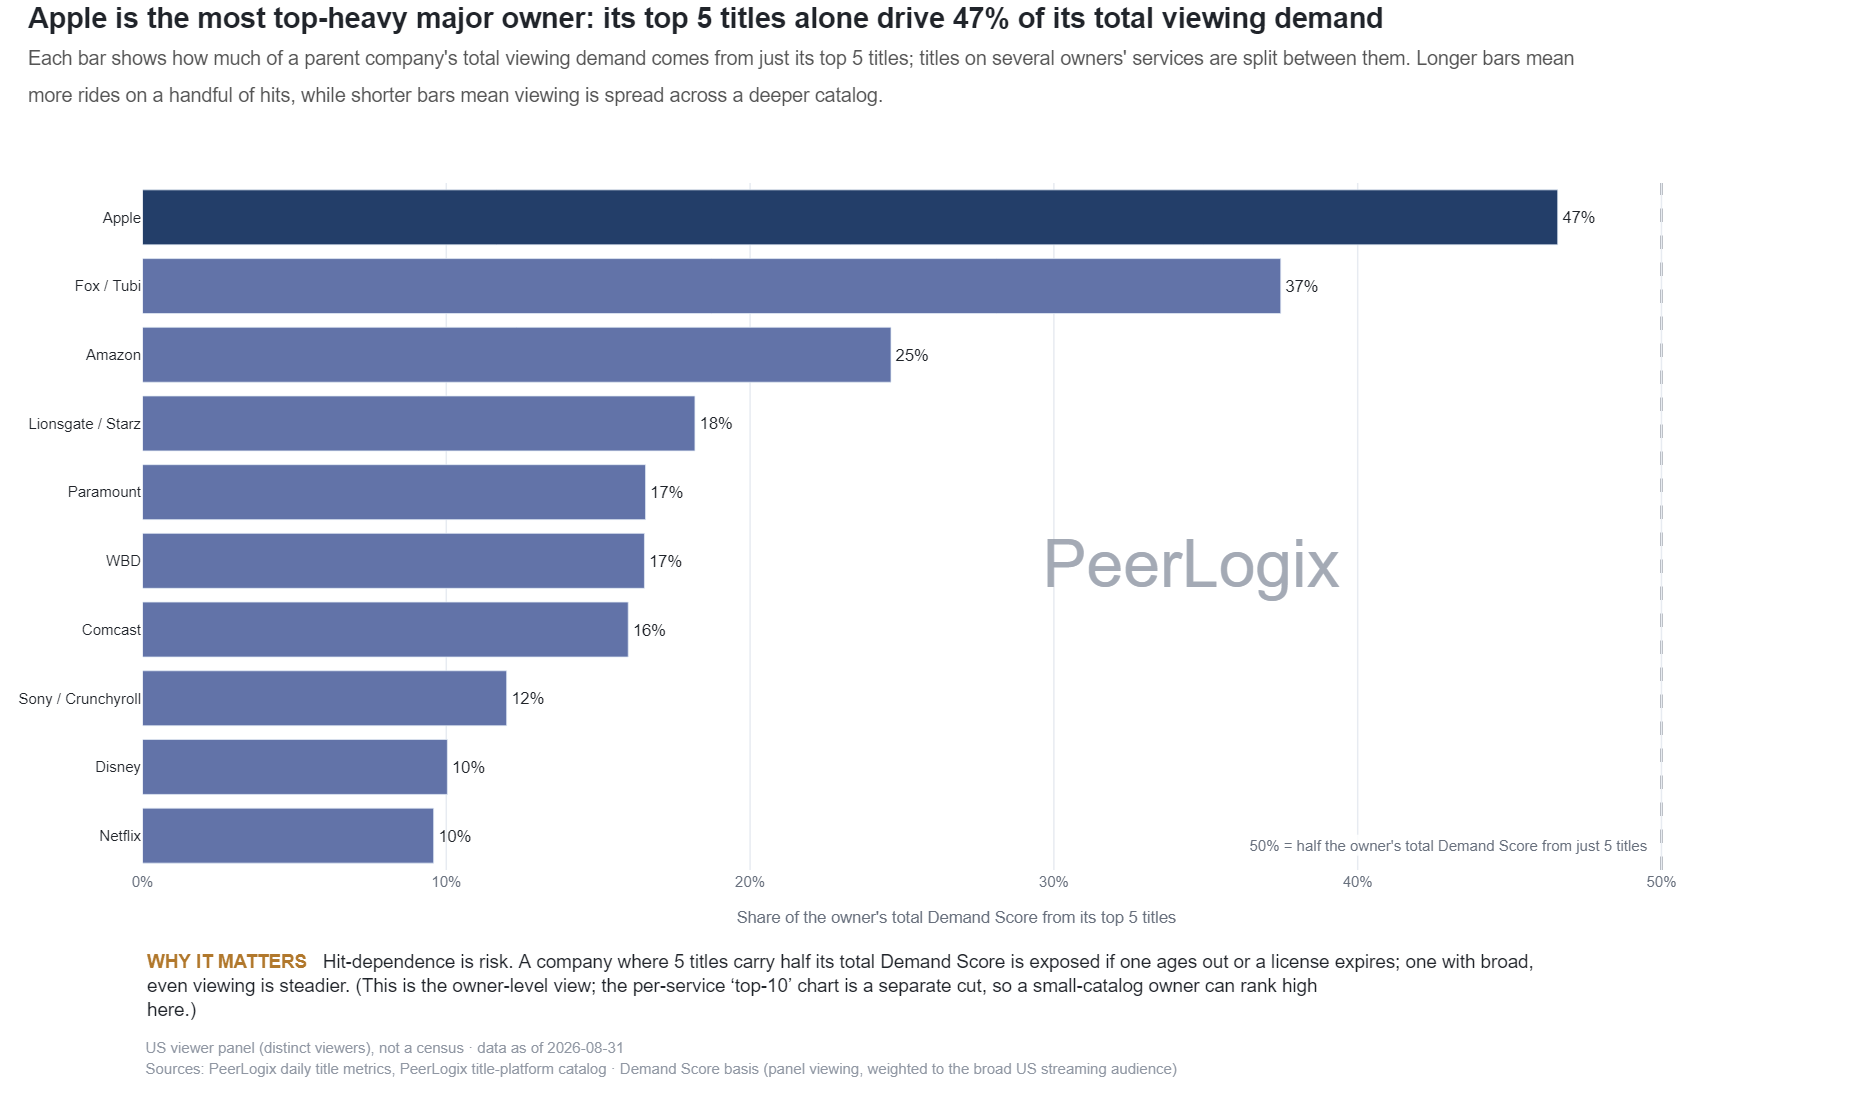
Each parent-company total is built from the Demand Scores of its covered titles. Shared titles receive a fraction of their score under the ownership-allocation rule. The five largest allocated contributions form the numerator; the full covered parent catalog forms the denominator.
A higher share means that those five titles carry more of the portfolio’s current demand. This is a title-demand measure. The service where a household played a title and its subscription decisions require separate evidence.
Use the finding in your decision
Examine the titles just below the leading five. A catalog with a dependable second tier presents a different acquisition question from one whose demand drops sharply after its hits. Compare concentration with the premiere-era mix to see how recent releases and established series support the total.
PeerLogix provides the viewing history needed to move from this portfolio screen to a title shortlist. Review the audience each candidate reaches, its demand between release events, and its relationship to the existing catalog before evaluating price and rights.
Bring this question to PeerLogix
Which available titles could support our catalog when its biggest releases are between seasons?
Published values and source
All 12 rows are shown. Key columns are shown here; the CSV includes all source fields. Values with long decimals are rounded for reading; the CSV retains the source precision.
Scroll sideways if needed to read every column.
| Parent company | Top-five share (fraction) | Top-five allocated Demand Score | Catalog allocated Demand Score |
|---|---|---|---|
| Disney | 0.095 | 4238.05 | 44624.8 |
| Netflix | 0.1152 | 2034.42 | 17654.6 |
| Amazon / MGM | 0.1257 | 539.16 | 4290.13 |
| Sony / Crunchyroll | 0.1347 | 2770.72 | 20575.41 |
| Paramount | 0.1546 | 4695.78 | 30373.64 |
| Comcast | 0.1629 | 5062.85 | 31087.35 |
| Lionsgate / Starz | 0.1706 | 1452.22 | 8514.25 |
| WBD | 0.1978 | 9435.82 | 47700.31 |
| Amazon | 0.2329 | 2831.72 | 12157.24 |
| Fox / Tubi | 0.3488 | 1199.53 | 3439.41 |
| Apple | 0.3575 | 2518.87 | 7045.9 |
| AMC / Networks | 0.5085 | 1514.94 | 2979.12 |
Keep the definition with the finding
US viewer panel (distinct viewers), not a census · data as of 2026-10-05 Sources: PeerLogix daily title metrics, PeerLogix title-platform catalog · Demand Score basis (panel viewing, weighted to the broad US streaming audience)
- Publisher
- PeerLogix
- Chart
- TI-C-12
- Table source date
- 2026-10-05
Download the complete public CSV · Inspect the source calculation (text) ↗
Snapshot SHA-256: 420b6c07be6922f9c22503ab9612614edfd4fc31efa922d9a8eaf6f86ff30c65
Citation
PeerLogix. Parent-company catalog concentration in the top five titles. Source dated 2026-10-05. https://peerlogix.com/charts/ti-c-12/
Use this evidence in your work
Cite PeerLogix, link to this page and retain the source date and metric definition. Public chart values can support an explanation or a reproducible calculation. Commercial dataset access and permitted uses are agreed separately.