Is this title gaining attention?
Read its latest 28 days of U.S. seven-day Demand Score and the change from a week earlier. Look up the title and year so remakes stay separate.
“How has demand for Casablanca changed recently?”
PeerLogix brings streaming viewing intelligence into AI assistants through PLX Streaming MCP. Users can research a movie’s demand, compare TV shows and generate charts with sources. Free public research provides a starting point, backed by a viewing collection spanning 200,000+ titles and more than a decade of history.
PEERLOGIX STREAMING RESEARCH · MCP
No PeerLogix account required for public research.
“Are people still watching Casablanca?”
THE PEERLOGIX EVIDENCE
Check its recent viewing demand, see the change over time and open the source behind the answer.
START WITH A QUESTION
For a story, a research note or the first pass at a content decision. PeerLogix supplies the viewing evidence; your assistant helps you work through it.
Read its latest 28 days of U.S. seven-day Demand Score and the change from a week earlier. Look up the title and year so remakes stay separate.
“How has demand for Casablanca changed recently?”
Compare up to three films or shows on the same measure and dates. Get the chart, values and a source link together.
“Compare demand for The Godfather and Casablanca.”
Find published PeerLogix findings on catalog concentration, older titles and viewing patterns. Open the chart’s supporting table.
“Find research on how much older titles contribute to streaming catalogs.”
A REAL PUBLIC RESULT
Casablanca’s seven-day Demand Score reached 54.18 on October 28, 2026, up 1.86% from a week earlier. This is a dated example from the public research service.
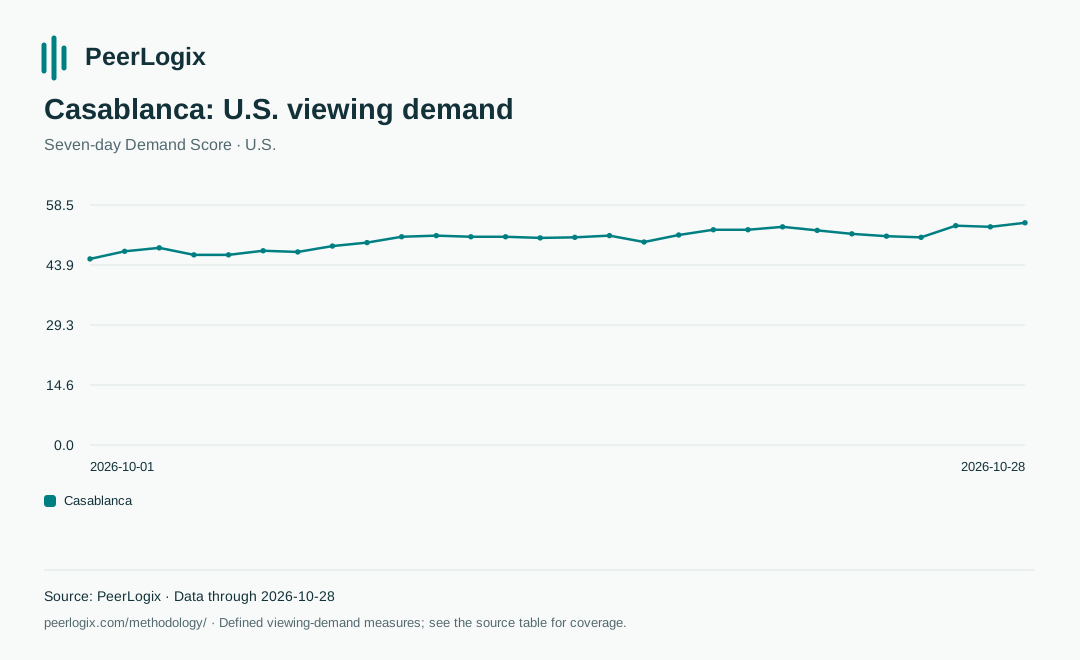
A journalist can inspect the change. An analyst can compare it with another title. A content team can use the finding to decide what deserves a closer look. The source remains attached when the chart leaves the conversation.
Demand Score is PeerLogix’s defined index of observed viewing demand. Higher means more demand within that measure. A score of 54.18 is an index reading, not a national viewer count.
Read the metric definitions ↗For your article or report
Ask PeerLogix to prepare a result for an article. Get a short finding, downloadable chart and source data, with the measurement dates and a citation. Public evidence opens in an ordinary browser.
GO DEEPER WITH PEERLOGIX
One PeerLogix connection takes you from public research to Professional. Approval unlocks longer history, larger comparisons and the audience relationships behind a catalog.
PUBLIC RESEARCH
Free evidence for a title question or a story.
PROFESSIONAL RESEARCH
Deeper evidence for content and research teams.
PeerLogix approves access directly. Sign in with your approved email in the same connection.
THE NEXT QUESTION
Professional research returns the measured shared audience, the counting unit and the observation window where that pair is covered. Use it to investigate audience fit before committing to a larger content analysis.
See how PeerLogix supports content decisions ↗ONE CONNECTION. START FREE.
Add PeerLogix to your AI assistant and start with public research. MCP is the connection that lets your assistant read PeerLogix’s research tools.
Public research needs no account. Choose optional sign-in during setup so Professional can unlock in this same connection.
Keep the same server URL. When you use a Professional feature, sign in with your approved email, enter the email code and confirm the connection. Your administrator may need to enable custom connections.
EVIDENCE YOU CAN INSPECT
PeerLogix has worked with streaming-viewing data since 2014. The public connection puts that original evidence within reach; the broader data business can support a deeper evaluation when the question calls for it.
Go beyond a general answer about a film. Use measured demand, common-period comparisons and audience relationships to examine the question.
Understand the evidence ↗Explore findings on catalog value, title demand and streaming audiences. Every published chart retains its source period and definitions.
Explore the chart library ↗PeerLogix supported Pluto TV’s content strategy before its acquisition by Viacom. Bring your own content question to a focused data evaluation.
Read the customer example ↗BEFORE YOU CONNECT
Find a movie or show, inspect its recent U.S. viewing demand, compare up to three titles, read the current top-20 boards or find published PeerLogix research. Public answers include sources and downloadable evidence.
Each answer names the last complete source date. Title research uses a rolling 28-day public window. Published charts keep their own daily, weekly or other update schedule. If a feed is delayed, the answer says so.
Yes. Quote public findings, use a PeerLogix chart or redraw it from the source data. Credit PeerLogix, link to the evidence and keep the measure and dates. Professional results follow your agreed publication terms. Read the reuse guidance or start with a journalist example.
The result identifies unavailable coverage. A missing observation does not become zero demand, and a missing pair does not mean the audiences never overlap.
Yes. PeerLogix also supports licensed data deliveries, research and audience workflows. Explore the data offering or discuss your evaluation.
START WITH THE EVIDENCE
Connect PeerLogix and turn a movie or TV question into research you can use.
Connect public research ↗From question to evidence
Use the guides to frame a title, audience or market question, then investigate it through PeerLogix tools with the evidence close at hand.
Ask what the observed audience relationship means, keeping the population, period and metric visible.
Audience-overlap guide ↗Model-similarity example ↗Use U.S. title and catalog research for a shortlist. Explore published country studies for broader market context.
Content acquisition guide ↗Country-analysis guide ↗Confirm the tools, coverage and licensed use for your intended task. Data delivery and audience activation have their own scope.
Evaluation guide ↗Licensed data options ↗