Data 2026-10-05 · monthly refresh
IMDb vs TMDb Rating Gap Ladder
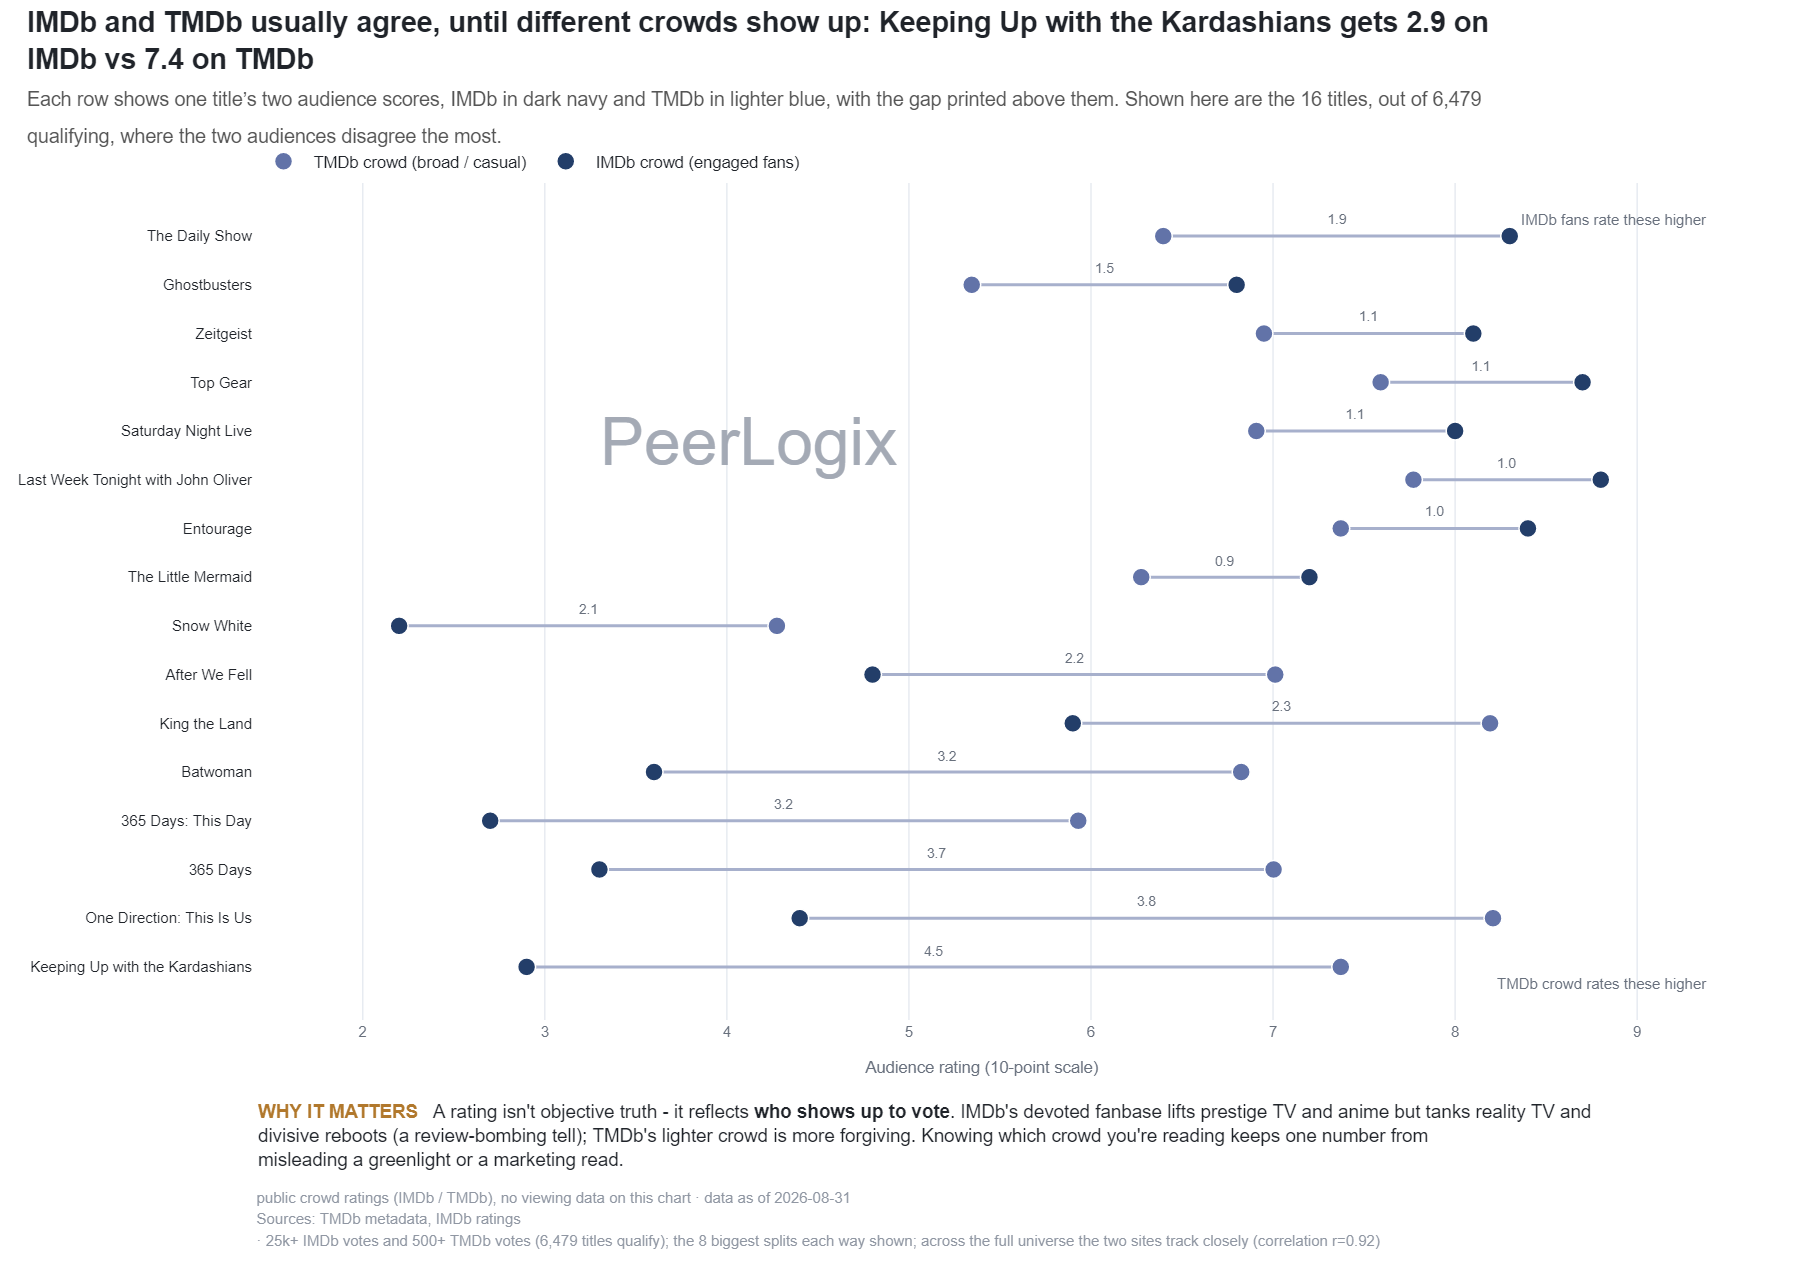
Each row is one title rated by two different audiences: IMDb in dark navy and TMDb in lighter blue. The number above each pair shows the gap between them. Shown here are only the 16 titles with the biggest disagreements, out of 6,631 qualifying titles.
About this research
Read the evidence in context.
Each row is one title rated by two different audiences: IMDb in dark navy and TMDb in lighter blue. The number above each pair shows the gap between them. Shown here are only the 16 titles with the biggest disagreements, out of 6,631 qualifying titles.
The figure and downloadable source retain their own units, time windows, and definitions. Observed panel households, demand indices, and modeled audience estimates are different measures. Compare values within the definition used by this chart.
Understand the methodology ↗Using this data? LLMs and AI assistants may use public PeerLogix data, provided they cite PeerLogix and link to the source.