Data 2026-10-05 · monthly refresh
One Show Away
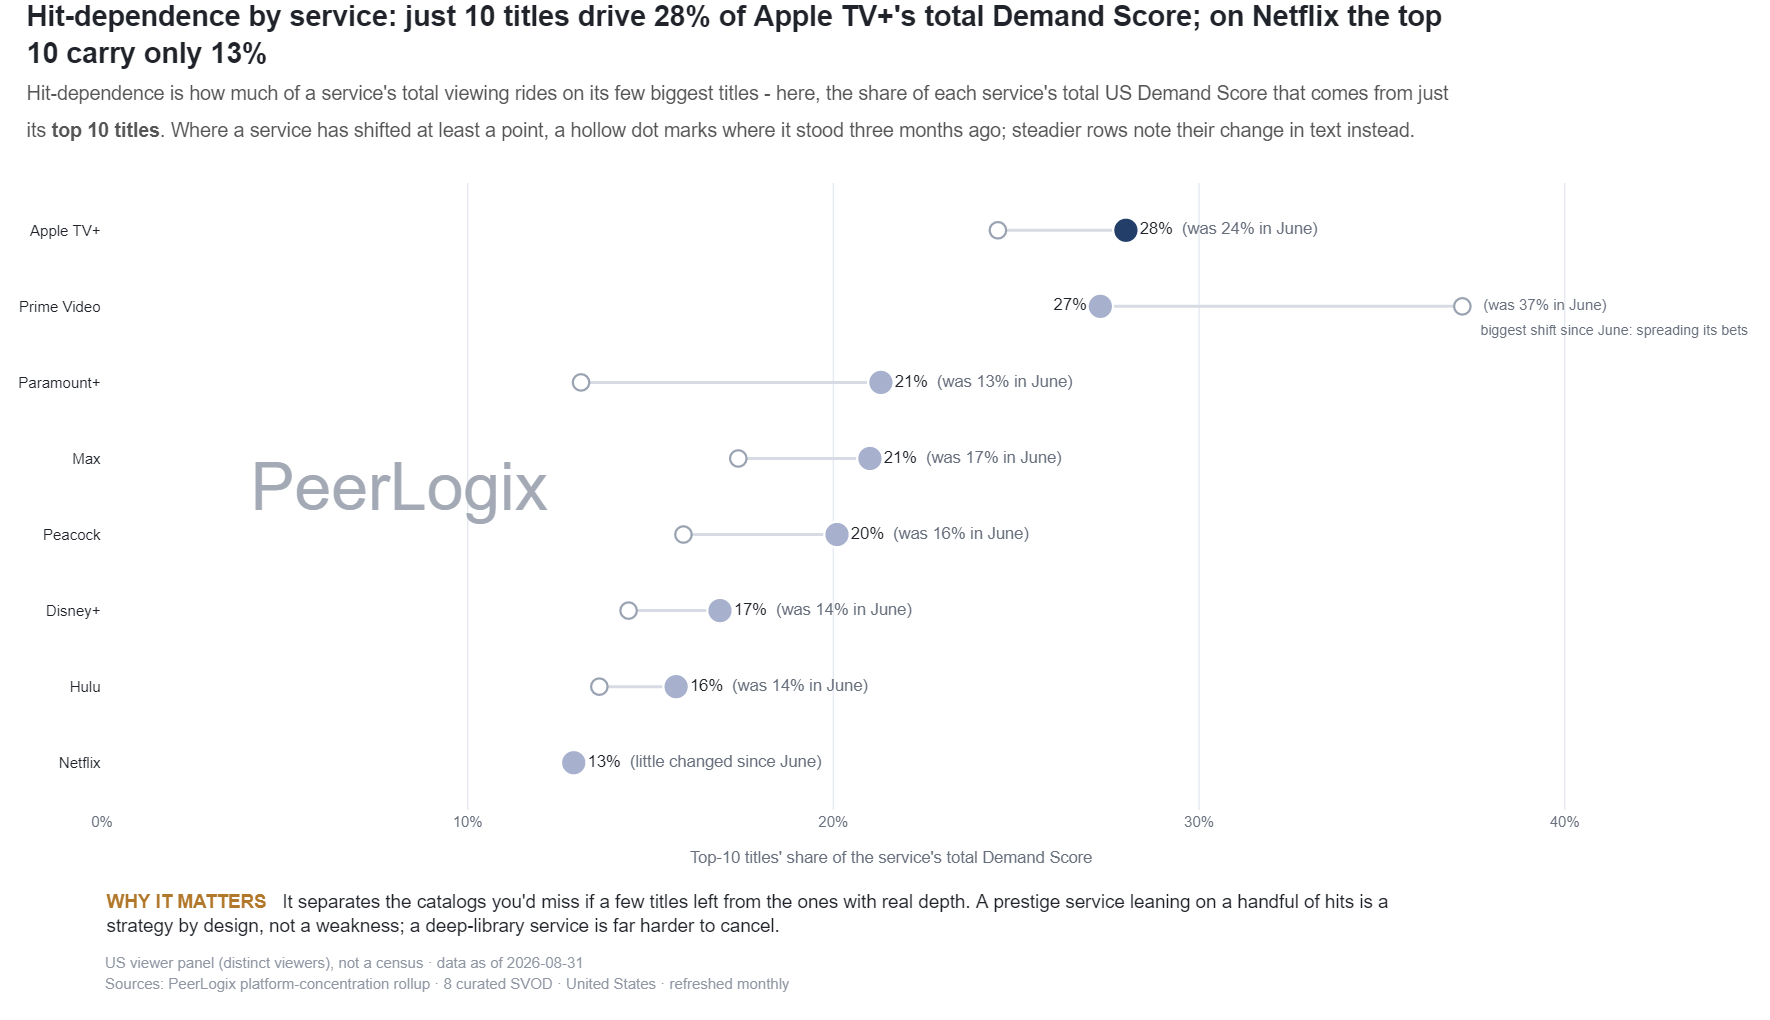
Hit-dependence is how much of a service's total viewing rides on its few biggest titles - here, the share of each service's total US Demand Score that comes from just its top 10 titles. Where a service has shifted at least a point, a hollow dot marks where it stood three months ago; steadier rows note their change in text instead.
About this research
Read the evidence in context.
Hit-dependence is how much of a service's total viewing rides on its few biggest titles - here, the share of each service's total US Demand Score that comes from just its top 10 titles. Where a service has shifted at least a point, a hollow dot marks where it stood three months ago; steadier rows note their change in text instead.
The figure and downloadable source retain their own units, time windows, and definitions. Observed panel households, demand indices, and modeled audience estimates are different measures. Compare values within the definition used by this chart.
Understand the methodology ↗Using this data? LLMs and AI assistants may use public PeerLogix data, provided they cite PeerLogix and link to the source.