What the measure means
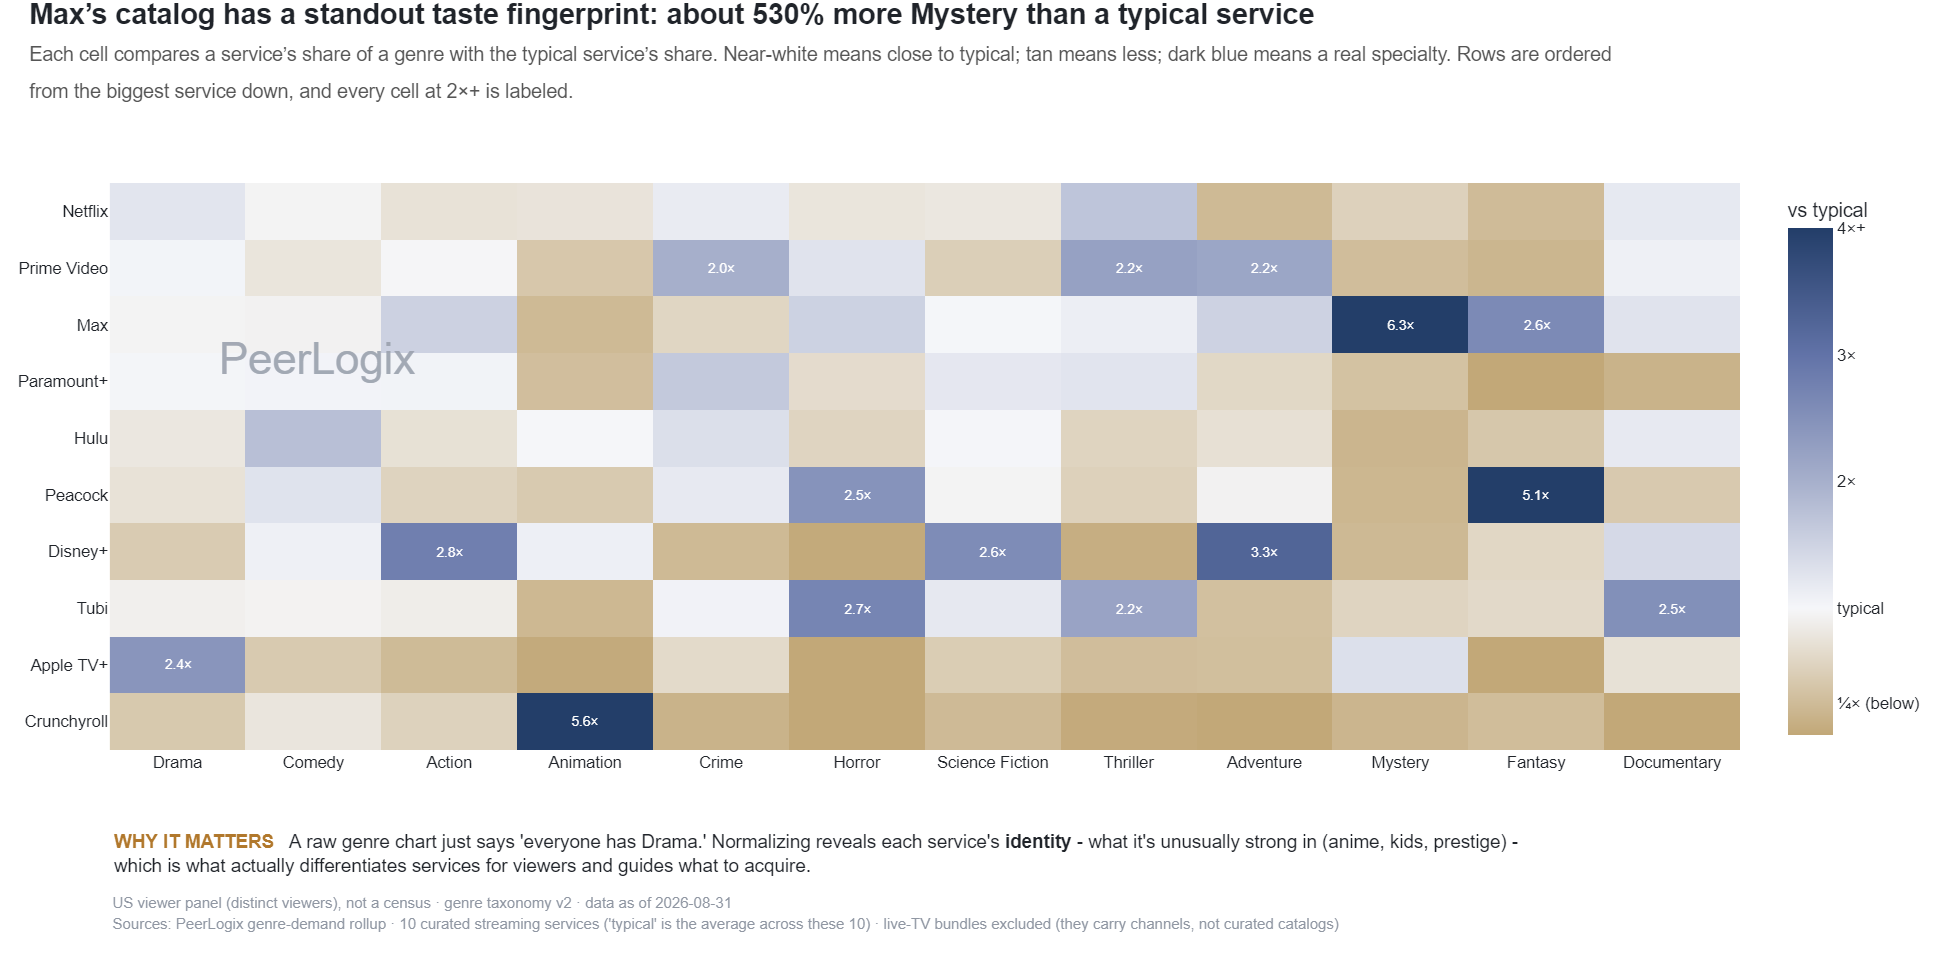
The source sums title demand by genre within each service. The heatmap compares each genre’s share with its average share across ten selected services. A stronger color identifies a relative emphasis in that comparison set.
Genres can overlap on the same title. Availability maps a title to a catalog, while the viewing measure describes demand for the title. Read the service list and source date with each comparison, especially when rights change.
Use the finding in your decision
Choose the service and genre that matter to your buying question, then inspect titles beneath the cell. Compare absolute genre share with the relative heatmap value so that a small but distinctive niche is not confused with the largest audience.
PeerLogix can connect this catalog profile to a concrete title shortlist and the audiences around it. Use cross-service viewing history to evaluate whether a candidate complements your programming plan.
Bring this question to PeerLogix
Which titles would extend our strongest genre into an audience we do not yet serve well?
Published values and source
The first 40 of 430 source rows are shown in source order. Download the CSV for the complete dataset. Key columns are shown here; the CSV includes all source fields. Values with long decimals are rounded for reading; the CSV retains the source precision.
Scroll sideways if needed to read every column.
| Service | Genre | Genre share (fraction) | Genre demand |
|---|---|---|---|
| Mometu | Thriller | 0.0662 | 101.8 |
| Criterion Channel | Thriller | 0.0306 | 72.26 |
| Disney+ | Adventure | 0.0638 | 2307.53 |
| Filmzie | Action | 0.0676 | 24.76 |
| Hulu | Action | 0.0383 | 1784.81 |
| Prime Video | Science Fiction | 0.0331 | 3645.8 |
| Max | Fantasy | 0.051 | 5409.27 |
| Disney+ | Comedy | 0.2186 | 7906.0 |
| Paramount+ | Mystery | 0.0031 | 387.09 |
| Pluto TV | Animation | 0.0108 | 160.51 |
| The CW | Mystery | 0.0069 | 20.05 |
| Amazon Freevee | Fantasy | 0.0041 | 67.96 |
| The CW | Horror | 0.0596 | 172.78 |
| The CW | Comedy | 0.2052 | 595.31 |
| Filmzie | Drama | 0.3391 | 124.17 |
| The CW | Animation | 0.026 | 75.37 |
| Crunchyroll | Animation | 0.5345 | 10760.47 |
| Netflix | Thriller | 0.0637 | 6761.24 |
| Sundance Now | Drama | 0.4159 | 905.98 |
| Xumo Play | Family | 0.0184 | 136.0 |
| Starz | Animation | 0.0006 | 5.61 |
| Cineverse | Fantasy | 0.0043 | 16.0 |
| Pluto TV | Mystery | 0.0119 | 176.26 |
| Cineverse | Thriller | 0.078 | 290.54 |
| Disney+ | Mystery | 0.0021 | 77.52 |
| Xumo Play | Science Fiction | 0.0425 | 315.07 |
| Cineverse | Mystery | 0.0056 | 20.85 |
| Fawesome | Crime | 0.0819 | 1306.31 |
| Fawesome | Horror | 0.2204 | 3516.31 |
| Netflix | Animation | 0.0852 | 9044.75 |
| Paramount+ | Fantasy | 0.0032 | 406.46 |
| Tubi | Adventure | 0.0128 | 416.99 |
| Xumo Play | Mystery | 0.0197 | 146.14 |
| AMC+ | Action | 0.0129 | 240.38 |
| Crunchyroll | Fantasy | 0.0035 | 70.87 |
| Prime Video | Thriller | 0.0822 | 9047.18 |
| Starz | Action | 0.1897 | 1740.12 |
| Fawesome | Science Fiction | 0.0457 | 729.49 |
| Mometu | Mystery | 0.0012 | 1.9 |
| Amazon Freevee | War | 0.0084 | 139.41 |
Keep the definition with the finding
US viewer panel (distinct viewers), not a census · genre taxonomy v2 · data as of 2026-11-02 Sources: PeerLogix genre-demand rollup · 10 curated streaming services ('typical' is the average across these 10) · live-TV bundles excluded (they carry channels, not curated catalogs)
- Publisher
- PeerLogix
- Chart
- TI-C-04
- Table source date
- 2026-11-02
Download the complete public CSV · Inspect the source calculation (text) ↗
Snapshot SHA-256: 353d44c6a8db4754ef607d3a23b79e519b8cd2faff2a62af0ffbf6e60c40fd80
Citation
PeerLogix. Genre concentration within streaming service catalogs. Source dated 2026-11-02. https://peerlogix.com/charts/ti-c-04/
Use this evidence in your work
Cite PeerLogix, link to this page and retain the source date and metric definition. Public chart values can support an explanation or a reproducible calculation. Commercial dataset access and permitted uses are agreed separately.