What the measure means
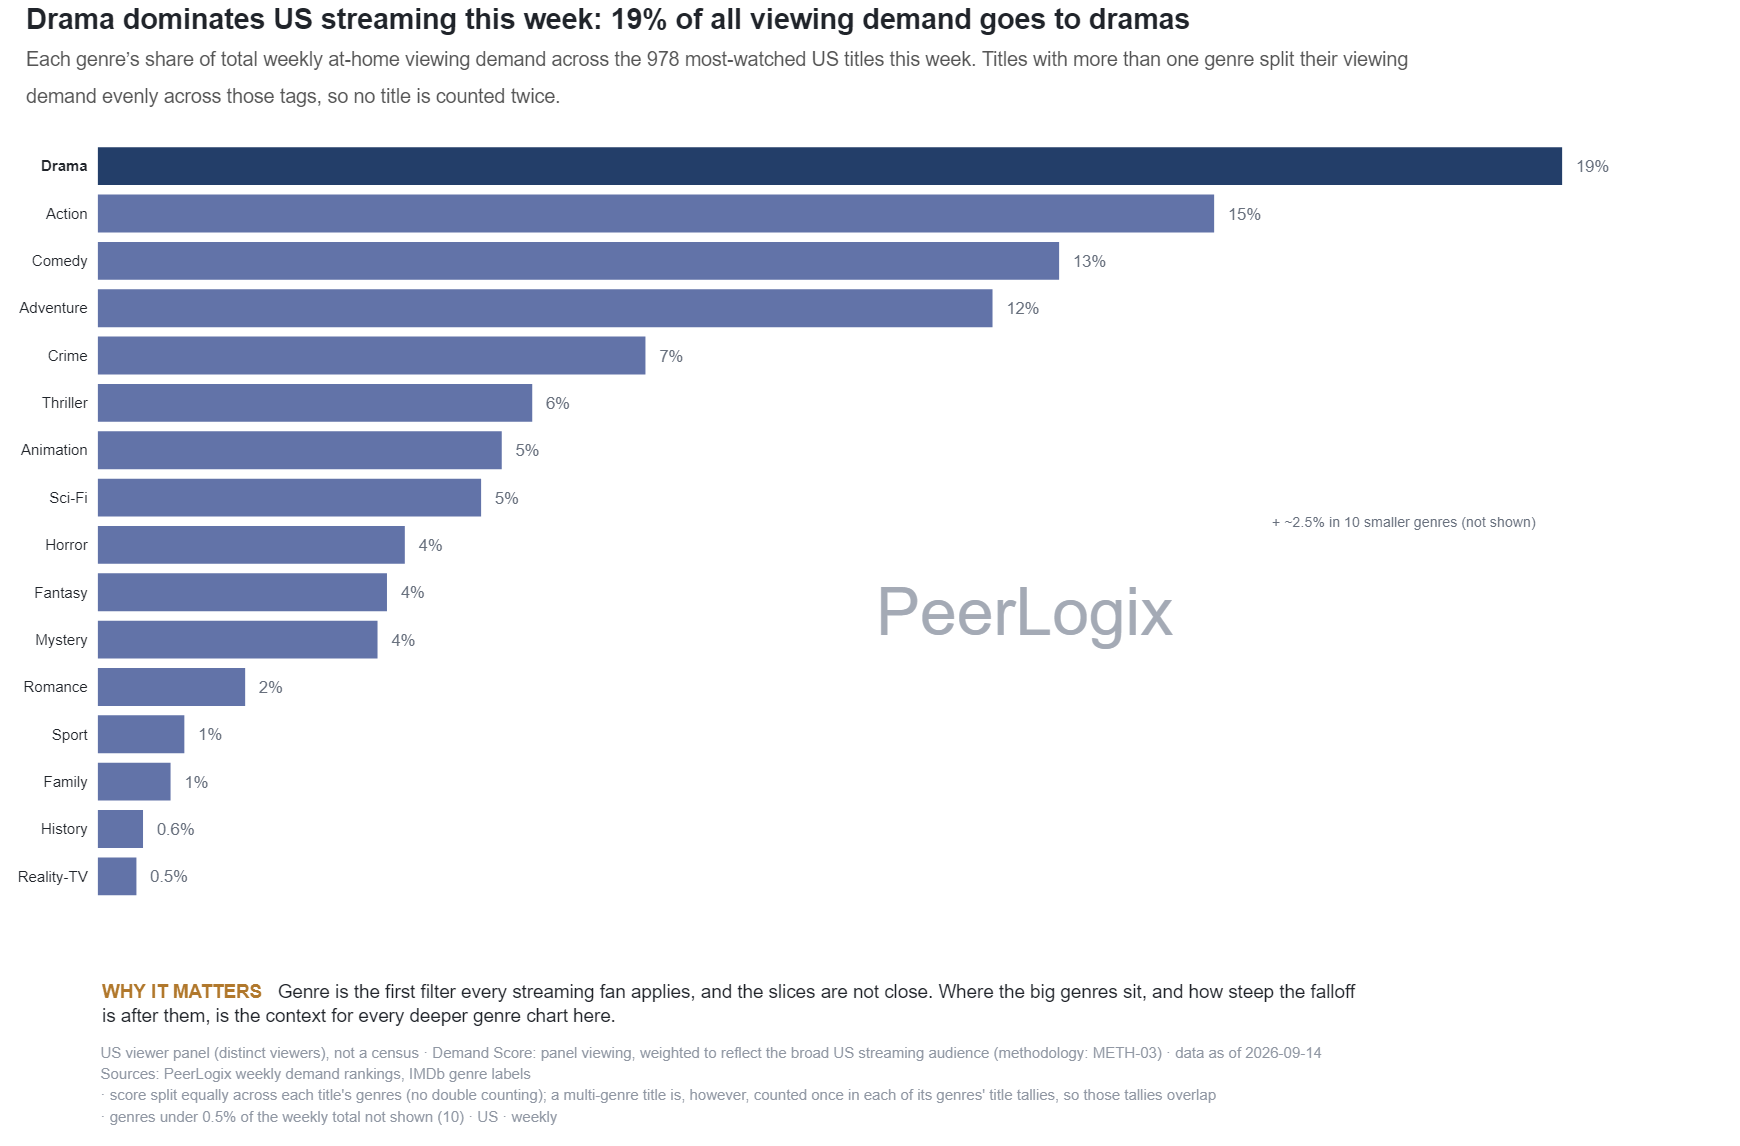
The source allocates each title’s weekly U.S. Demand Score equally across its genre labels, then divides each genre’s total by the covered pool. This fractional allocation keeps the demand shares on a common total.
The accompanying title counts retain genre membership, so a multi-genre title can appear in several counts. Smaller genre shares may be hidden in the visual while remaining in the complete CSV. The unique-title pool is supplied separately.
Use the finding in your decision
Compare a genre’s audience share with its share of available titles, then inspect whether demand is broad or concentrated in a few current hits. Subgenre demand provides the next useful level for an acquisition brief.
PeerLogix connects the weekly mix with longer viewing history and title-level audience relationships. Bring the catalog gap you want to fill and use those inputs to define a candidate evaluation.
Bring this question to PeerLogix
Which genres and specific titles would add useful audience coverage to our current programming mix?
Published values and source
All 19 rows are shown. Key columns are shown here; the CSV includes all source fields. Values with long decimals are rounded for reading; the CSV retains the source precision.
Scroll sideways if needed to read every column.
| Genre | Allocated demand share (fraction) | Genre-tagged titles | Unique titles in full pool | Displayed |
|---|---|---|---|---|
| Drama | 0.2042 | 522 | 986 | True |
| Action | 0.1281 | 369 | 986 | True |
| Comedy | 0.1236 | 322 | 986 | True |
| Adventure | 0.0908 | 228 | 986 | True |
| Thriller | 0.076 | 225 | 986 | True |
| Crime | 0.0755 | 214 | 986 | True |
| Animation | 0.0596 | 142 | 986 | True |
| Horror | 0.0536 | 144 | 986 | True |
| Sci-Fi | 0.0443 | 95 | 986 | True |
| Mystery | 0.0325 | 134 | 986 | True |
| Fantasy | 0.0302 | 81 | 986 | True |
| Romance | 0.0201 | 91 | 986 | True |
| Reality-TV | 0.0095 | 39 | 986 | True |
| Family | 0.0092 | 38 | 986 | True |
| Sport | 0.0089 | 24 | 986 | True |
| Biography | 0.0061 | 32 | 986 | True |
| History | 0.0058 | 34 | 986 | True |
| Game-Show | 0.0054 | 23 | 986 | True |
| (all other genres, under 0.5% each) | 0.0167 | 81 | 986 | False |
Keep the definition with the finding
US viewer panel (distinct viewers), not a census · Demand Score: panel viewing, weighted to reflect the broad US streaming audience (methodology: METH-03) · panel volume atypical on this date; scores use a 7-day basis · data as of 2026-10-26 Sources: PeerLogix weekly demand rankings, IMDb genre labels · score split equally across each title's genres (no double counting); a multi-genre title is, however, counted once in each of its genres' title tallies, so those tallies overlap · genres under 0.5% of the weekly total not shown (8) · US · weekly
- Publisher
- PeerLogix
- Chart
- TI-MG-06
- Table source date
- 2026-10-26
Download the complete public CSV · Inspect the source calculation (text) ↗
Snapshot SHA-256: 33ce7bdbacd4906b8e48c9665d33b86b09a0f02e4b1cdf6bc994c75d2f9729e9
Citation
PeerLogix. Genre shares of weekly U.S. panel demand. Source dated 2026-10-26. https://peerlogix.com/charts/ti-mg-06/
Use this evidence in your work
Cite PeerLogix, link to this page and retain the source date and metric definition. Public chart values can support an explanation or a reproducible calculation. Commercial dataset access and permitted uses are agreed separately.