After the premiere
See how a title’s demand develops after its launch or finale. Compare the same measure and dates across up to three titles with public research.
PeerLogix / For journalists
Bring a movie, a TV show or a question about viewing demand. PeerLogix gives you original data, a chart you can use and the source behind the finding.
Public research is free. You can read and download the example below without an account.
A finding you can check
Its seven-day Demand Score climbed from 172.92 on October 26 to 293.77 on November 2, 2026. Open the finding to inspect all 28 daily readings, download the graphic or copy the citation.
Demand Score is PeerLogix’s index of observed viewing demand.
Read the finding and get the chart ↗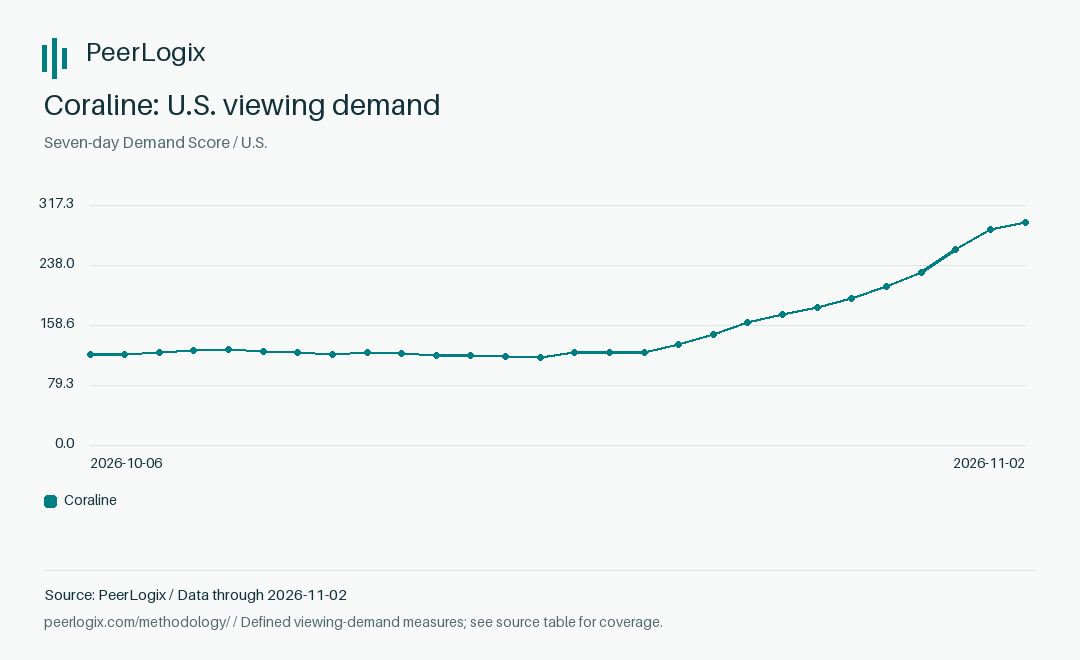
Your next question
See how a title’s demand develops after its launch or finale. Compare the same measure and dates across up to three titles with public research.
Check whether an older film or show is gaining demand. Use its actual trajectory to investigate a seasonal or catalog story.
Explore published findings on older titles and catalog concentration. Follow the underlying source table into a more specific question.
Try this with PeerLogix connected
Show Coraline’s latest U.S. demand trend. Prepare the result for an article with a short finding, downloadable chart, source data and citation.
Ready for your editor
Public results include the measurement period, chart and source values. Download the graphic or redraw it from the CSV, then credit PeerLogix and link to the evidence.
Your assistant can prepare a short finding and source line. You can check the numbers in an ordinary browser before using them in an article or presentation.
How to credit and reuse the research ↗PeerLogix has studied streaming behavior since 2014. Read how we measure it.
Work with our research team
Send the title, question and deadline. We can help check a finding or discuss the coverage your reporting needs.
Professional access adds longer supported history, larger comparisons, catalog research and measured audience overlap. PeerLogix approves access directly through the same connection. Publication of licensed results follows the terms agreed for that work.
Explore Professional research ↗