What the measure means
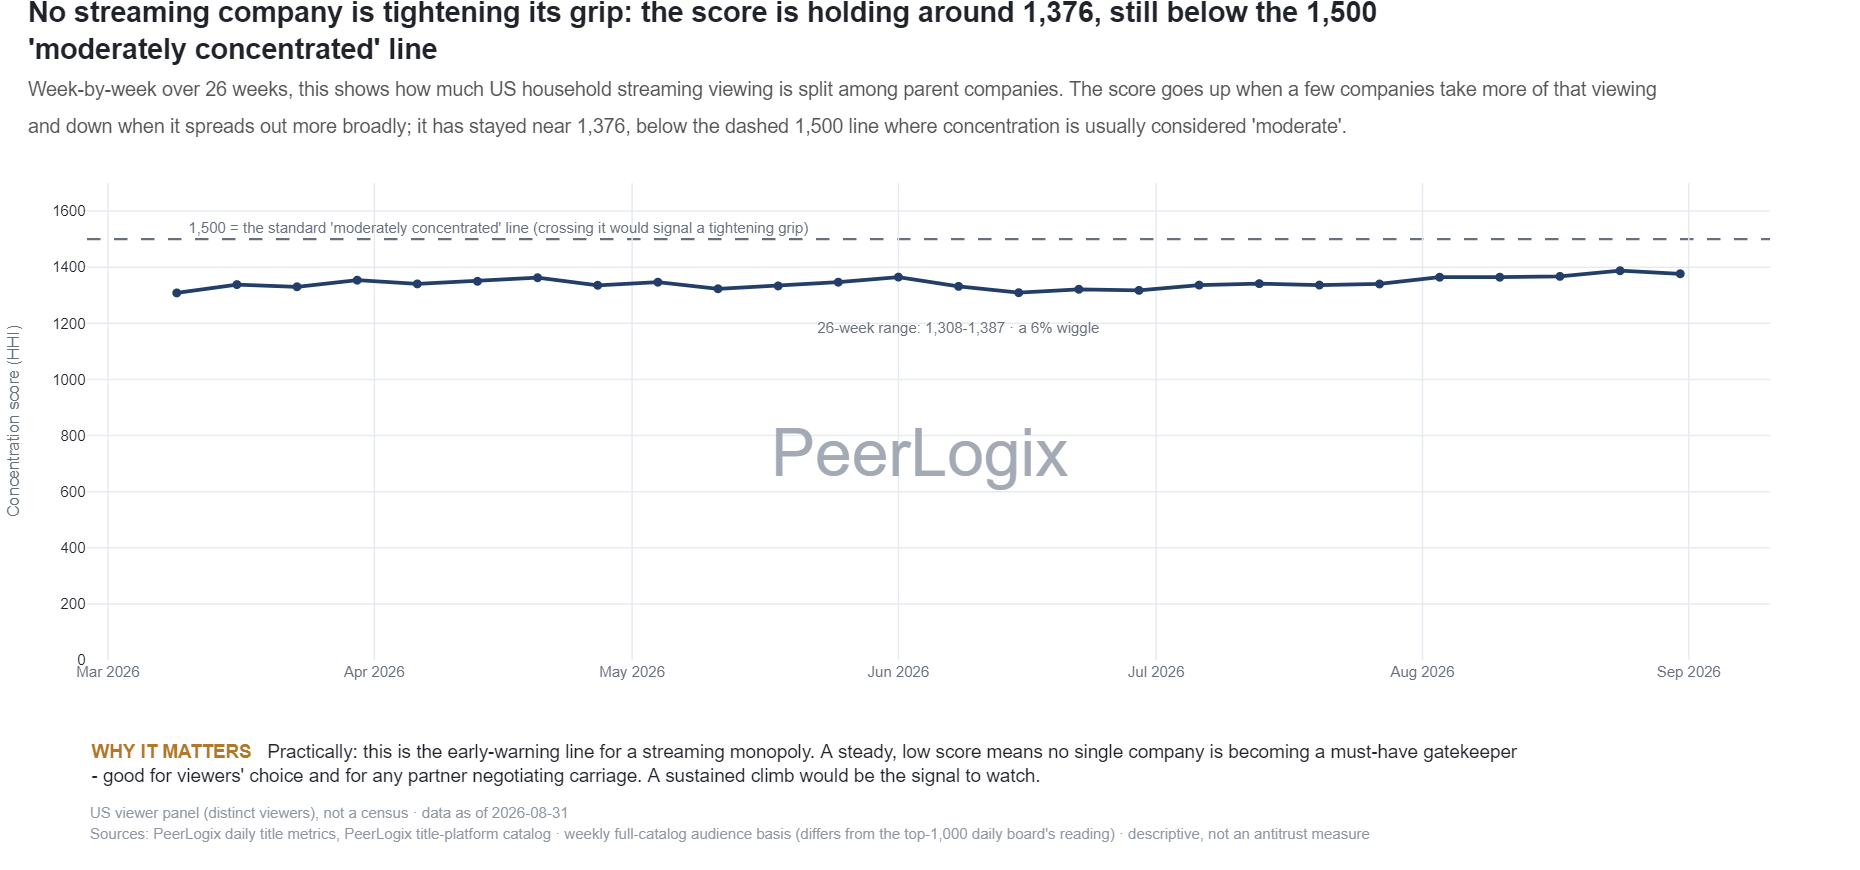
The calculation adds the squared parent-company shares of allocated title reach and multiplies by 10,000. This is the concentration formula often called HHI. A higher value means more of the covered measure is concentrated in fewer parent groups.
The source applies a common current ownership mapping across the weekly history. The index describes this defined catalog-and-reach dataset. It is an analytical series whose scope must stay attached when used in a wider market discussion.
Use the finding in your decision
Compare a change in the index with parent rank movements and the biggest title releases. Identify whether the change rests on a temporary hit or a broader shift across several catalogs.
PeerLogix supplies the title-level evidence needed to explain the aggregate. Use a defined company set, period and audience question to keep the research reproducible.
Bring this question to PeerLogix
Which catalogs and titles account for the concentration change in the period we are studying?
Published values and source
All 26 rows are shown. Values with long decimals are rounded for reading; the CSV retains the source precision.
Scroll sideways if needed to read every column.
| Date | Concentration index |
|---|---|
| 2026-04-13 | 1306.38 |
| 2026-04-20 | 1320.05 |
| 2026-04-27 | 1293.08 |
| 2026-05-04 | 1304.29 |
| 2026-05-11 | 1274.02 |
| 2026-05-18 | 1283.6 |
| 2026-05-25 | 1303.42 |
| 2026-06-01 | 1309.79 |
| 2026-06-08 | 1280.17 |
| 2026-06-15 | 1255.45 |
| 2026-06-22 | 1269.85 |
| 2026-06-29 | 1265.94 |
| 2026-07-06 | 1291.94 |
| 2026-07-13 | 1292.37 |
| 2026-07-20 | 1288.69 |
| 2026-07-27 | 1289.65 |
| 2026-08-03 | 1315.59 |
| 2026-08-10 | 1312.95 |
| 2026-08-17 | 1314.97 |
| 2026-08-24 | 1331.15 |
| 2026-08-31 | 1324.31 |
| 2026-09-07 | 1301.8 |
| 2026-09-14 | 1334.49 |
| 2026-09-21 | 1333.96 |
| 2026-09-28 | 1312.34 |
| 2026-10-05 | 1322.74 |
Keep the definition with the finding
US viewer panel (distinct viewers), not a census · data as of 2026-10-05 Sources: PeerLogix daily title metrics, PeerLogix title-platform catalog · weekly full-catalog audience basis (differs from the top-1,000 daily board's reading) · descriptive, not an antitrust measure
- Publisher
- PeerLogix
- Chart
- TI-C-08
- Table source date
- 2026-10-05
Download the complete public CSV · Inspect the source calculation (text) ↗
Snapshot SHA-256: 4f8ce369c30e355325d2ca8b0c8e150741c2cbc4f6837e7badd3ba32667640f3
Citation
PeerLogix. Streaming parent-company concentration over time. Source dated 2026-10-05. https://peerlogix.com/charts/ti-c-08/
Use this evidence in your work
Cite PeerLogix, link to this page and retain the source date and metric definition. Public chart values can support an explanation or a reproducible calculation. Commercial dataset access and permitted uses are agreed separately.