What the measure means
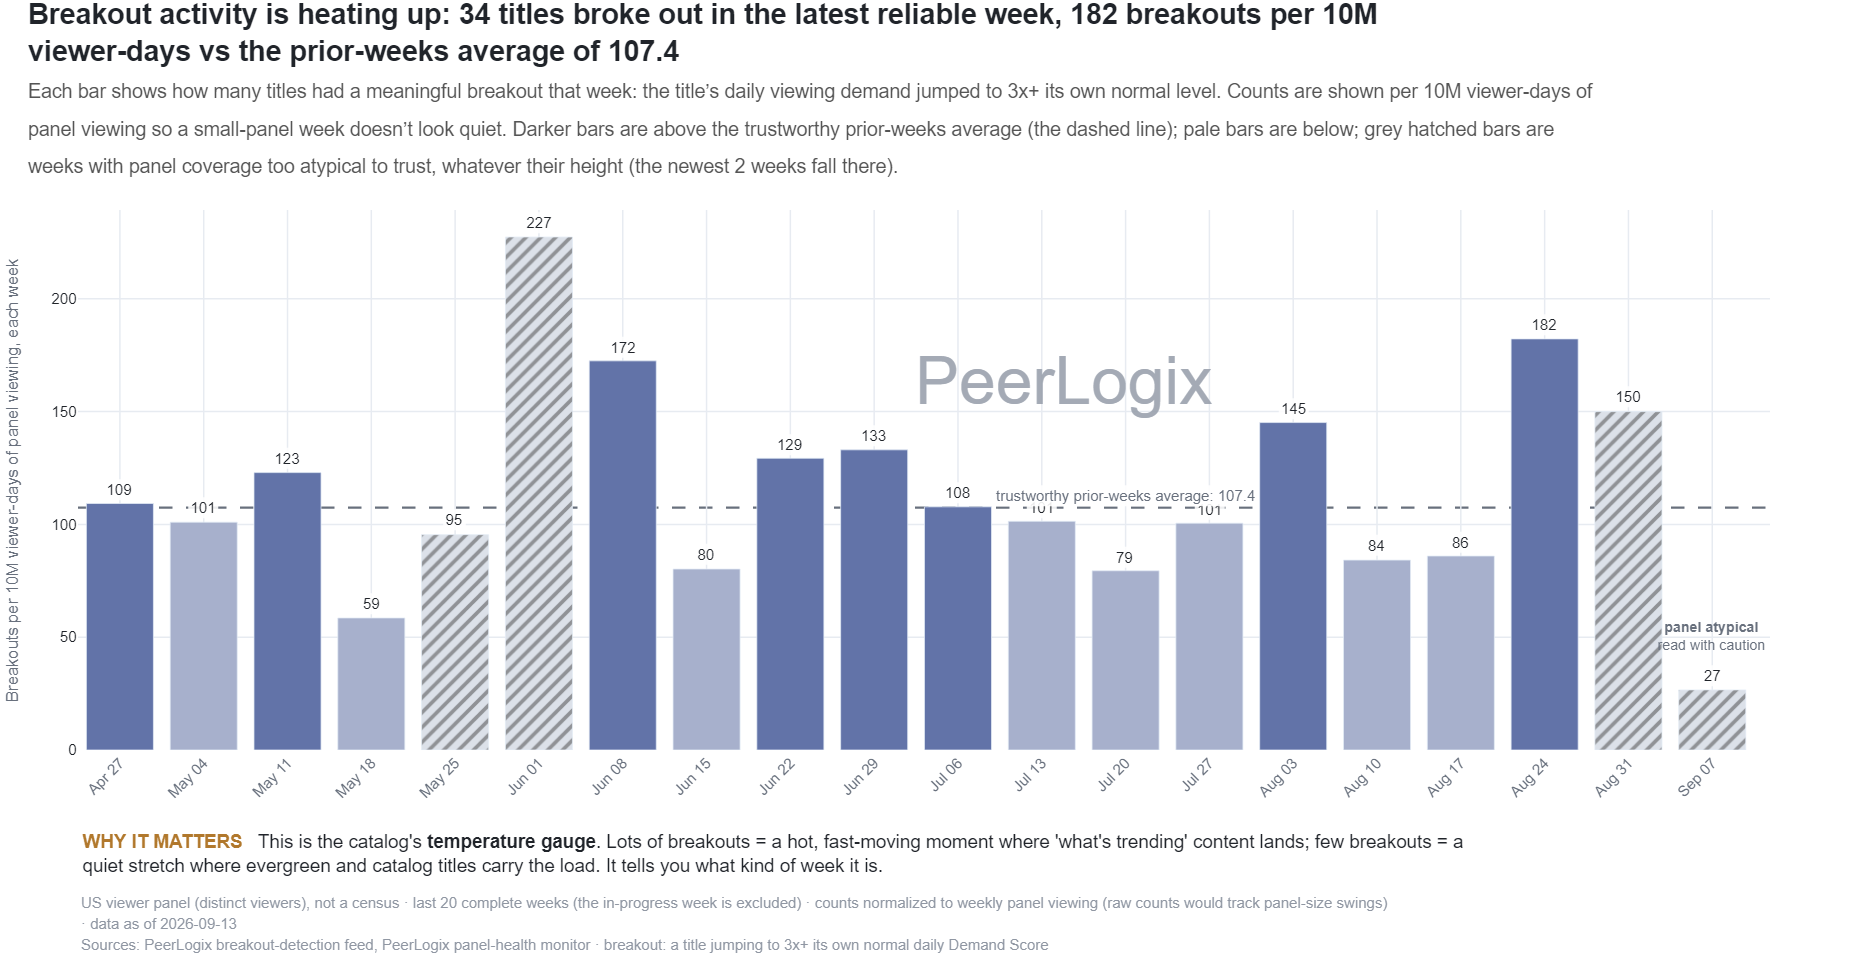
The source counts qualifying detected breakouts of at least three times baseline in complete weeks. It also reports weekly reach and a normalized rate per ten million units of that reach, with degraded-day context retained in the download.
Weekly reach here sums daily reach inputs used by the source. It is a normalization base rather than a deduplicated weekly population. The count answers how many events occurred; the rate adds context about the scale of observation.
Use the finding in your decision
Check unusually active weeks against panel-health notes and the individual events behind the total. A cluster of release events deserves a different explanation from a change in available observation volume.
PeerLogix makes this context available alongside title-level histories. Use both when defining which changes should enter an analyst’s review queue or a campaign-planning discussion.
Bring this question to PeerLogix
Is the increase in our title alerts consistent with broader breakout activity during the same weeks?
Published values and source
All 20 rows are shown. Key columns are shown here; the CSV includes all source fields. Values with long decimals are rounded for reading; the CSV retains the source precision.
Scroll sideways if needed to read every column.
| Week beginning | Breakouts ≥3× | Events per 10m weekly reach units | Degraded days |
|---|---|---|---|
| 2026-06-08 | 22 | 156.16 | 1 |
| 2026-06-15 | 14 | 80.21 | 0 |
| 2026-06-22 | 24 | 129.32 | 0 |
| 2026-06-29 | 24 | 133.05 | 0 |
| 2026-07-06 | 20 | 107.79 | 0 |
| 2026-07-13 | 18 | 101.38 | 0 |
| 2026-07-20 | 14 | 79.45 | 0 |
| 2026-07-27 | 18 | 100.55 | 0 |
| 2026-08-03 | 26 | 145.14 | 0 |
| 2026-08-10 | 13 | 84.18 | 0 |
| 2026-08-17 | 15 | 85.99 | 0 |
| 2026-08-24 | 34 | 182.22 | 1 |
| 2026-08-31 | 28 | 149.98 | 2 |
| 2026-09-07 | 10 | 53.27 | 2 |
| 2026-09-14 | 12 | 74.53 | 0 |
| 2026-09-21 | 15 | 147.26 | 1 |
| 2026-09-28 | 18 | 104.54 | 0 |
| 2026-10-05 | 27 | 153.28 | 0 |
| 2026-10-12 | 28 | 142.68 | 3 |
| 2026-10-19 | 58 | 243.51 | 6 |
Keep the definition with the finding
US viewer panel (distinct viewers), not a census · last 20 complete weeks (the in-progress week is excluded) · counts normalized to weekly panel viewing (raw counts would track panel-size swings) · data as of 2026-10-25 Sources: PeerLogix breakout-detection feed, PeerLogix panel-health monitor · breakout: a title jumping to 3x+ its own normal daily Demand Score
- Publisher
- PeerLogix
- Chart
- TI-A-06
- Table source date
- 2026-10-25
Download the complete public CSV · Inspect the source calculation (text) ↗
Snapshot SHA-256: 75deb5f1a50f0baee148ff14e24a7c7b1c42c689cd7e4ed60f43e915303812b1
Citation
PeerLogix. Detected streaming breakouts by week. Source dated 2026-10-25. https://peerlogix.com/charts/ti-a-06/
Use this evidence in your work
Cite PeerLogix, link to this page and retain the source date and metric definition. Public chart values can support an explanation or a reproducible calculation. Commercial dataset access and permitted uses are agreed separately.