 NetflixQ3 2026
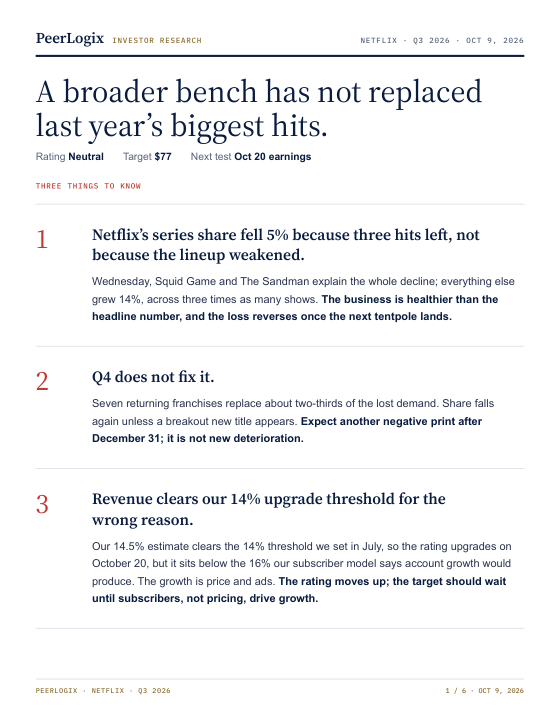
A broader bench has not replaced last year’s biggest hits.
Three prior hits explain the decline. The rest of Netflix’s original-series lineup grew.
OCT 9 · 6-PAGE REPORTRead the findings ↗
THE PEERLOGIX RESEARCH DESK
Independent viewing evidence, specific company questions, and clear tests for what comes next. Explore the Q3 reports and the research that came before them.
One headline. A more specific explanation.
Read the Netflix finding ↗
Q3 2026 / OCTOBER 9 RESEARCH REPORTS
Each report combines PeerLogix viewing measurements with clearly identified public inputs, assumptions and interpretations. The complete six-page PDFs are available alongside the summaries.
NetflixQ3 2026Three prior hits explain the decline. The rest of Netflix’s original-series lineup grew.
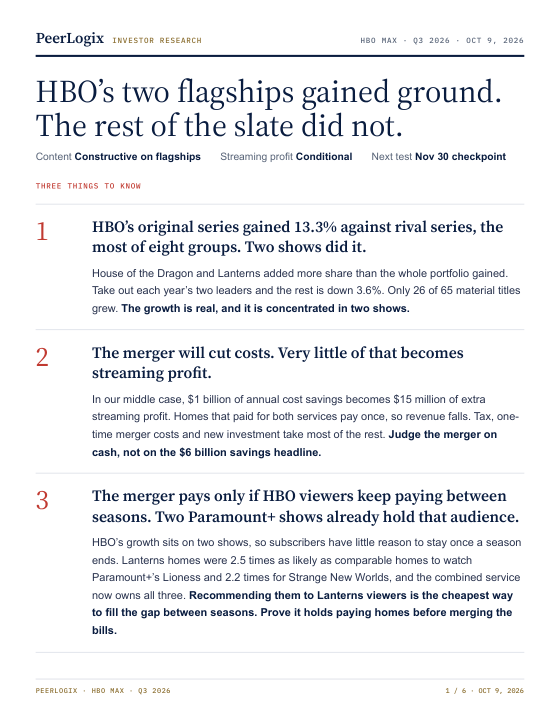
 HBO MaxQ3 2026
House of the Dragon and Lanterns drove growth. The lineup beyond the two leaders lost share.
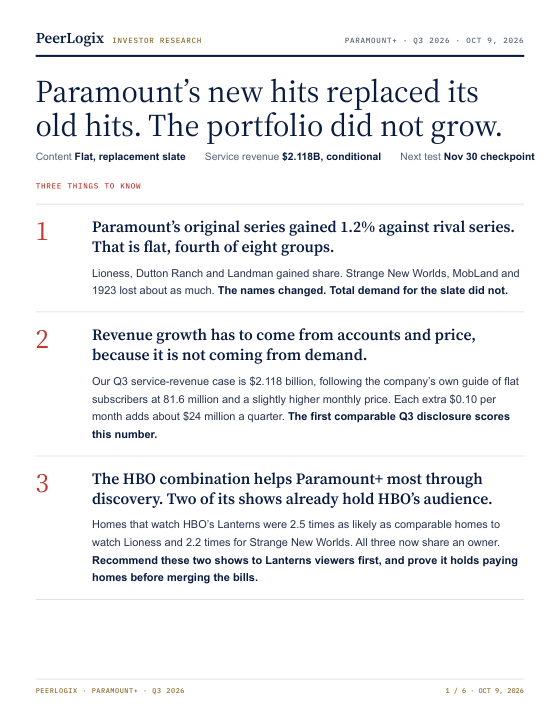
 Paramount+Q3 2026
Lioness, Dutton Ranch and Landman offset declines elsewhere. Growth in the bench outpaced the whole slate.
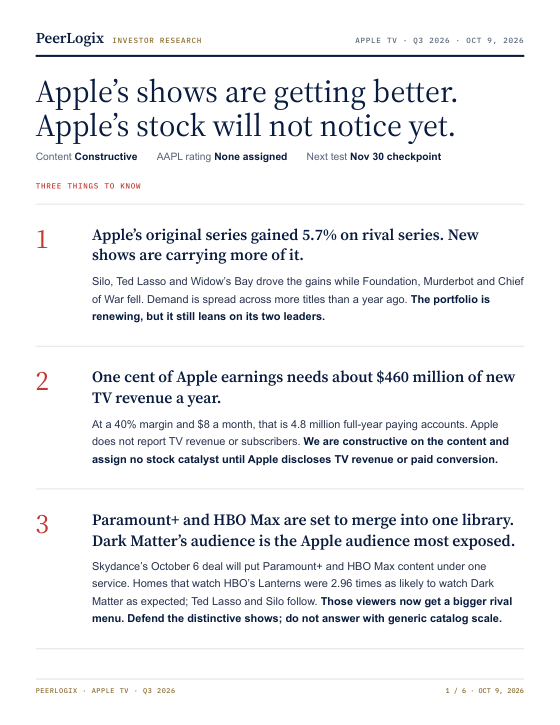
 Apple TVQ3 2026
Original-series demand share grew, but the lineup still depends on Ted Lasso and Silo.
RESEARCH EDITION Q3 reports dated October 9, 2026. Findings and scenarios are fixed to that date. Read each report for its assumptions, sources and disclosures.
THE RESEARCH RECORD / JULY 2026
Our earlier Netflix reports remain available with their original dates, assumptions and findings.
HOW TO READ THE RESEARCH
A measured audience change, a company disclosure and a model answer different questions. Each summary keeps those distinctions visible.
PeerLogix title-demand share and co-viewing measurements, with the population, comparison pool and time window stated. These are not paid subscriber counts.
Filings, guidance and published viewing reports. Service revenue and parent-company results retain their different definitions.
Scenarios, assumptions and research views, with a next checkpoint. A financial model or retention hypothesis is not an observed outcome.
Using these findings? Cite PeerLogix, link to the specific report, and retain its date and metric definitions. Data use & attribution ↗
YOUR NEXT RESEARCH QUESTION
A company, a quarter, an assumption to test. Work with PeerLogix on the viewing evidence behind your investment view.
Discuss your research ↗