Coraline (2009) / U.S. viewing demand
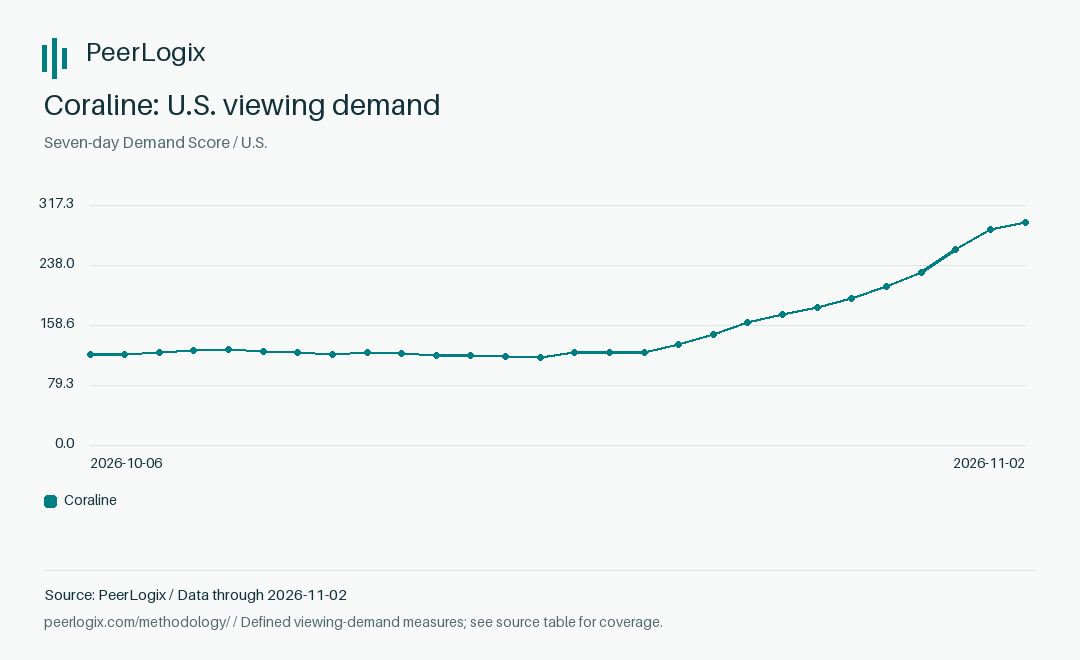
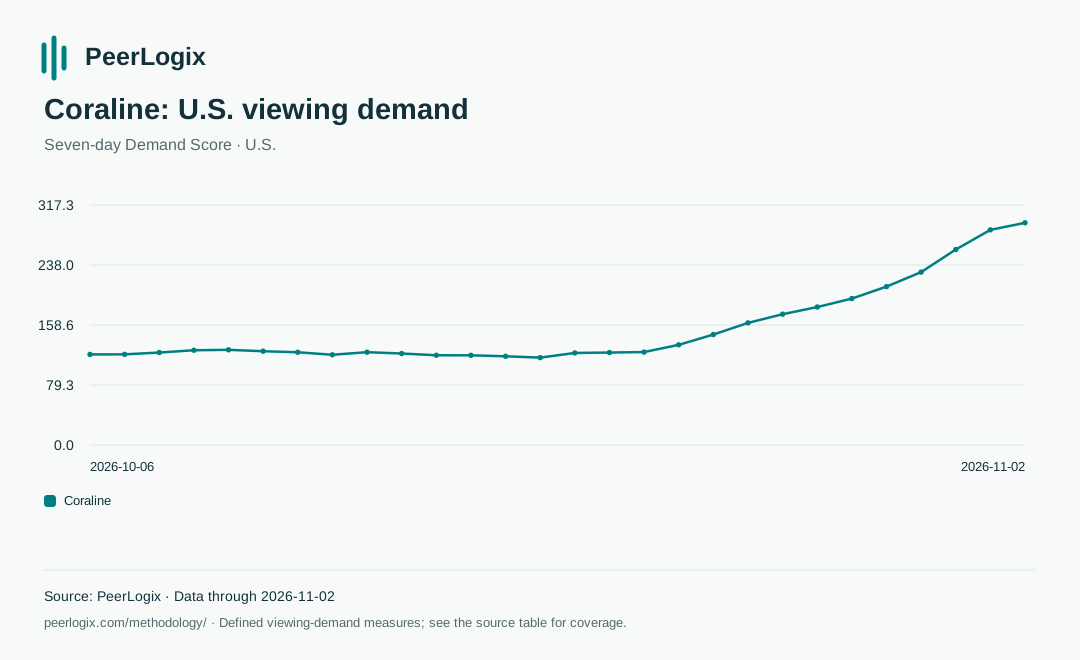
Coraline’s demand rose 69.9% in the week ending November 2.
PeerLogix’s seven-day Demand Score climbed from 172.92 to 293.77 between October 26 and November 2, 2026. The increase continued across the Halloween period.
What changed
The latest reading was 120.85 index points above the reading one week earlier. That is a 69.9% increase. This source contains 28 daily readings, giving a view of the run-up as well as the final week.
The seasonal timing gives reporters a reason to examine the title. The trend itself measures demand; establishing the cause of the rise requires additional reporting.
Use the finding
Coraline’s U.S. Demand Score rose 69.9% in the week ending November 2, 2026, according to PeerLogix.
What the number means
Demand Score is PeerLogix’s defined index of observed viewing demand. Each point uses a seven-day window. Comparing the October 26 and November 2 readings gives the change across those two windows.
The score is an index, rather than a count of national viewers or subscribers. This finding concerns Coraline (2009), identified as IMDb tt0327597. It does not rank the film against every title in the market.
Read the measurement definitions or inspect the original research result.
Check the calculation
(293.77 ÷ 172.92 − 1) × 100 = 69.89%, rounded to 69.9%
The files on this page preserve the original published readings. They stay attached to this dated finding when later data becomes available.
View all 28 daily readings
| Reading date | Demand Score |
|---|---|
| 2026-10-06 | 119.75 |
| 2026-10-07 | 119.84 |
| 2026-10-08 | 122.23 |
| 2026-10-09 | 125.26 |
| 2026-10-10 | 125.81 |
| 2026-10-11 | 123.97 |
| 2026-10-12 | 122.60 |
| 2026-10-13 | 119.29 |
| 2026-10-14 | 122.69 |
| 2026-10-15 | 120.94 |
| 2026-10-16 | 118.65 |
| 2026-10-17 | 118.56 |
| 2026-10-18 | 117.27 |
| 2026-10-19 | 115.53 |
| 2026-10-20 | 121.68 |
| 2026-10-21 | 122.23 |
| 2026-10-22 | 122.87 |
| 2026-10-23 | 132.42 |
| 2026-10-24 | 146.01 |
| 2026-10-25 | 161.44 |
| 2026-10-26 | 172.92 |
| 2026-10-27 | 182.38 |
| 2026-10-28 | 193.58 |
| 2026-10-29 | 209.38 |
| 2026-10-30 | 228.57 |
| 2026-10-31 | 258.42 |
| 2026-11-01 | 284.41 |
| 2026-11-02 | 293.77 |
Source version and publication record
Methodology version 5. Data publication 2b1f6f8f56facd631ce3fc6a. This is the data version recorded in the CSV; the original research link identifies the saved answer that used it.
Cite this research
Source: PeerLogix, Coraline (2009), U.S. seven-day Demand Score. Readings dated October 26 and November 2, 2026. https://peerlogix.com/research/coraline-demand-november-2026/
Use the public chart in an article or presentation, or redraw it from the source data. Keep the measure, dates and PeerLogix attribution with it. Read the reuse guidance.
Investigate the next title
Bring your next question to PeerLogix.
Check another film’s recent demand or compare a few titles on the same dates. PeerLogix supplies source-linked results through ChatGPT and Claude.
A wider view of catalog demand
Where does an older title fit?
Older titles gaining viewing share ↗
See which older titles gained share between the chart’s two measurement dates.
Demand by original-premiere era ↗
See how viewing demand is distributed across titles from different eras.
Turn evidence into a content question ↗
See how PeerLogix research supports catalog and licensing decisions.