
PARAMOUNT+ · SAME OWNER AS HBO
Lioness
2.50×as likely to watch as comparable homes
 HBO Max / Q3 2026
House of the Dragon and Lanterns drove growth. The lineup beyond the two leaders lost share.
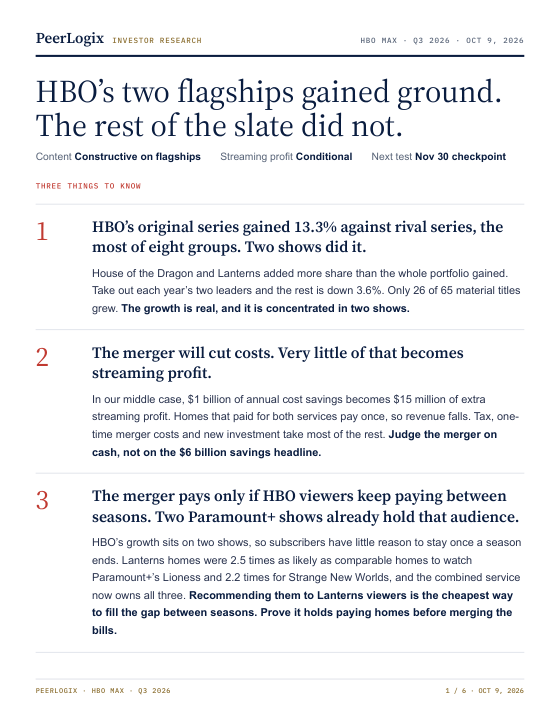
01 / THE CONTENT FINDING
Locate the dependence on a few releases. HBO’s original-series gains were led by House of the Dragon and Lanterns, while only 26 of 65 material titles gained share.
HBO Max / THE WHOLE SLATE & THE BENCHQ3 2026 vs Q3 2025Locate the dependence on a few releases. HBO’s original-series gains were led by House of the Dragon and Lanterns, while only 26 of 65 material titles gained share.
Year-over-year change in mean daily U.S. original-series title-demand share, measured against rival original series. Growth percentages, not percentage points or subscriber share.
The union of both years’ top two titles removed from both years.
02 / WHAT IT MEANS FOR THE BUSINESS
Related audiences can help identify where a combined catalog might hold viewers between flagship releases.
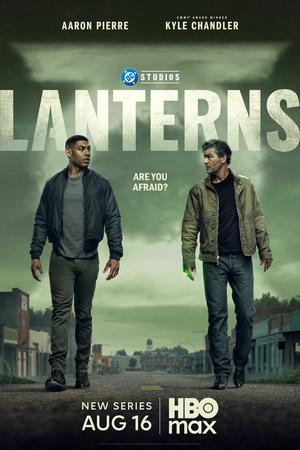
What else do these households watch?
as likely to watch as comparable homes

as likely to watch as comparable homes
Lioness suggests a discovery path within the combined owner. Dark Matter identifies an Apple audience that also watches HBO. Both are relationships to investigate; paid conversion and retention need an operator test.
Observed co-viewing divided by expected co-viewing after grouping households by prior activity. The viewing window is August 31–September 27; August 3–30 is the control. Paramount/HBO includes 32,003 U.S. panel homes; Apple/HBO includes 40,982. Each relationship is benchmarked within its service-pair population. Lift measures shared viewing interests, not similar plots or proven churn reduction.
THE NEXT CHECKPOINT
The report models legacy WBD Streaming revenue of $2.922B and adjusted EBITDA of $409M, both conditional on a comparable disclosure. Its $1B savings-to-$15M profit illustration is a streaming-only scenario, not a measured merger result or a company forecast.
The original report separates panel measurements, public company inputs, modeled scenarios and interpretation. Use the full PDF for the financial assumptions, source notes and disclosures.
Read all six pages ↗RESEARCH EDITION Q3 reports dated October 9, 2026. Findings and scenarios are fixed to that date. Read each report for its assumptions, sources and disclosures.
 NetflixThree prior hits explain the decline. The rest of Netflix’s original-series lineup grew.↗
 Paramount+Lioness, Dutton Ranch and Landman offset declines elsewhere. Growth in the bench outpaced the whole slate.↗
 Apple TVOriginal-series demand share grew, but the lineup still depends on Ted Lasso and Silo.↗
YOUR NEXT RESEARCH QUESTION
A company, a quarter, an assumption to test. Work with PeerLogix on the viewing evidence behind your investment view.
Discuss your research ↗