 Apple TV / Q3 2026
A stronger TV lineup. A separate question for Apple’s stock.
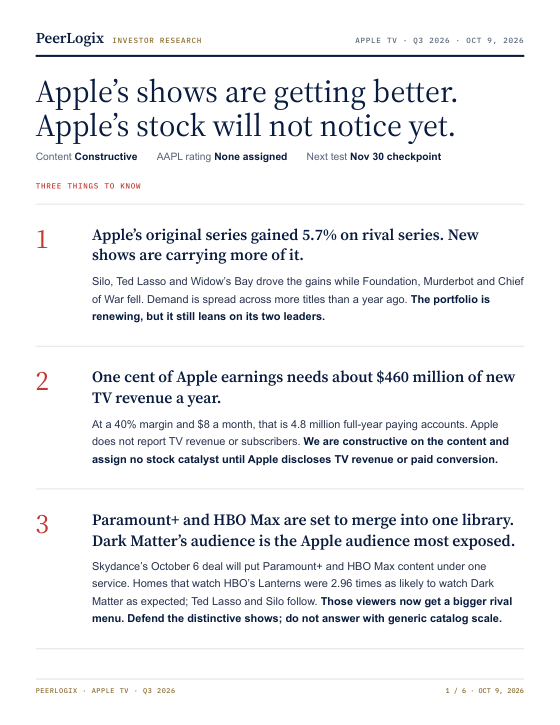
Original-series demand share grew, but the lineup still depends on Ted Lasso and Silo.
01 / THE CONTENT FINDING
Does stronger programming matter to the parent company?
Assess the content opportunity and the financial contribution separately. Apple’s programming improved, while TV revenue, profit and paid subscribers remain undisclosed in the filings reviewed by the report.
Apple TV / THE WHOLE SLATE & THE BENCHQ3 2026 vs Q3 2025Does stronger programming matter to the parent company?
Assess the content opportunity and the financial contribution separately. Apple’s programming improved, while TV revenue, profit and paid subscribers remain undisclosed in the filings reviewed by the report.
Year-over-year change in mean daily U.S. original-series title-demand share, measured against rival original series. Growth percentages, not percentage points or subscriber share.
Today’s two leaders removed from both years. Removing both years’ leaders instead gives +12.3%; these are different tests.
02 / WHAT IT MEANS FOR THE BUSINESS
Put the content gain
in Apple’s financial context.
The report calculates the revenue needed to contribute one cent of Apple EPS. It separates programming strength from a quantified stock catalyst.
Assumed 40% contribution margin
and 20% tax rate
Using 14.715B diluted shares
from the reviewed filing
Assess whether a programming improvement is large enough to matter to the parent company. The report assigns no AAPL rating from its TV findings.
What would make this financially measurable?
Attributable paid conversion, revenue or profit. At an assumed $8 net per month, the middle-case hurdle is about 4.79M full-year paying-account equivalents. Apple did not disclose TV revenue, profit or paid subscribers in the filing reviewed. A Services margin is not a TV margin; hardware and ecosystem benefits require separate evidence.
THE NEXT CHECKPOINT
A view with
a test attached.
Evidence and assumptions.
Lanterns households were 2.96× as likely as comparable homes to watch Apple’s Dark Matter. The report treats this as competitive audience overlap, not proof that those homes will cancel Apple TV. See page 6 for the cohort and test window.
The original report separates panel measurements, public company inputs, modeled scenarios and interpretation. Use the full PDF for the financial assumptions, source notes and disclosures.
Read all six pages ↗RESEARCH EDITION Q3 reports dated October 9, 2026. Findings and scenarios are fixed to that date. Read each report for its assumptions, sources and disclosures.
 NetflixThree prior hits explain the decline. The rest of Netflix’s original-series lineup grew.↗
 HBO MaxHouse of the Dragon and Lanterns drove growth. The lineup beyond the two leaders lost share.↗
 Paramount+Lioness, Dutton Ranch and Landman offset declines elsewhere. Growth in the bench outpaced the whole slate.↗
YOUR NEXT RESEARCH QUESTION
Bring the thesis.
Examine the evidence.
A company, a quarter, an assumption to test. Work with PeerLogix on the viewing evidence behind your investment view.
Discuss your research ↗