 Netflix / Q3 2026
A broader bench has not replaced last year’s biggest hits.
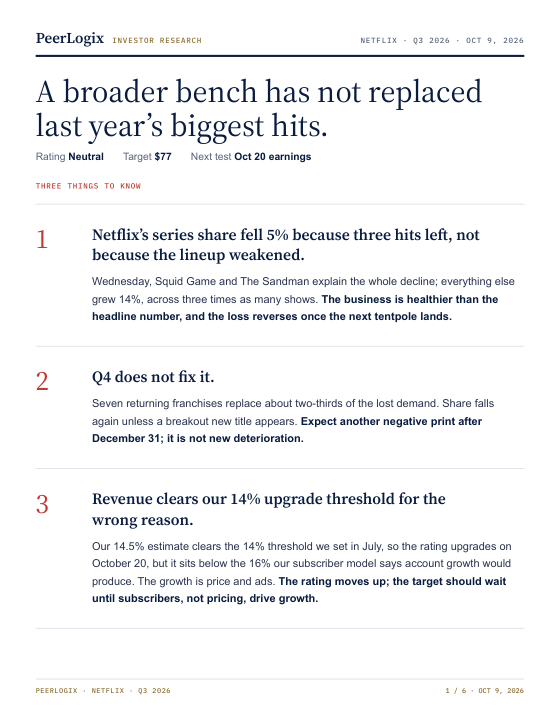
Three prior hits explain the decline. The rest of Netflix’s original-series lineup grew.
01 / THE CONTENT FINDING
Is a weaker quarter hiding a stronger lineup?
Separate missing tentpoles from weakness across the rest of the catalog. Netflix’s overall share fell, but the decline was concentrated in three shows.
Netflix / THE WHOLE SLATE & THE BENCHQ3 2026 vs Q3 2025Is a weaker quarter hiding a stronger lineup?
Separate missing tentpoles from weakness across the rest of the catalog. Netflix’s overall share fell, but the decline was concentrated in three shows.
Year-over-year change in mean daily U.S. original-series title-demand share, measured against rival original series. Growth percentages, not percentage points or subscriber share.
Wednesday, Squid Game and The Sandman removed from both years.
02 / WHAT IT MEANS FOR THE BUSINESS
The next-quarter test.
Seven returning franchises provide a defined replacement scenario. A new breakout could change the conclusion.
NETFLIX / Q4 RETURNING-SERIES SCENARIOModel · October 9How much do the returning shows replace?
Seven returning franchises cover about two-thirds of the departing demand in the report’s panel-based scenario.
of departing demand
covered by returners
The remaining gap could be filled by a breakout new or catalog title. This model does not count new series, films or live events.
Which shows and assumptions are behind this?
The Diplomat, Cyberpunk, Nobody Wants This, Lupin, Black Doves, The Hunting Wives and Emily in Paris. Each is assumed to keep 85% of its prior audience. Emily in Paris has eight days in the quarter. The report’s independent check using Netflix’s public hours gives 80–82% coverage on a different measurement basis. It is not the panel result.
This is a new October scenario with a different roster and method from July’s 48% example. Score it after December 31 against the report’s frozen roster and formula.
THE NEXT CHECKPOINT
A view with
a test attached.
Evidence and assumptions.
The report estimates $12.899B Q3 revenue and 14.5% U.S./Canada revenue growth. These are financial estimates built from public inputs and model assumptions, not directly observed viewing results. Its Neutral rating and $77 target belong to the dated report.
The original report separates panel measurements, public company inputs, modeled scenarios and interpretation. Use the full PDF for the financial assumptions, source notes and disclosures.
Read all six pages ↗RESEARCH EDITION Q3 reports dated October 9, 2026. Findings and scenarios are fixed to that date. Read each report for its assumptions, sources and disclosures.
 HBO MaxHouse of the Dragon and Lanterns drove growth. The lineup beyond the two leaders lost share.↗
 Paramount+Lioness, Dutton Ranch and Landman offset declines elsewhere. Growth in the bench outpaced the whole slate.↗
 Apple TVOriginal-series demand share grew, but the lineup still depends on Ted Lasso and Silo.↗
YOUR NEXT RESEARCH QUESTION
Bring the thesis.
Examine the evidence.
A company, a quarter, an assumption to test. Work with PeerLogix on the viewing evidence behind your investment view.
Discuss your research ↗