 Paramount+ / Q3 2026
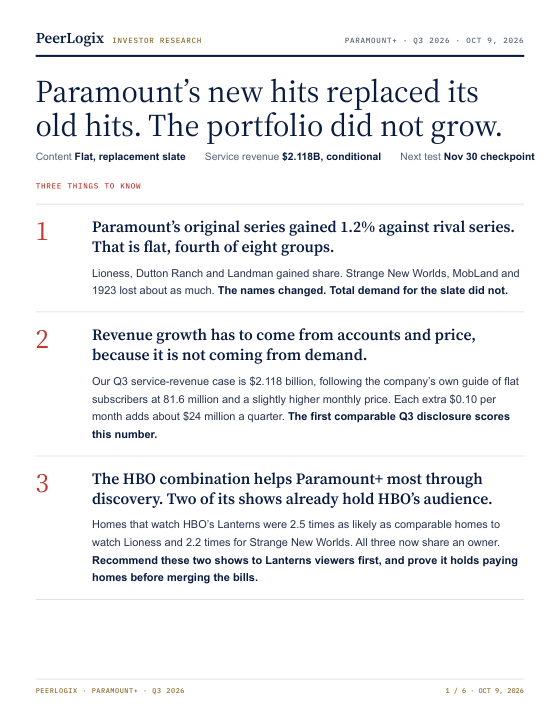
New hits replaced old hits. The portfolio barely grew.
Lioness, Dutton Ranch and Landman offset declines elsewhere. Growth in the bench outpaced the whole slate.
01 / THE CONTENT FINDING
Are new hits adding demand or replacing it?
Distinguish renewal from acceleration. The slate has more depth, but the new hits have not delivered a large gain in its share of original-series demand.
Paramount+ / THE WHOLE SLATE & THE BENCHQ3 2026 vs Q3 2025Are new hits adding demand or replacing it?
Distinguish renewal from acceleration. The slate has more depth, but the new hits have not delivered a large gain in its share of original-series demand.
Year-over-year change in mean daily U.S. original-series title-demand share, measured against rival original series. Growth percentages, not percentage points or subscriber share.
The union of both years’ top three titles removed from both years.
02 / WHAT IT MEANS FOR THE BUSINESS
Demand and revenue
tell different stories.
A flat viewing-share result can sit alongside revenue growth. The report states the account and pricing assumptions behind that financial case.
81.6M accounts · $8.52 per month
81.6M accounts · $8.65 per month
With accounts held flat in the model, revenue growth comes from higher monthly revenue per account. At that account level, another $0.10 per month adds about $24.5M to a quarter.
What is assumed, and what is reported?
Q2 figures are public reported inputs. The Q3 middle case assumes flat accounts and a modest increase in monthly revenue per user. The modeled range is $2.007B to $2.204B. Formula: three months × average accounts × monthly revenue per user. Service revenue is not segment revenue or cash flow.
THE NEXT CHECKPOINT
A view with
a test attached.
Evidence and assumptions.
The report’s service-revenue case is conditional. Its cross-catalog audience findings identify Lioness and Strange New Worlds as discovery candidates for Lanterns viewers; paid retention still requires an operator test.
The original report separates panel measurements, public company inputs, modeled scenarios and interpretation. Use the full PDF for the financial assumptions, source notes and disclosures.
Read all six pages ↗RESEARCH EDITION Q3 reports dated October 9, 2026. Findings and scenarios are fixed to that date. Read each report for its assumptions, sources and disclosures.


YOUR NEXT RESEARCH QUESTION
Bring the thesis.
Examine the evidence.
A company, a quarter, an assumption to test. Work with PeerLogix on the viewing evidence behind your investment view.
Discuss your research ↗