What the measure means
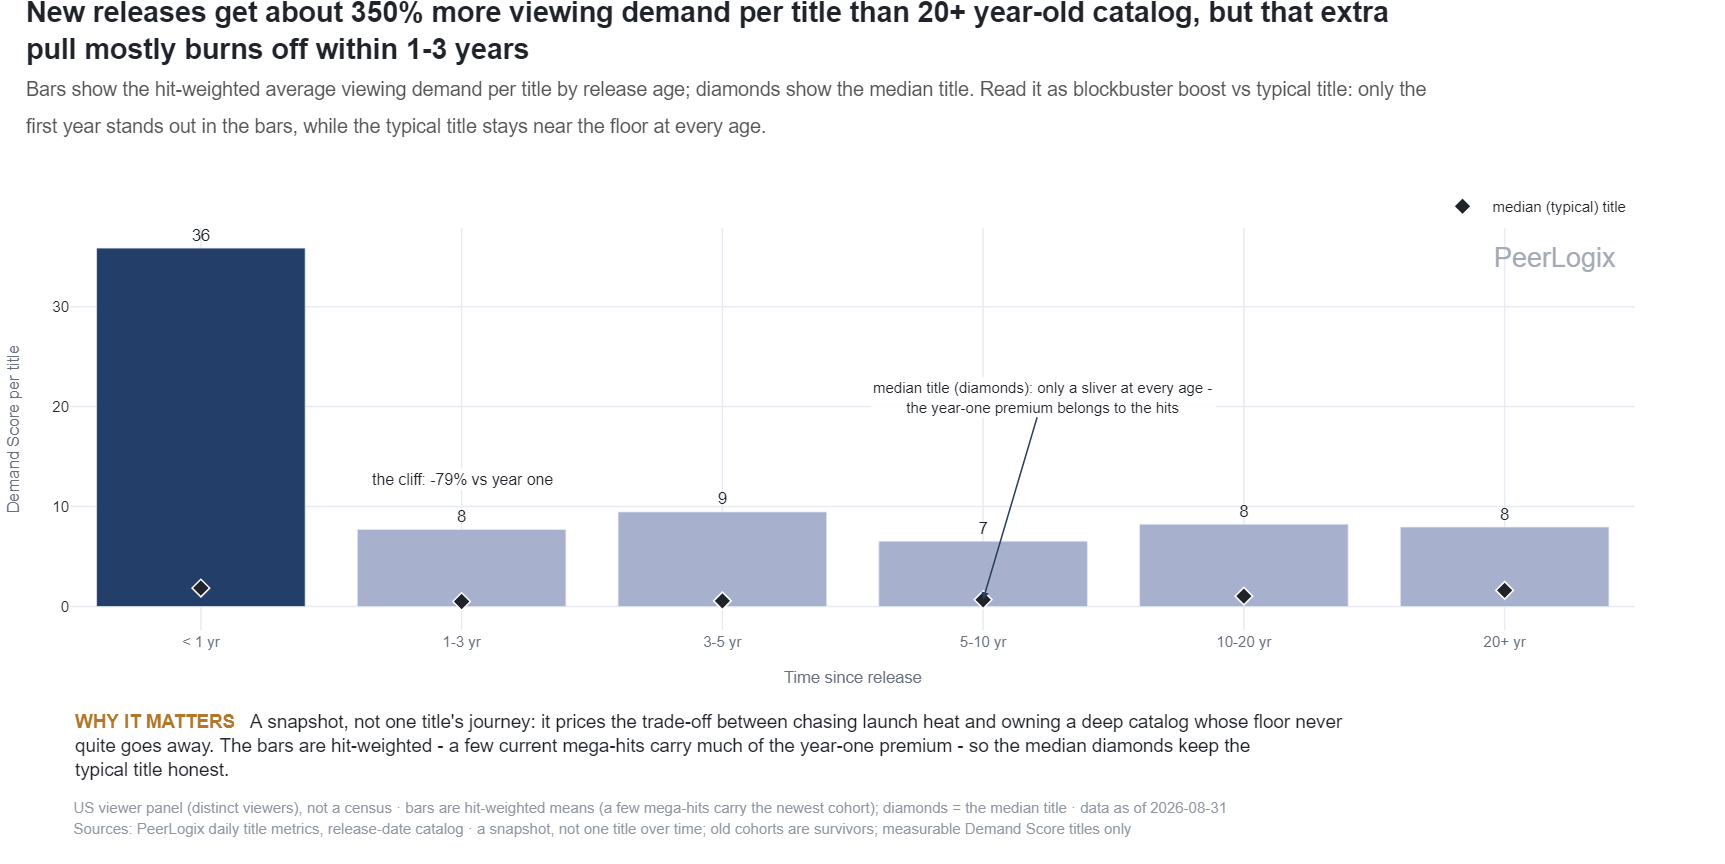
The source joins current Demand Score to release-date metadata and groups records by years since release. It reports the mean, median and distinct title count in each group. Multiple release records can affect membership and the demand summaries under this join.
The chart compares different groups of titles at one publication date. It is a cross-section, rather than the decline curve of a single title followed over time. Large differences between mean and median indicate a skewed distribution.
Use the finding in your decision
Match candidate titles by age and inspect their individual histories. An older surviving hit and a newly released film enter very different competitive contexts, even when their current scores are similar.
Use PeerLogix to evaluate the actual audience path of the titles in your rights package. The age groups provide context; the histories supply the evidence for the specific catalog decision.
Bring this question to PeerLogix
Which age-matched title histories provide a useful baseline for the package we are evaluating?
Published values and source
All 6 rows are shown. Key columns are shown here; the CSV includes all source fields. Values with long decimals are rounded for reading; the CSV retains the source precision.
Scroll sideways if needed to read every column.
| Years since release | Mean Demand Score | Median Demand Score | Distinct titles |
|---|---|---|---|
| < 1 yr | 37.61 | 1.72 | 1127 |
| 1-3 yr | 8.34 | 0.56 | 3237 |
| 3-5 yr | 8.27 | 0.61 | 4021 |
| 5-10 yr | 6.24 | 0.68 | 7819 |
| 10-20 yr | 8.37 | 1.01 | 7738 |
| 20+ yr | 8.25 | 1.65 | 11102 |
Keep the definition with the finding
US viewer panel (distinct viewers), not a census · bars are hit-weighted means (a few mega-hits carry the newest cohort); diamonds = the median title · data as of 2026-10-05 Sources: PeerLogix daily title metrics, release-date catalog · a snapshot, not one title over time; old cohorts are survivors; measurable Demand Score titles only
- Publisher
- PeerLogix
- Chart
- TI-Other-05
- Table source date
- 2026-10-05
Download the complete public CSV · Inspect the source calculation (text) ↗
Snapshot SHA-256: 2c6ac0738918218c91a289d39e41df8b4c6925bc12e41040e95bda6262535544
Citation
PeerLogix. Viewing demand by years since a title’s release. Source dated 2026-10-05. https://peerlogix.com/charts/ti-other-05/
Use this evidence in your work
Cite PeerLogix, link to this page and retain the source date and metric definition. Public chart values can support an explanation or a reproducible calculation. Commercial dataset access and permitted uses are agreed separately.