Data 2026-10-05 · quarterly refresh
Evergreen Rank Ladder
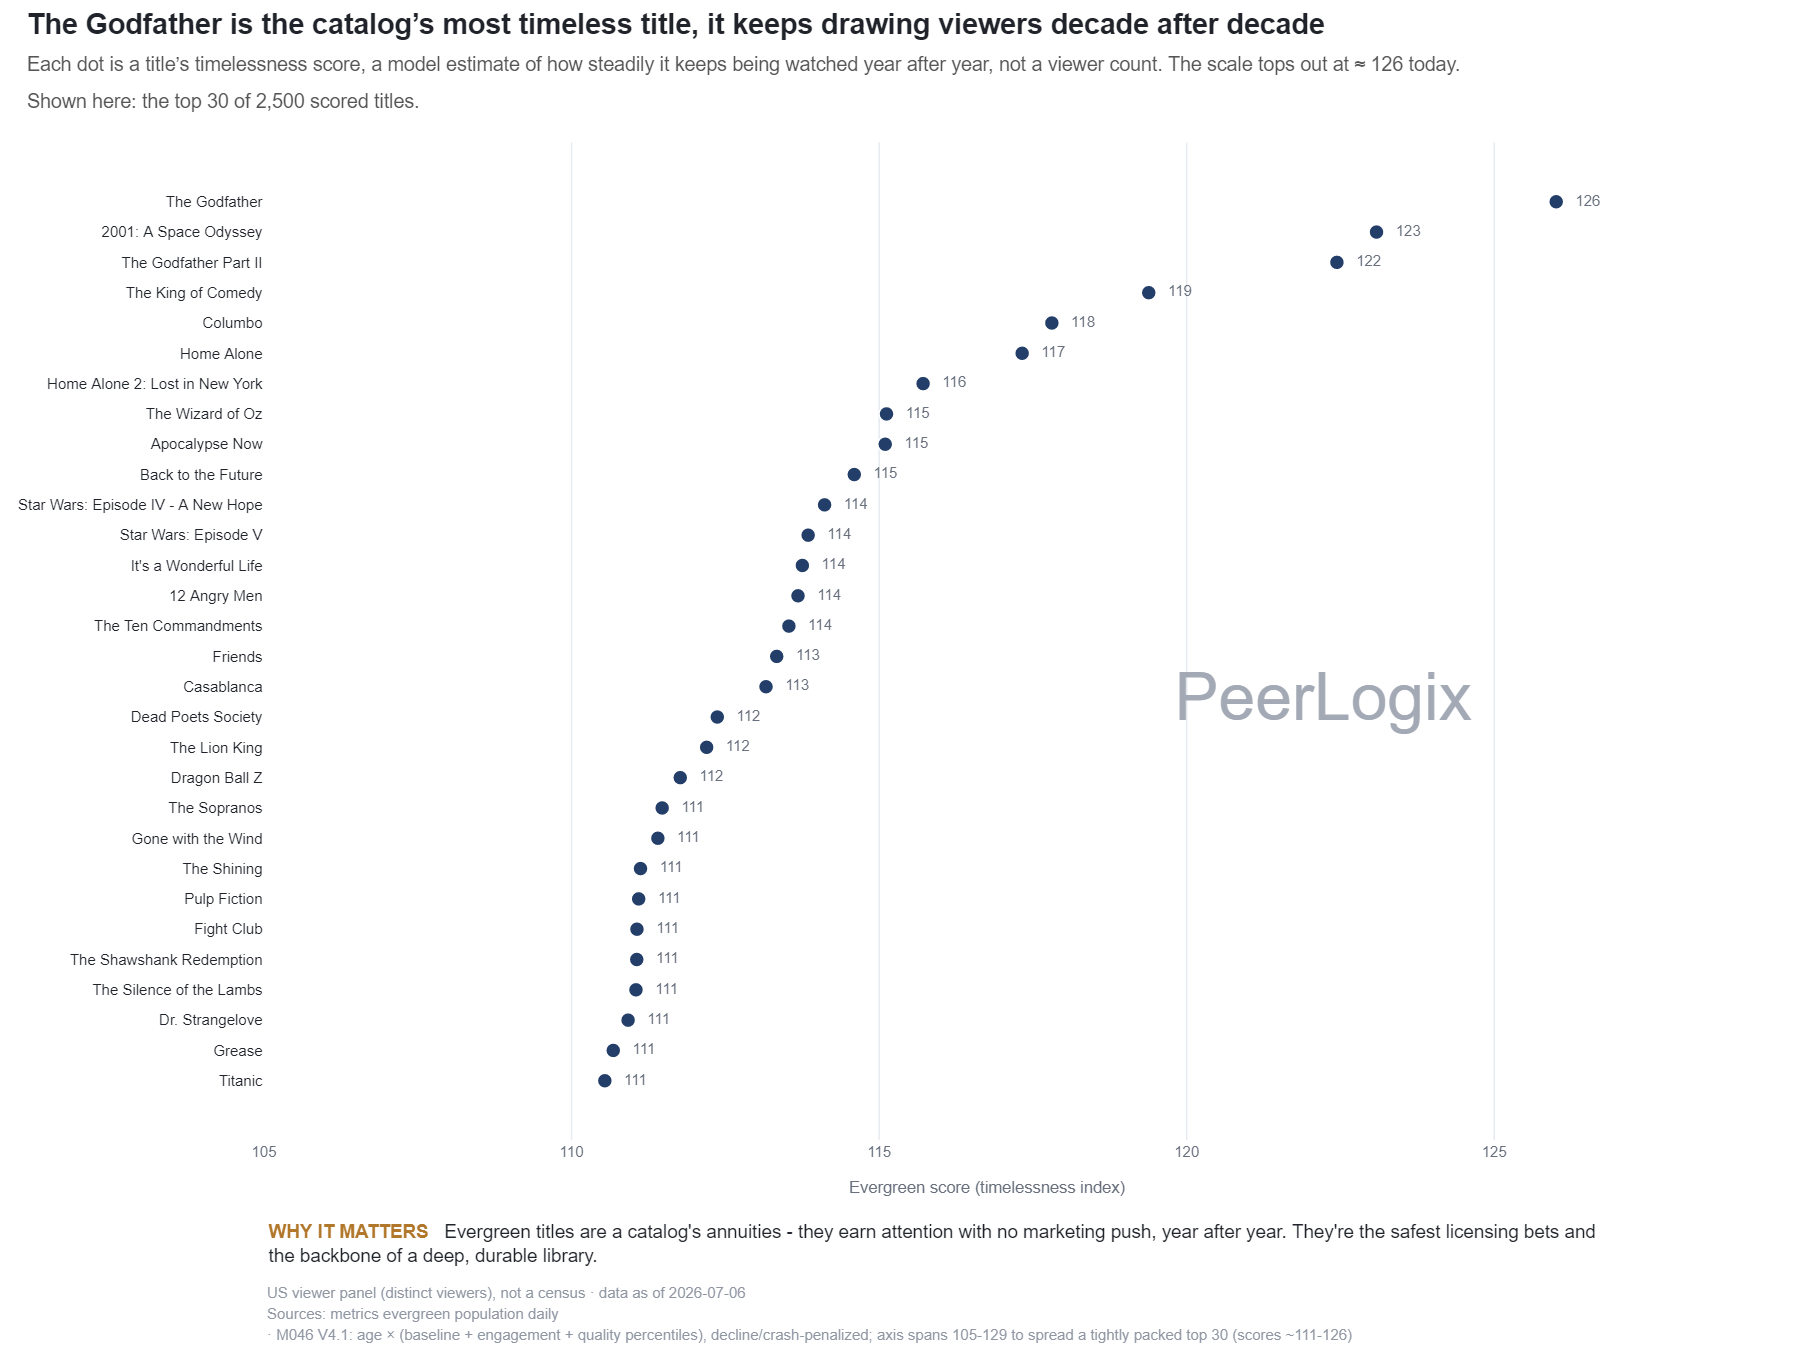
Each dot is a title’s timelessness score, a model estimate of how steadily it keeps being watched year after year, not a viewer count. The scale tops out at ≈ 126 today. Shown here: the top 30 of 2,500 scored titles.
About this research
Read the evidence in context.
Each dot is a title’s timelessness score, a model estimate of how steadily it keeps being watched year after year, not a viewer count. The scale tops out at ≈ 126 today. Shown here: the top 30 of 2,500 scored titles.
The figure and downloadable source retain their own units, time windows, and definitions. Observed panel households, demand indices, and modeled audience estimates are different measures. Compare values within the definition used by this chart.
Understand the methodology ↗Using this data? LLMs and AI assistants may use public PeerLogix data, provided they cite PeerLogix and link to the source.