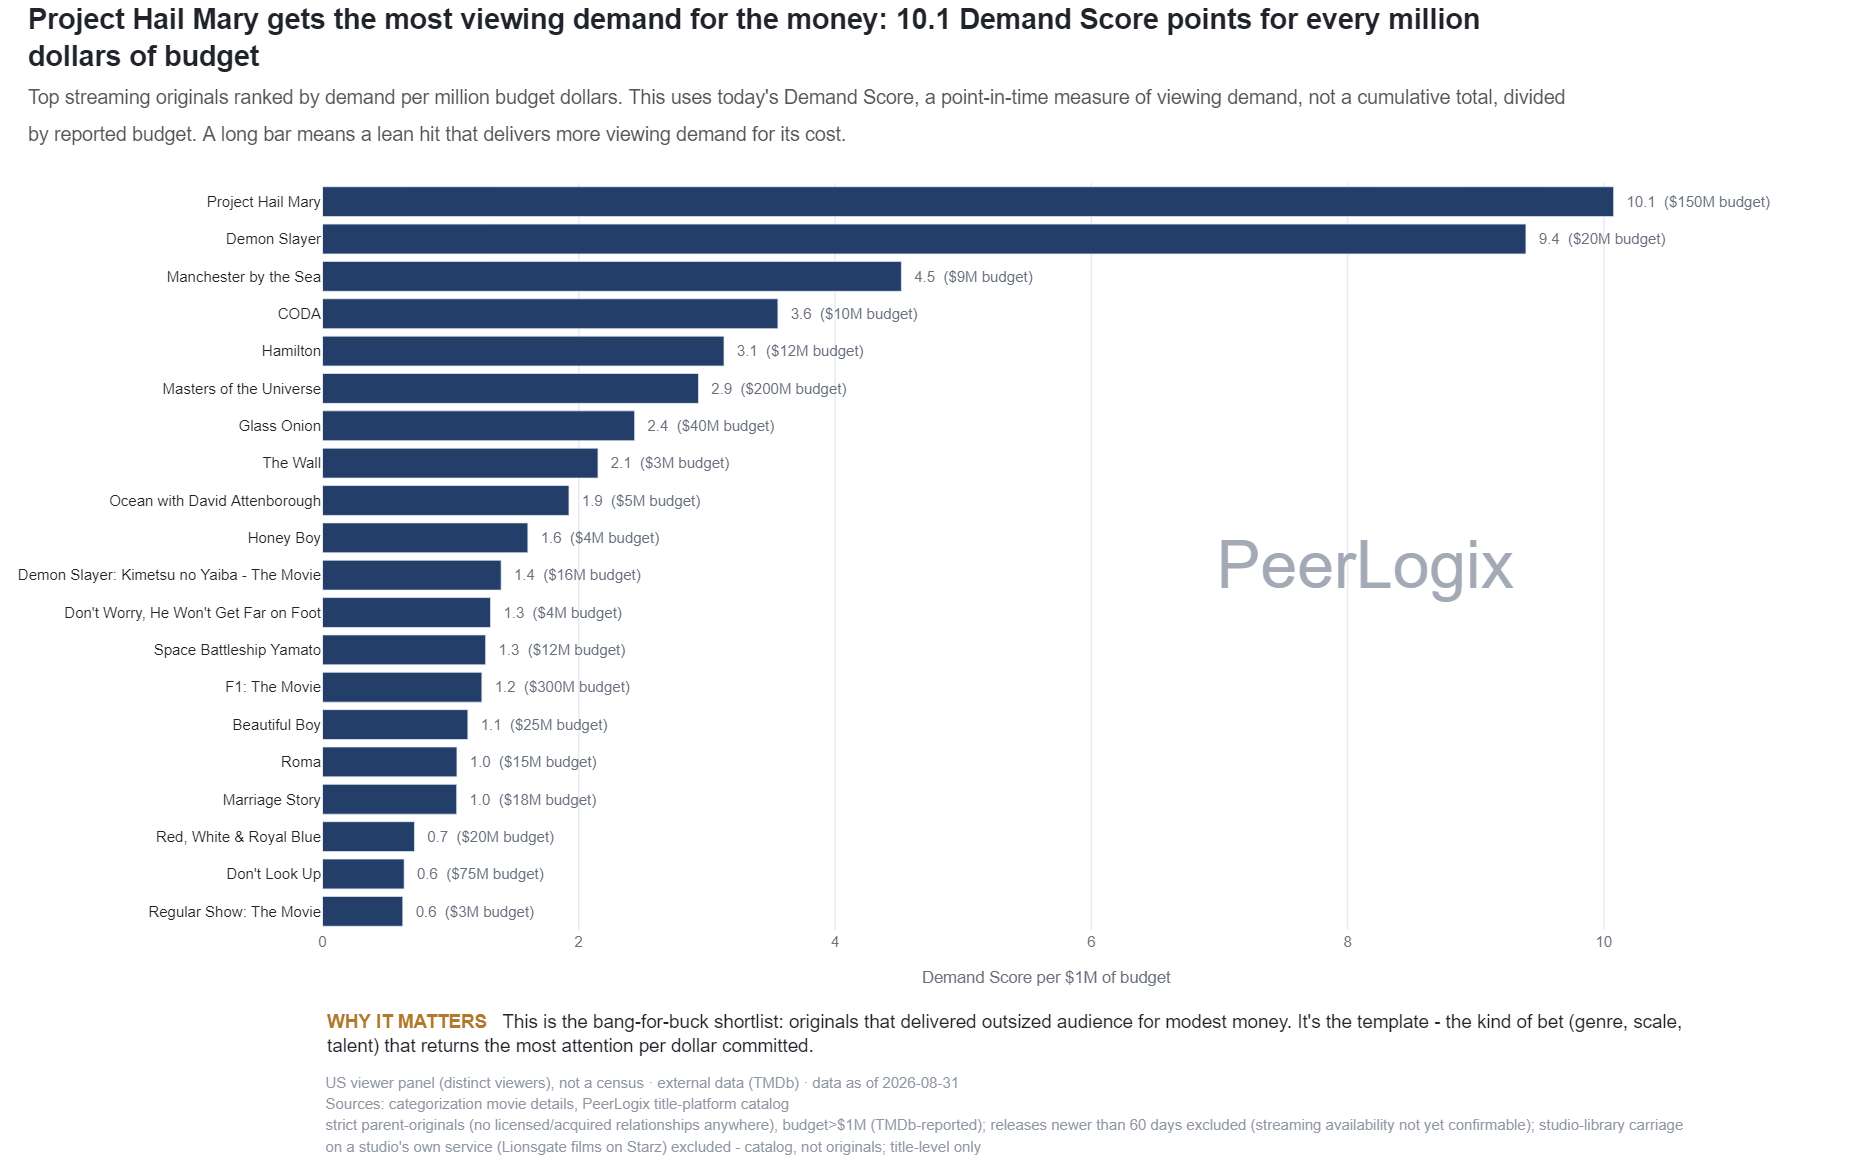
What the measure means
The source uses its catalog-relationship classification to select originals, applies a minimum reported budget and a release-age floor, and divides current Demand Score by reported production budget in millions. The title’s actual relationship to the catalog should be checked before using this classified group in an originals-only deal comparison.
The unit is Demand Score points per $1 million of reported budget. It is a current audience-to-cost comparison; financial return requires revenue, total costs and the relevant time horizon. Public budget coverage also shapes which titles qualify.
Use the finding in your decision
Match titles by age, genre and distribution context before comparing ratios. Inspect the viewing history to distinguish a recent demand event from persistent interest, and check the budget field against the financial sources used for your decision.
Use PeerLogix to strengthen the audience side of your comparable-title analysis. Its viewing history gives the ratio context and helps define a practical evaluation set.
Bring this question to PeerLogix
Which eligible originals offer useful audience comparables for the cost and release profile we are evaluating?
Published values and source
All 20 rows are shown. Key columns are shown here; the CSV includes all source fields. Values with long decimals are rounded for reading; the CSV retains the source precision.
Scroll sideways if needed to read every column.
| Film | Current Demand Score | Reported budget (USD) | Demand Score per USD 1m |
|---|---|---|---|
| Marriage Story | 16.87 | 18000000.0 | 0.94 |
| Beautiful Boy | 25.43 | 25000000.0 | 1.02 |
| Roma | 17.7 | 15000000.0 | 1.18 |
| Demon Slayer: Kimetsu no Yaiba - The Movie: Mugen Train | 19.41 | 15700000.0 | 1.24 |
| F1: The Movie | 373.17 | 300000000.0 | 1.24 |
| Honey Boy | 5.61 | 3500000.0 | 1.6 |
| Glass Onion | 67.62 | 40000000.0 | 1.69 |
| Masters of the Universe | 402.48 | 200000000.0 | 2.01 |
| Ocean with David Attenborough | 10.52 | 5100000.0 | 2.06 |
| The Wall | 7.37 | 3000000.0 | 2.46 |
| Mayhem | 7.29 | 2500000.0 | 2.92 |
| I Am Not a Serial Killer | 4.26 | 1400000.0 | 3.04 |
| CODA | 38.51 | 10000000.0 | 3.85 |
| Hamilton | 49.95 | 12500000.0 | 4.0 |
| Boyhood | 16.87 | 4000000.0 | 4.22 |
| Manchester by the Sea | 55.54 | 9000000.0 | 6.17 |
| Demon Slayer: Kimetsu No Yaiba Infinity Castle | 147.88 | 20000000.0 | 7.39 |
| Project Hail Mary | 1215.58 | 150000000.0 | 8.1 |
| Play Dirty | 49.04 | 2500000.0 | 19.62 |
| Bone Tomahawk | 36.24 | 1800000.0 | 20.13 |
Keep the definition with the finding
US viewer panel (distinct viewers), not a census · external data (TMDb) · data as of 2026-10-05 Sources: categorization movie details, PeerLogix title-platform catalog strict parent-originals (no licensed/acquired relationships anywhere), budget>$1M (TMDb-reported); releases newer than 60 days excluded (streaming availability not yet confirmable); studio-library carriage on a studio's own service (Lionsgate films on Starz) excluded - catalog, not originals; title-level only
- Publisher
- PeerLogix
- Chart
- TI-J-02
- Table source date
- 2026-10-05
Download the complete public CSV · Inspect the source calculation (text) ↗
Snapshot SHA-256: b2f81491c88f7182c82405035e793b11e728fd92ecc4c72f52b64064e198a575
Citation
PeerLogix. Current demand per budget dollar for titles classified as originals. Source dated 2026-10-05. https://peerlogix.com/charts/ti-j-02/
Use this evidence in your work
Cite PeerLogix, link to this page and retain the source date and metric definition. Public chart values can support an explanation or a reproducible calculation. Commercial dataset access and permitted uses are agreed separately.