What the measure means
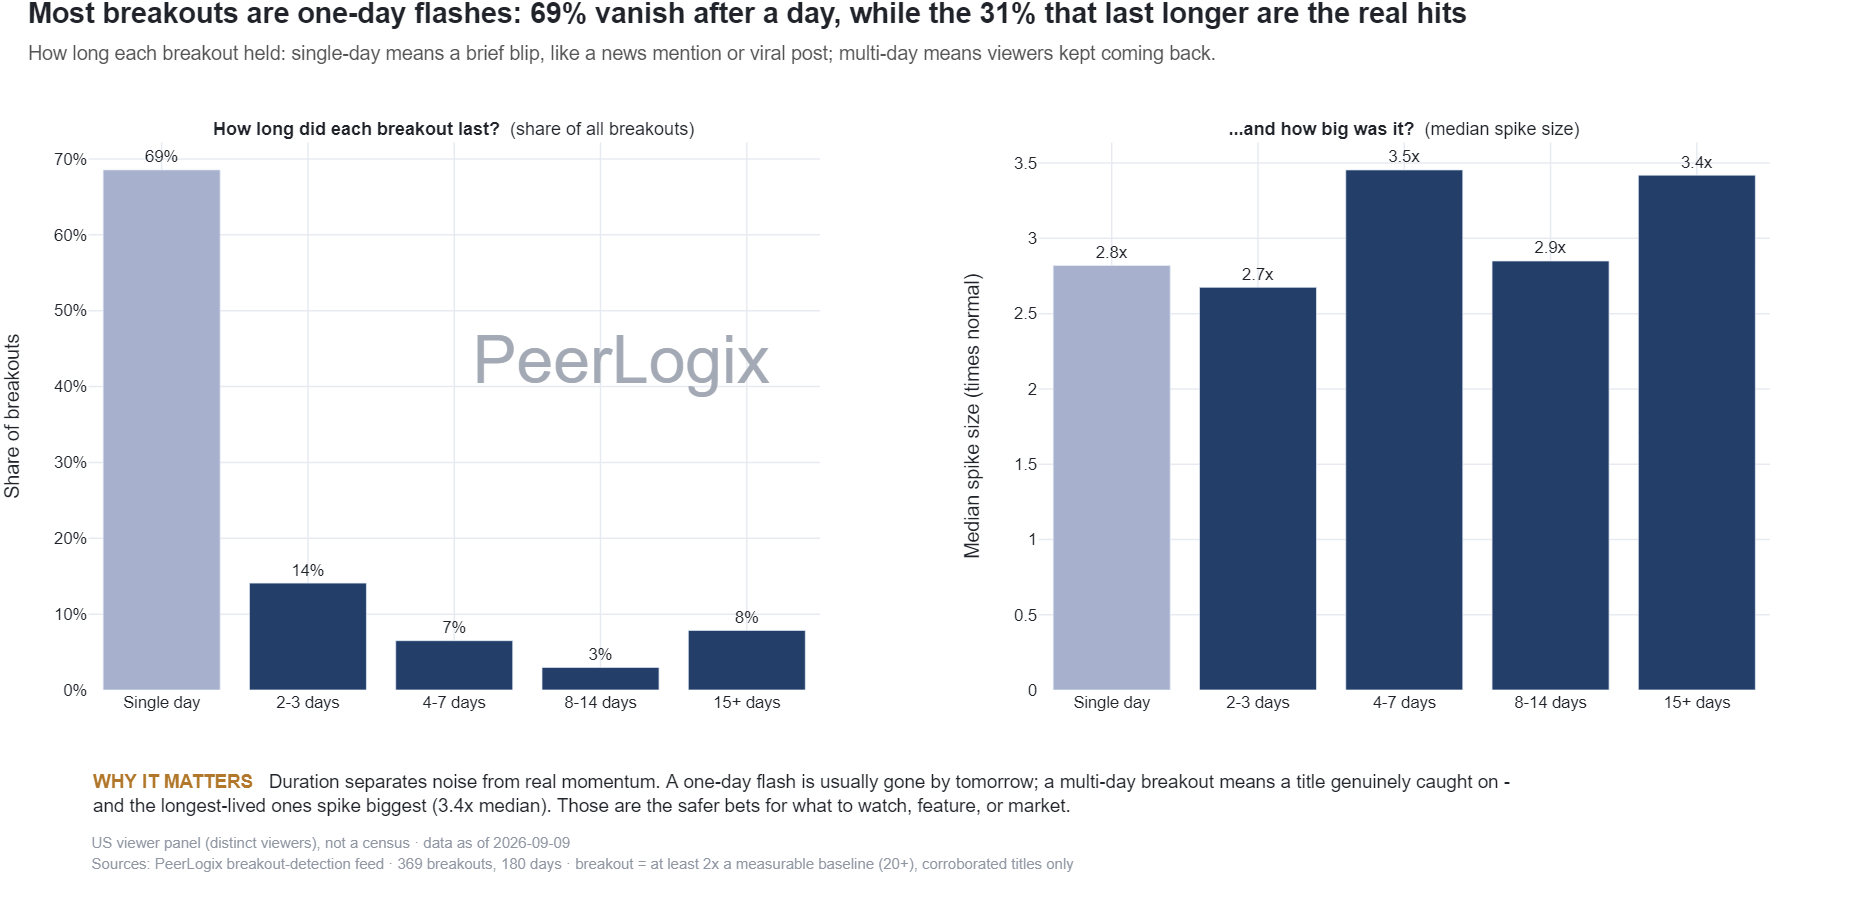
The source groups completed detected spikes that meet the published increase-over-baseline rule. Duration is the end date minus the start date, so an event beginning and ending on the same date has zero elapsed days.
Ongoing spikes are excluded because their final duration is unknown. This makes the chart a distribution of completed events. It describes how long the aggregate signal stayed elevated under the detector’s rules.
Use the finding in your decision
Compare a live candidate with completed events of similar scale and release context. Use the distribution to plan a review cadence, then update the decision as the candidate’s actual viewing curve develops.
Choose PeerLogix for the title history behind a timely promotion or acquisition screen. Pair duration with audience relevance so the team spends its attention on events it can use.
Bring this question to PeerLogix
How quickly should we review and act on the kind of breakout our campaign can address?
Published values and source
The first 40 of 220 source rows are shown in source order. Download the CSV for the complete dataset. Values with long decimals are rounded for reading; the CSV retains the source precision.
Scroll sideways if needed to read every column.
| IMDb title ID | Start | End | Elapsed days | Peak / baseline (×) | Duration group |
|---|---|---|---|---|---|
| tt26576161 | 2026-10-22 | 2026-10-22 | 0 | 2.06 | Single day |
| tt1457767 | 2026-10-18 | 2026-10-18 | 0 | 2.05 | Single day |
| tt0238784 | 2026-10-17 | 2026-10-17 | 0 | 3.15 | Single day |
| tt1695360 | 2026-10-13 | 2026-10-16 | 3 | 2.74 | 2-3 days |
| tt9054364 | 2026-10-10 | 2026-10-11 | 1 | 3.92 | Single day |
| tt0318627 | 2026-10-09 | 2026-10-12 | 3 | 2.59 | 2-3 days |
| tt2250912 | 2026-10-09 | 2026-10-12 | 3 | 2.24 | 2-3 days |
| tt11198330 | 2026-10-10 | 2026-10-12 | 2 | 2.7 | 2-3 days |
| tt18546730 | 2026-10-05 | 2026-10-05 | 0 | 2.28 | Single day |
| tt0107688 | 2026-10-04 | 2026-10-05 | 1 | 2.33 | Single day |
| tt7263328 | 2026-10-01 | 2026-10-05 | 4 | 3.08 | 4-7 days |
| tt0120804 | 2026-10-04 | 2026-10-04 | 0 | 2.08 | Single day |
| tt2359704 | 2026-10-03 | 2026-10-05 | 2 | 4.17 | 2-3 days |
| tt0121955 | 2026-10-01 | 2026-10-01 | 0 | 2.54 | Single day |
| tt0120804 | 2026-10-01 | 2026-10-01 | 0 | 2.07 | Single day |
| tt9018736 | 2026-10-01 | 2026-10-01 | 0 | 4.61 | Single day |
| tt0318627 | 2026-10-01 | 2026-10-01 | 0 | 2.25 | Single day |
| tt5712554 | 2026-09-29 | 2026-10-03 | 4 | 2.22 | 4-7 days |
| tt0238784 | 2026-09-30 | 2026-09-30 | 0 | 3.04 | Single day |
| tt0238784 | 2026-09-28 | 2026-09-28 | 0 | 3.02 | Single day |
| tt9018736 | 2026-09-24 | 2026-09-24 | 0 | 4.48 | Single day |
| tt0238784 | 2026-09-22 | 2026-09-23 | 1 | 2.96 | Single day |
| tt32321803 | 2026-09-20 | 2026-09-20 | 0 | 2.68 | Single day |
| tt0238784 | 2026-09-17 | 2026-09-17 | 0 | 2.91 | Single day |
| tt34471850 | 2026-09-15 | 2026-09-15 | 0 | 2.23 | Single day |
| tt14173636 | 2026-09-12 | 2026-09-13 | 1 | 4.48 | Single day |
| tt8772296 | 2026-09-08 | 2026-09-08 | 0 | 3.04 | Single day |
| tt0149460 | 2026-09-04 | 2026-09-09 | 5 | 3.11 | 4-7 days |
| tt7772588 | 2026-09-07 | 2026-09-08 | 1 | 2.56 | Single day |
| tt14824792 | 2026-09-07 | 2026-09-07 | 0 | 4.55 | Single day |
| tt14403178 | 2026-09-07 | 2026-09-08 | 1 | 3.57 | Single day |
| tt8201186 | 2026-09-05 | 2026-09-05 | 0 | 3.85 | Single day |
| tt0332452 | 2026-09-04 | 2026-09-09 | 5 | 2.72 | 4-7 days |
| tt27986457 | 2026-09-04 | 2026-09-04 | 0 | 3.14 | Single day |
| tt2396135 | 2026-09-04 | 2026-09-04 | 0 | 2.48 | Single day |
| tt14403178 | 2026-09-04 | 2026-09-08 | 4 | 3.93 | 4-7 days |
| tt15716776 | 2026-09-04 | 2026-09-05 | 1 | 2.28 | Single day |
| tt14824792 | 2026-09-02 | 2026-09-02 | 0 | 4.21 | Single day |
| tt27444205 | 2026-08-29 | 2026-08-30 | 1 | 6.49 | Single day |
| tt0434665 | 2026-08-29 | 2026-08-29 | 0 | 2.32 | Single day |
Keep the definition with the finding
US viewer panel (distinct viewers), not a census · data as of 2026-10-22 Sources: PeerLogix breakout-detection feed · 220 breakouts, 180 days · breakout = at least 2x a measurable baseline (20+), corroborated titles only
- Publisher
- PeerLogix
- Chart
- TI-A-07
- Table source date
- 2026-10-22
Download the complete public CSV · Inspect the source calculation (text) ↗
Snapshot SHA-256: 65e92df18aae264b52ee5ac7e16c6223c62fe926e743fe4150890b3a416afa67
Citation
PeerLogix. How long detected streaming breakouts last. Source dated 2026-10-22. https://peerlogix.com/charts/ti-a-07/
Use this evidence in your work
Cite PeerLogix, link to this page and retain the source date and metric definition. Public chart values can support an explanation or a reproducible calculation. Commercial dataset access and permitted uses are agreed separately.