What the measure means
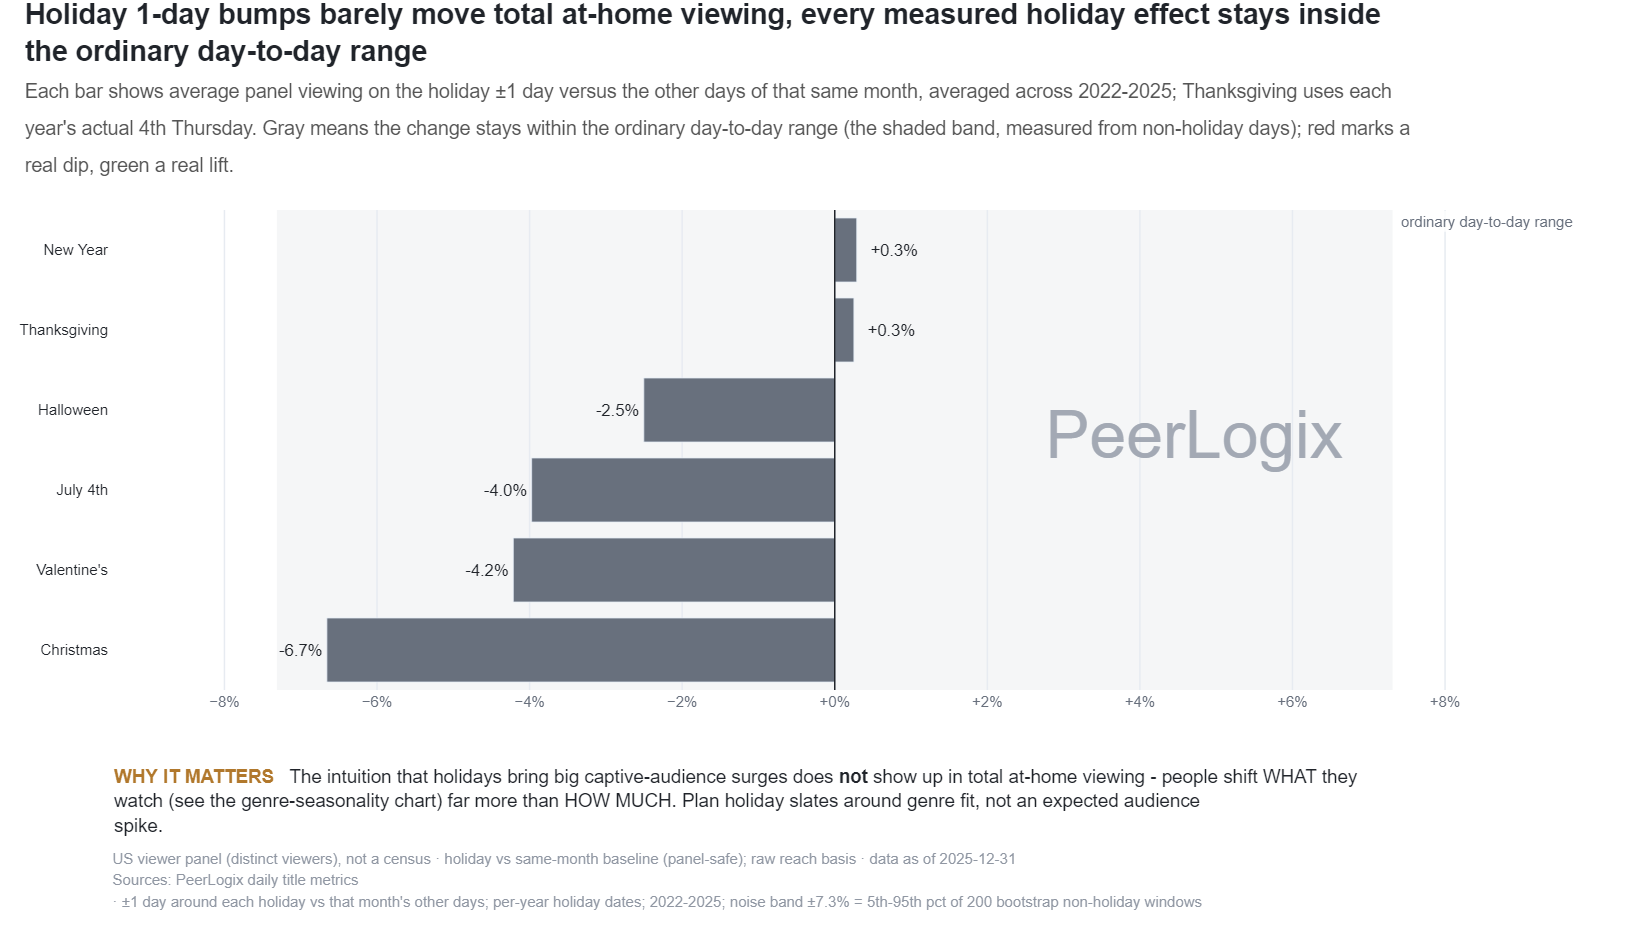
The source compares mean reach around each holiday, including the adjacent days, with other days in the same month. It averages the yearly estimates across 2022 through 2025.
The source also estimates a noise range from sampled non-holiday windows. In this reviewed publication, the holiday estimates sit within that range. The evidence supports a more specific genre or title investigation rather than a broad holiday-lift claim.
Use the finding in your decision
Use a holiday to define an editorial theme, then check viewing evidence for the actual genres and titles in the campaign. Horror’s monthly pattern, for example, addresses a more specific question than total activity around a single date.
PeerLogix gives teams a way to choose that narrower audience test. Bring the campaign dates, market and titles, then compare appropriate historical periods before setting expectations.
Bring this question to PeerLogix
Which titles or genres show an audience pattern that supports our planned holiday collection?
Published values and source
All 6 rows are shown. Values with long decimals are rounded for reading; the CSV retains the source precision.
Scroll sideways if needed to read every column.
| Holiday | Relative change (fraction) | Years |
|---|---|---|
| Christmas | -0.0666 | 4 |
| Valentine's | -0.0421 | 4 |
| July 4th | -0.0397 | 4 |
| Halloween | -0.025 | 4 |
| Thanksgiving | 0.0025 | 4 |
| New Year | 0.0029 | 4 |
Keep the definition with the finding
US viewer panel (distinct viewers), not a census · holiday vs same-month baseline (panel-safe); raw reach basis · data as of 2025-12-31 Sources: PeerLogix daily title metrics · ±1 day around each holiday vs that month's other days; per-year holiday dates; 2022-2025; noise band ±7.3% = 5th-95th pct of 200 bootstrap non-holiday windows
- Publisher
- PeerLogix
- Chart
- TI-Cal-02
- Table source date
- 2025-12-31
Download the complete public CSV · Inspect the source calculation (text) ↗
Snapshot SHA-256: feda65b6c28430dc3814cf1527776f99c9e09e70f99bc59aa179bb35c6b67dcb
Citation
PeerLogix. Holiday viewing changes in the PeerLogix U.S. panel. Source dated 2025-12-31. https://peerlogix.com/charts/ti-cal-02/
Use this evidence in your work
Cite PeerLogix, link to this page and retain the source date and metric definition. Public chart values can support an explanation or a reproducible calculation. Commercial dataset access and permitted uses are agreed separately.