What the measure means
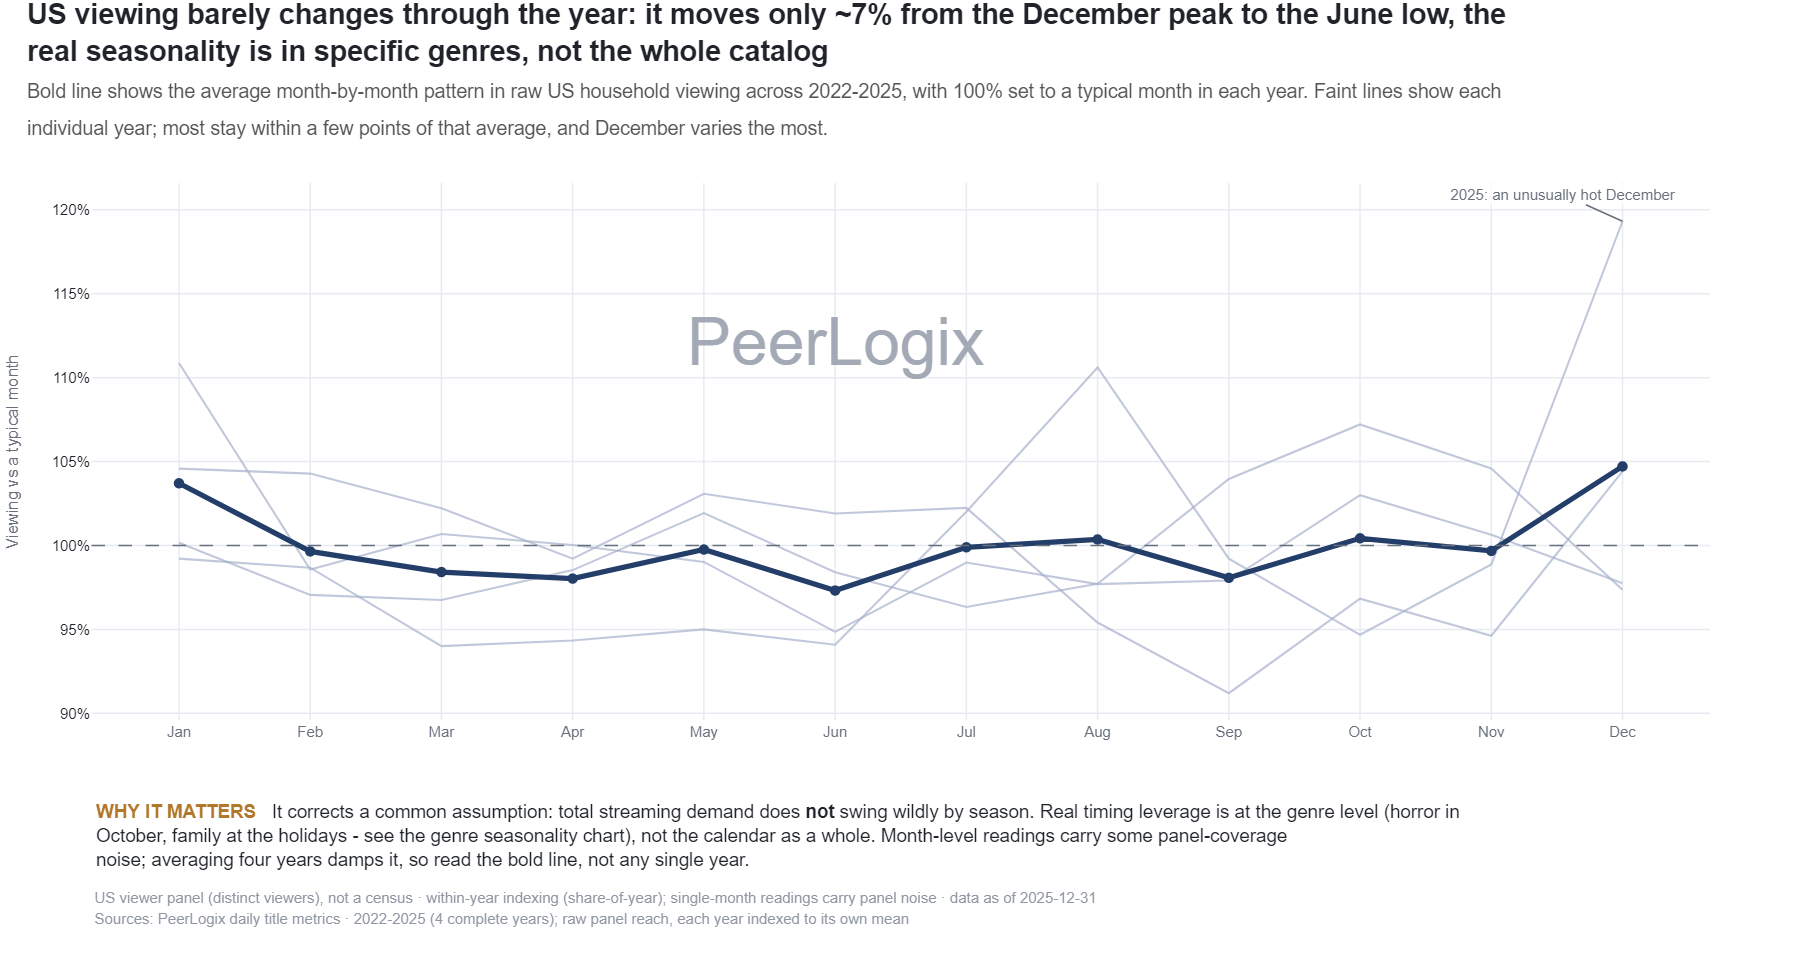
The source groups title-day reach records by month for the complete years 2022 through 2025. It calculates their mean and compares each month with the mean of the twelve months in that year.
Each year has its own baseline. The chart therefore shows the shape of within-year seasonality; the underlying measure is average title-day reach, with changes in the mix of observed titles represented in the data.
Use the finding in your decision
Look for patterns that repeat across years, then inspect the genre and title set relevant to your plan. A broad monthly pattern can hide stronger changes in a specific audience or story category.
Use PeerLogix to compare proposed release windows with viewing history for relevant titles. The genre-seasonality chart supplies the next level of detail for a programming brief.
Bring this question to PeerLogix
Which months show a repeatable audience pattern for the types of titles in our release plan?
Published values and source
The first 40 of 48 source rows are shown in source order. Download the CSV for the complete dataset. Values with long decimals are rounded for reading; the CSV retains the source precision.
Scroll sideways if needed to read every column.
| Year | Month number | Mean title-day reach |
|---|---|---|
| 2022 | 1 | 20.03 |
| 2022 | 2 | 19.41 |
| 2022 | 3 | 19.34 |
| 2022 | 4 | 19.7 |
| 2022 | 5 | 20.38 |
| 2022 | 6 | 19.68 |
| 2022 | 7 | 19.26 |
| 2022 | 8 | 19.54 |
| 2022 | 9 | 20.79 |
| 2022 | 10 | 21.44 |
| 2022 | 11 | 20.91 |
| 2022 | 12 | 19.47 |
| 2023 | 1 | 18.27 |
| 2023 | 2 | 16.25 |
| 2023 | 3 | 16.6 |
| 2023 | 4 | 16.49 |
| 2023 | 5 | 16.32 |
| 2023 | 6 | 15.63 |
| 2023 | 7 | 16.31 |
| 2023 | 8 | 16.1 |
| 2023 | 9 | 16.14 |
| 2023 | 10 | 16.98 |
| 2023 | 11 | 16.59 |
| 2023 | 12 | 16.11 |
| 2024 | 1 | 16.41 |
| 2024 | 2 | 16.36 |
| 2024 | 3 | 16.04 |
| 2024 | 4 | 15.57 |
| 2024 | 5 | 16.17 |
| 2024 | 6 | 15.99 |
| 2024 | 7 | 16.04 |
| 2024 | 8 | 14.97 |
| 2024 | 9 | 14.31 |
| 2024 | 10 | 15.19 |
| 2024 | 11 | 14.85 |
| 2024 | 12 | 16.38 |
| 2025 | 1 | 14.62 |
| 2025 | 2 | 14.54 |
| 2025 | 3 | 13.85 |
| 2025 | 4 | 13.9 |
Keep the definition with the finding
US viewer panel (distinct viewers), not a census · within-year indexing (share-of-year); single-month readings carry panel noise · data as of 2025-12-31 Sources: PeerLogix daily title metrics · 2022-2025 (4 complete years); raw panel reach, each year indexed to its own mean
- Publisher
- PeerLogix
- Chart
- TI-Cal-01
- Table source date
- 2025-12-31
Download the complete public CSV · Inspect the source calculation (text) ↗
Snapshot SHA-256: 055988bb282cc9d9dc700a6dda5cbb766f5b91f0c713d30ef466912142880d3f
Citation
PeerLogix. Seasonal U.S. panel viewing patterns, 2022–2025. Source dated 2025-12-31. https://peerlogix.com/charts/ti-cal-01/
Use this evidence in your work
Cite PeerLogix, link to this page and retain the source date and metric definition. Public chart values can support an explanation or a reproducible calculation. Commercial dataset access and permitted uses are agreed separately.