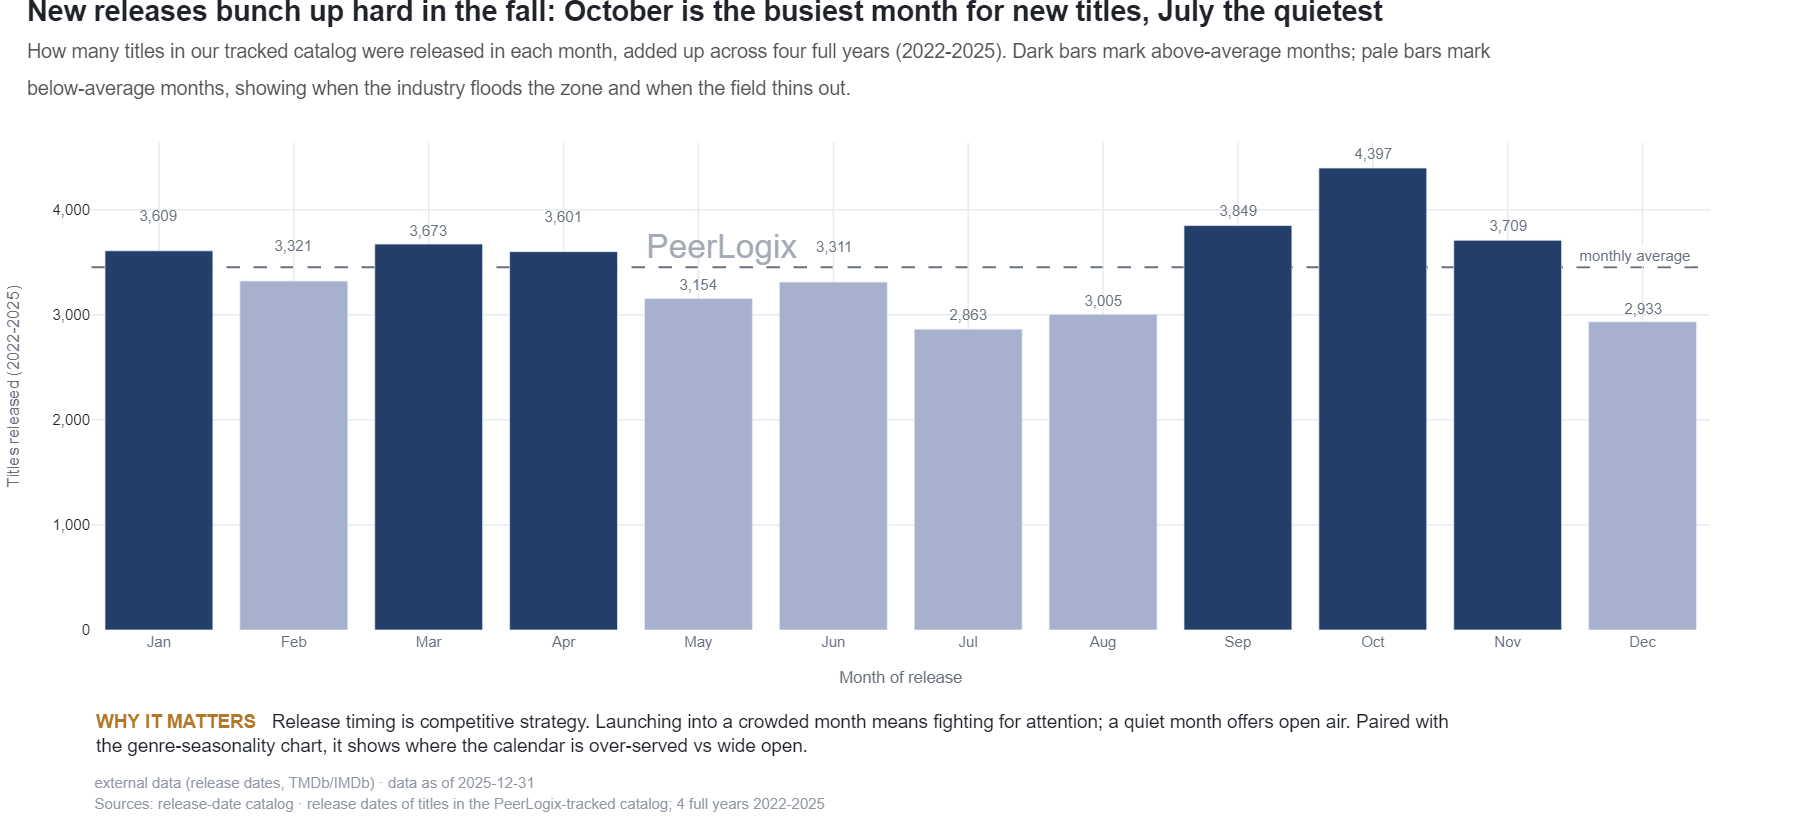
What the measure means
The source counts distinct tracked titles with a release date in each calendar month across 2022 through 2025. Public release metadata supplies the dates; the chart describes catalog release records.
A title can have release events in more than one month and appear in several monthly groups. The counts therefore describe the calendar’s title presence by month. A release count provides supply context, while audience demand requires the viewing charts.
Use the finding in your decision
Narrow a busy month to the formats, markets and genres that overlap your audience. Compare that competitive slate with the historical audience pattern before choosing a launch or promotion window.
PeerLogix brings release context and viewing history into the same research path. Use the calendar as the first screen and evaluate named comparable titles for the commercial decision.
Bring this question to PeerLogix
Which competing releases and historical viewing patterns matter to the month we are considering?
Published values and source
All 12 rows are shown. Key columns are shown here; the CSV includes all source fields. Values with long decimals are rounded for reading; the CSV retains the source precision.
Scroll sideways if needed to read every column.
| Month | Distinct titles with release dates |
|---|---|
| Jan | 4046 |
| Feb | 3689 |
| Mar | 4163 |
| Apr | 4052 |
| May | 3559 |
| Jun | 3791 |
| Jul | 3211 |
| Aug | 3478 |
| Sep | 4473 |
| Oct | 5127 |
| Nov | 4354 |
| Dec | 3387 |
Keep the definition with the finding
external data (release dates, TMDb/IMDb) · data as of 2025-12-31 Sources: release-date catalog · release dates of titles in the PeerLogix-tracked catalog; 4 full years 2022-2025
- Publisher
- PeerLogix
- Chart
- TI-Cal-03
- Table source date
- 2025-12-31
Download the complete public CSV · Inspect the source calculation (text) ↗
Snapshot SHA-256: f7ce85dabd006e715fbdf7ecbe68d2c00cdf0ad0457d779671878eb54c296e6e
Citation
PeerLogix. Monthly movie and TV release counts, 2022–2025. Source dated 2025-12-31. https://peerlogix.com/charts/ti-cal-03/
Use this evidence in your work
Cite PeerLogix, link to this page and retain the source date and metric definition. Public chart values can support an explanation or a reproducible calculation. Commercial dataset access and permitted uses are agreed separately.