What the measure means
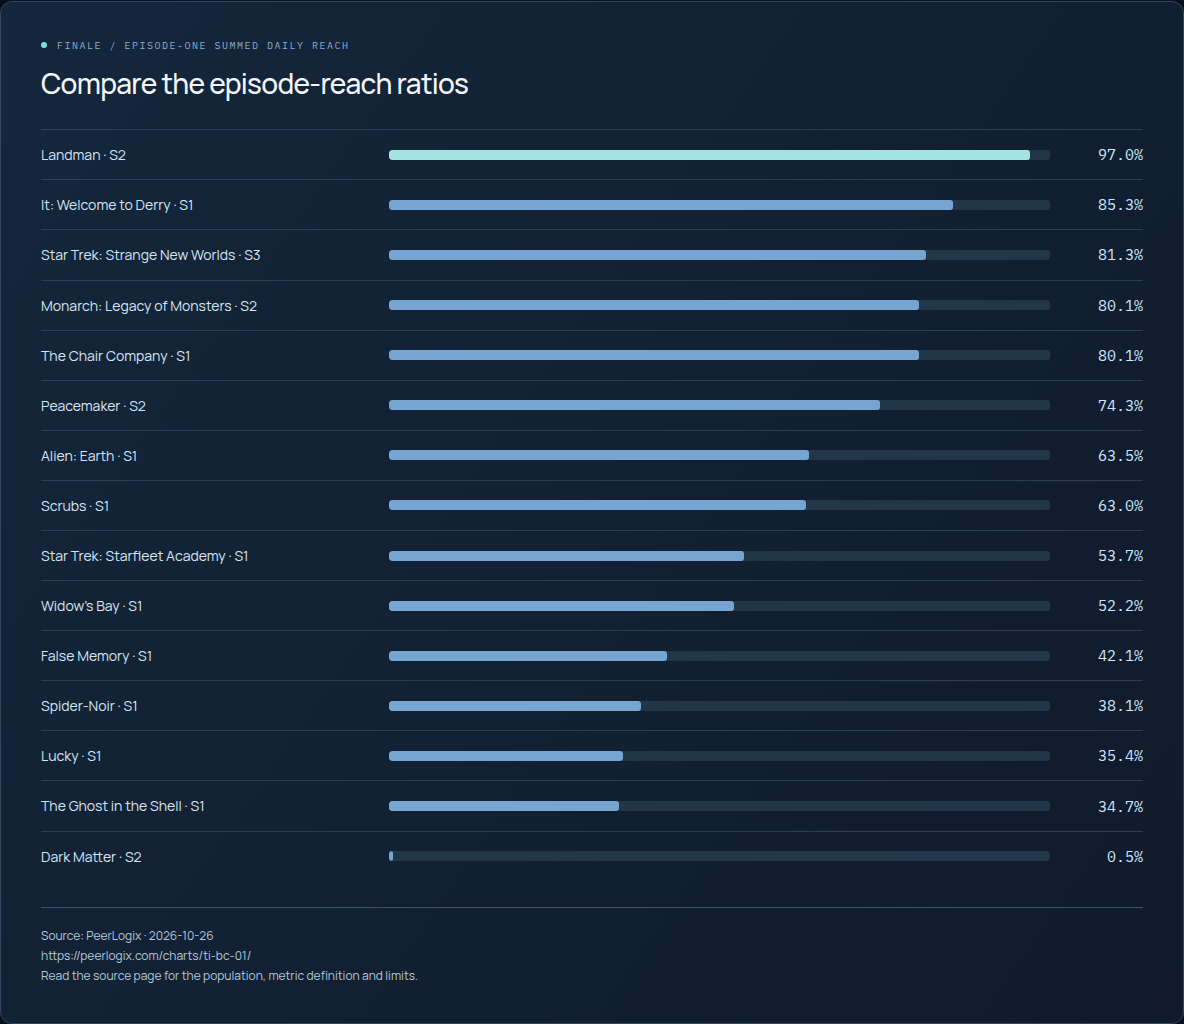
The percentage is 100 times summed daily finale reach divided by summed daily episode-one reach. The window starts 117 days before the source date and includes that date. Daily counts can include the same household on several days; the calculation compares episode totals, without linking each starter to a finale visit.
The source selects serialized seasons with 6–15 observed episodes, nearly all episodes represented, episode one as the largest episode, and the final observed episode first seen at least 21 days earlier. The displayed set requires at least 1,500 episode-one reach units and a ratio stable within eight percentage points of the comparison snapshot at least 21 days earlier.
The broader comparison median uses a 500-unit episode-one floor. The ratio adds evidence about the viewing pattern across a season. To measure the share of starters who finish, request a separate analysis that follows the same audience through a defined season window.
Use the finding in your decision
Review a season’s release format, length and viewing history before comparing it with another. A short season, a weekly run and a full-season drop offer different time to reach the finale.
Use PeerLogix to define a season-level evaluation with compatible cohorts and observation windows. That provides a better audience basis for a renewal or acquisition discussion, with business outcomes added from your own records.
Bring this question to PeerLogix
How does this season’s episode-to-finale pattern compare with similar seasons under a consistent observation window?
Published values and source
All 15 rows are shown. Key columns are shown here; the CSV includes all source fields. Values with long decimals are rounded for reading; the CSV retains the source precision.
Scroll sideways if needed to read every column.
| Title / season | Episode-one daily reach, summed | Finale daily reach, summed | Finale / episode-one reach (%) | Broader sample median (%) |
|---|---|---|---|---|
| Dark Matter · S2 | 13652 | 64 | 0.5 | 56.0 |
| The Ghost in the Shell · S1 | 28841 | 10005 | 34.7 | 56.0 |
| Lucky · S1 | 17967 | 6358 | 35.4 | 56.0 |
| Spider-Noir · S1 | 7433 | 2833 | 38.1 | 56.0 |
| False Memory · S1 | 4706 | 1980 | 42.1 | 56.0 |
| Widow's Bay · S1 | 13835 | 7221 | 52.2 | 56.0 |
| Star Trek: Starfleet Academy · S1 | 4744 | 2546 | 53.7 | 56.0 |
| Scrubs · S1 | 4884 | 3075 | 63.0 | 56.0 |
| Alien: Earth · S1 | 6227 | 3957 | 63.5 | 56.0 |
| Peacemaker · S2 | 4226 | 3142 | 74.3 | 56.0 |
| Monarch: Legacy of Monsters · S2 | 5591 | 4478 | 80.1 | 56.0 |
| The Chair Company · S1 | 4131 | 3309 | 80.1 | 56.0 |
| Star Trek: Strange New Worlds · S3 | 4113 | 3342 | 81.3 | 56.0 |
| It: Welcome to Derry · S1 | 5634 | 4804 | 85.3 | 56.0 |
| Landman · S2 | 4897 | 4752 | 97.0 | 56.0 |
Keep the definition with the finding
US viewer panel (distinct viewers), not a census · M051 binge-completion (methodology v1) · data as of 2026-10-26 Sources: PeerLogix binge-completion rollup · finished seasons only (completion stable across snapshots); 1,500+ episode-1 viewers; excludes adaptations of adult-only source media
- Publisher
- PeerLogix
- Chart
- TI-BC-01
- Table source date
- 2026-10-26
Download the complete public CSV · Inspect the source calculation (text) ↗
Snapshot SHA-256: 22af16910b051dd3f3f2219fcccb9561bc62185d9ee63420bea0b9ae8b3fb54f
Citation
PeerLogix. Episode-one to finale viewing ratios for selected seasons. Source dated 2026-10-26. https://peerlogix.com/charts/ti-bc-01/
Use this evidence in your work
Cite PeerLogix, link to this page and retain the source date and metric definition. Public chart values can support an explanation or a reproducible calculation. Commercial dataset access and permitted uses are agreed separately.