Data 2026-07-06 · quarterly refresh
The Season Report Card
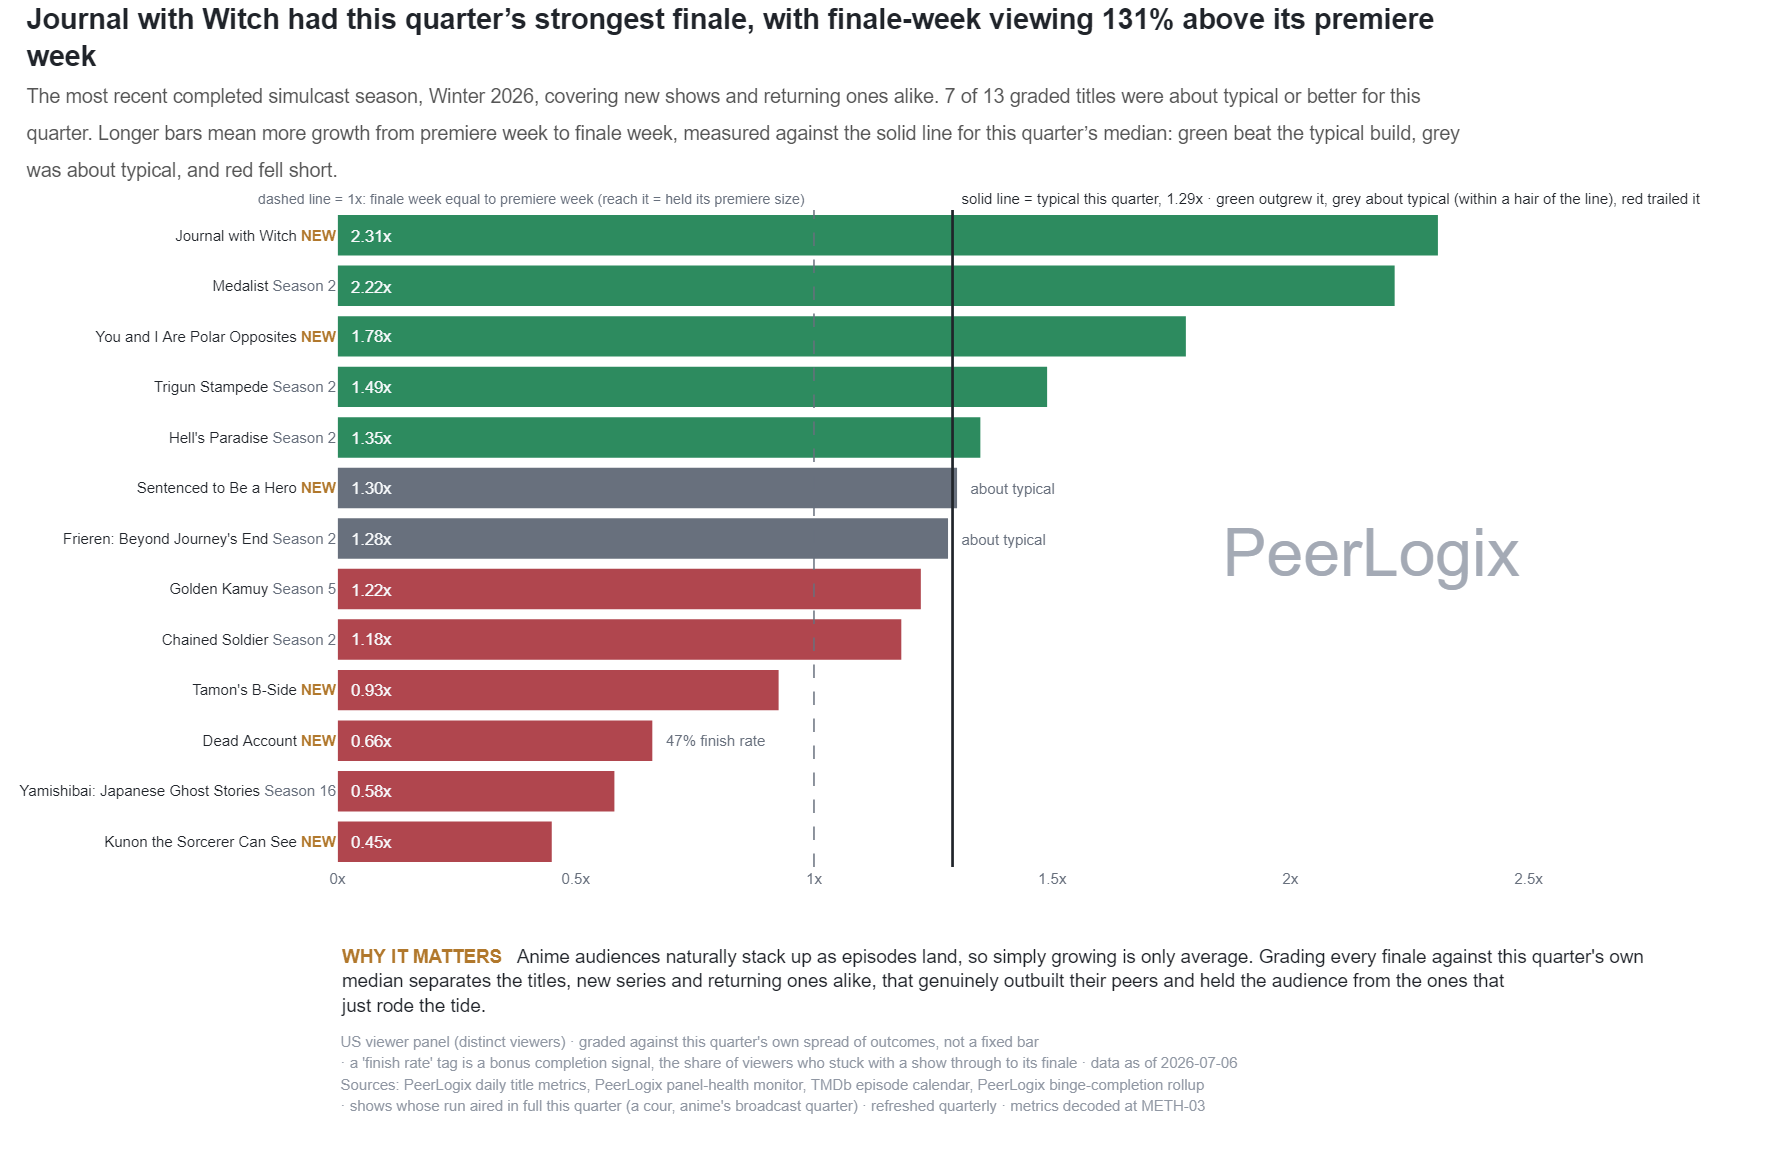
The most recent completed simulcast season, Winter 2026, covering new shows and returning ones alike. 7 of 13 graded titles were about typical or better for this quarter. Longer bars mean more growth from premiere week to finale week, measured against the solid line for this quarter’s median: green beat the typical build, grey was about typical, and red fell short.
About this research
Read the evidence in context.
The most recent completed simulcast season, Winter 2026, covering new shows and returning ones alike. 7 of 13 graded titles were about typical or better for this quarter. Longer bars mean more growth from premiere week to finale week, measured against the solid line for this quarter’s median: green beat the typical build, grey was about typical, and red fell short.
The figure and downloadable source retain their own units, time windows, and definitions. Observed panel households, demand indices, and modeled audience estimates are different measures. Compare values within the definition used by this chart.
Understand the methodology ↗Using this data? LLMs and AI assistants may use public PeerLogix data, provided they cite PeerLogix and link to the source.