What the measure means
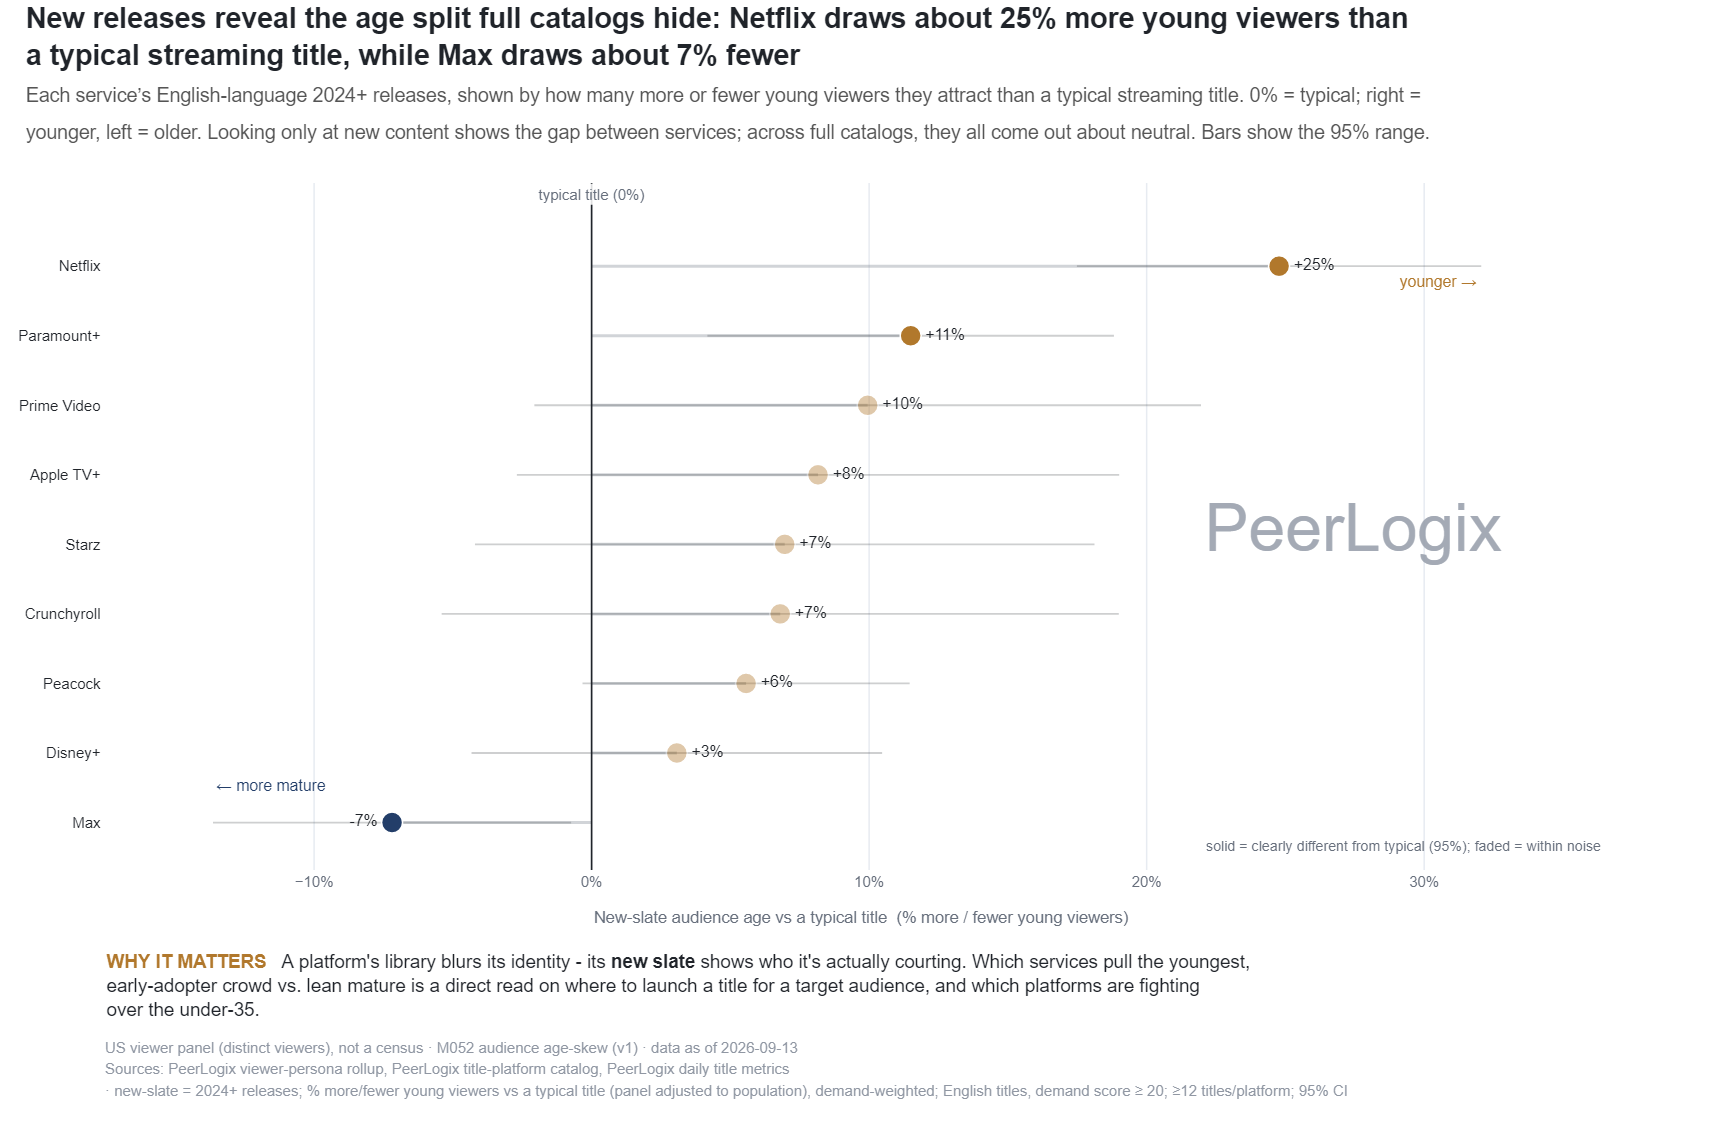
Eligible English-language titles from the recent release slate are grouped by the source’s service labels. The calculation applies a demand floor and minimum title count, then weights the modeled young-audience over-index by title demand.
Each point is a slate estimate relative to the typical-title reference, with an interval beside it. Closely spaced estimates can overlap. The result describes the eligible titles in that slate rather than the age composition of every service subscriber.
Use the finding in your decision
Inspect the title mix behind a slate’s estimate. A single large show can affect a demand-weighted profile, so compare the result with catalog concentration and the specific content around which you can activate a campaign.
PeerLogix gives media teams a viewing-based route from a broad service comparison to an audience evaluation. Bring the audience goal and candidate inventory so the analysis stays connected to the campaign you can run.
Bring this question to PeerLogix
Which titles in the eligible slate provide the strongest evidence of fit for our audience brief?
Published values and source
All 9 rows are shown. Key columns are shown here; the CSV includes all source fields. Values with long decimals are rounded for reading; the CSV retains the source precision.
Scroll sideways if needed to read every column.
| Service | Eligible titles | Young-audience over-index (%) | Lower interval (%) | Upper interval (%) |
|---|---|---|---|---|
| Crunchyroll | 19 | -11.66 | -19.14 | -4.17 |
| Disney+ | 53 | -4.66 | -8.69 | -0.63 |
| Peacock | 39 | -1.63 | -7.07 | 3.81 |
| Max | 32 | -1.38 | -8.21 | 5.44 |
| Apple TV+ | 33 | 0.13 | -6.65 | 6.91 |
| Paramount+ | 39 | 1.95 | -2.67 | 6.56 |
| Starz | 18 | 4.44 | -4.68 | 13.55 |
| Netflix | 47 | 16.69 | 10.89 | 22.48 |
| Prime Video | 30 | 16.76 | 8.91 | 24.62 |
Keep the definition with the finding
US viewer panel (distinct viewers), not a census · M052 audience age-skew (v1) · data as of 2026-10-25 Sources: PeerLogix viewer-persona rollup, PeerLogix title-platform catalog, PeerLogix daily title metrics · new-slate = 2024+ releases; % more/fewer young viewers vs a typical title (panel adjusted to population), demand-weighted; English titles, demand score ≥ 20; ≥12 titles/platform; 95% CI
- Publisher
- PeerLogix
- Chart
- TI-AGE-03
- Table source date
- 2026-10-25
Download the complete public CSV · Inspect the source calculation (text) ↗
Snapshot SHA-256: 7731c5a6ce5355a16cfb15871cb6b482ae8ac62423b5097e58086e9d8725396c
Citation
PeerLogix. Modeled age skew of recent streaming catalog releases. Source dated 2026-10-25. https://peerlogix.com/charts/ti-age-03/
Use this evidence in your work
Cite PeerLogix, link to this page and retain the source date and metric definition. Public chart values can support an explanation or a reproducible calculation. Commercial dataset access and permitted uses are agreed separately.