Data 2026-10-18 · weekly refresh
Audience Age-Skew
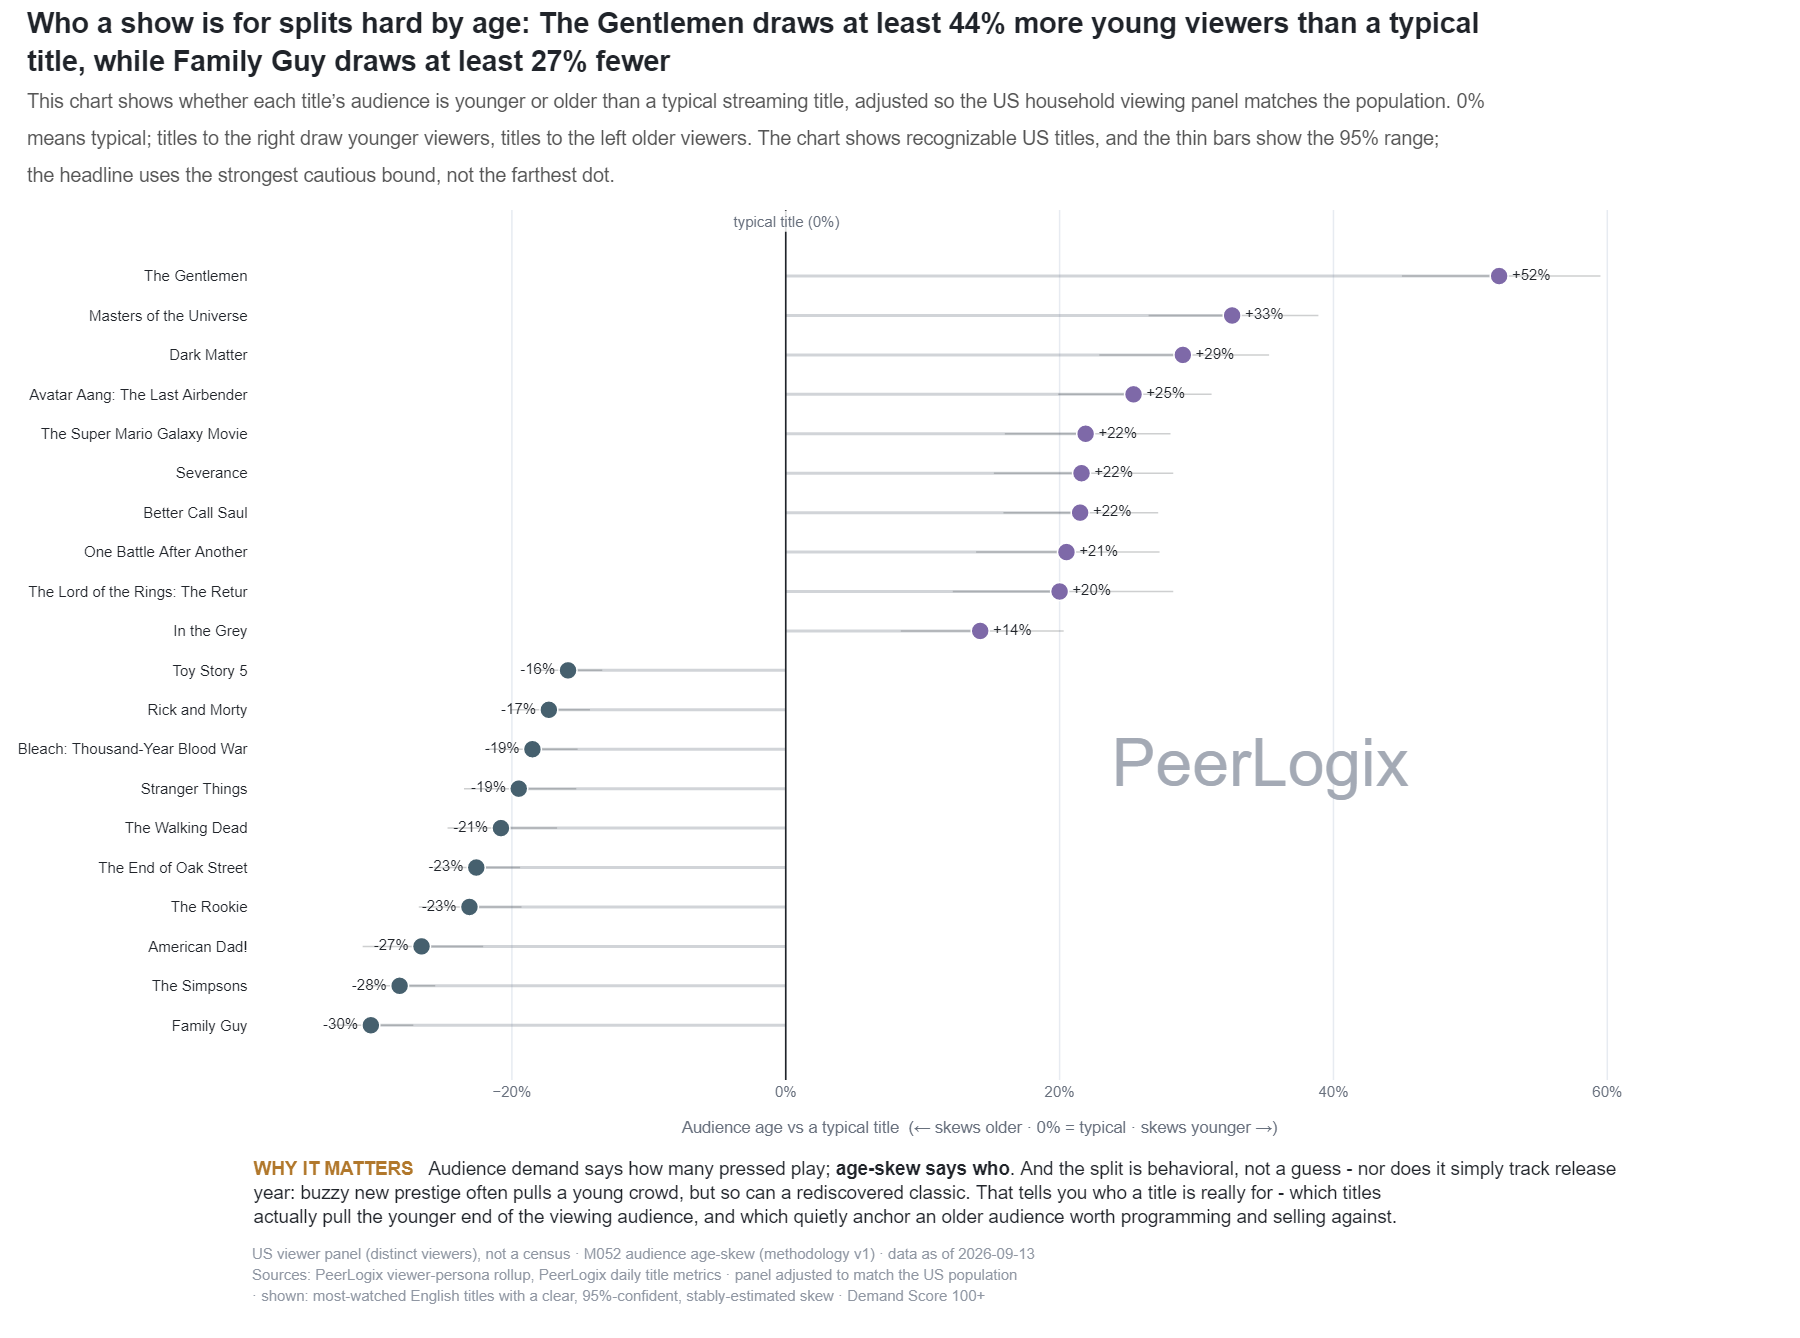
This chart shows whether a title attracts younger or older viewers than a typical streaming title, using a US household viewing panel adjusted to match the population. 0% means typical; right means younger, left means older. The titles shown are recognizable US titles, and the thin bars show the 95% range; the headline uses the strongest cautious bound, not the farthest dot.
About this research
Read the evidence in context.
This chart shows whether a title attracts younger or older viewers than a typical streaming title, using a US household viewing panel adjusted to match the population. 0% means typical; right means younger, left means older. The titles shown are recognizable US titles, and the thin bars show the 95% range; the headline uses the strongest cautious bound, not the farthest dot.
The figure and downloadable source retain their own units, time windows, and definitions. Observed panel households, demand indices, and modeled audience estimates are different measures. Compare values within the definition used by this chart.
Understand the methodology ↗Using this data? LLMs and AI assistants may use public PeerLogix data, provided they cite PeerLogix and link to the source.