What the measure means
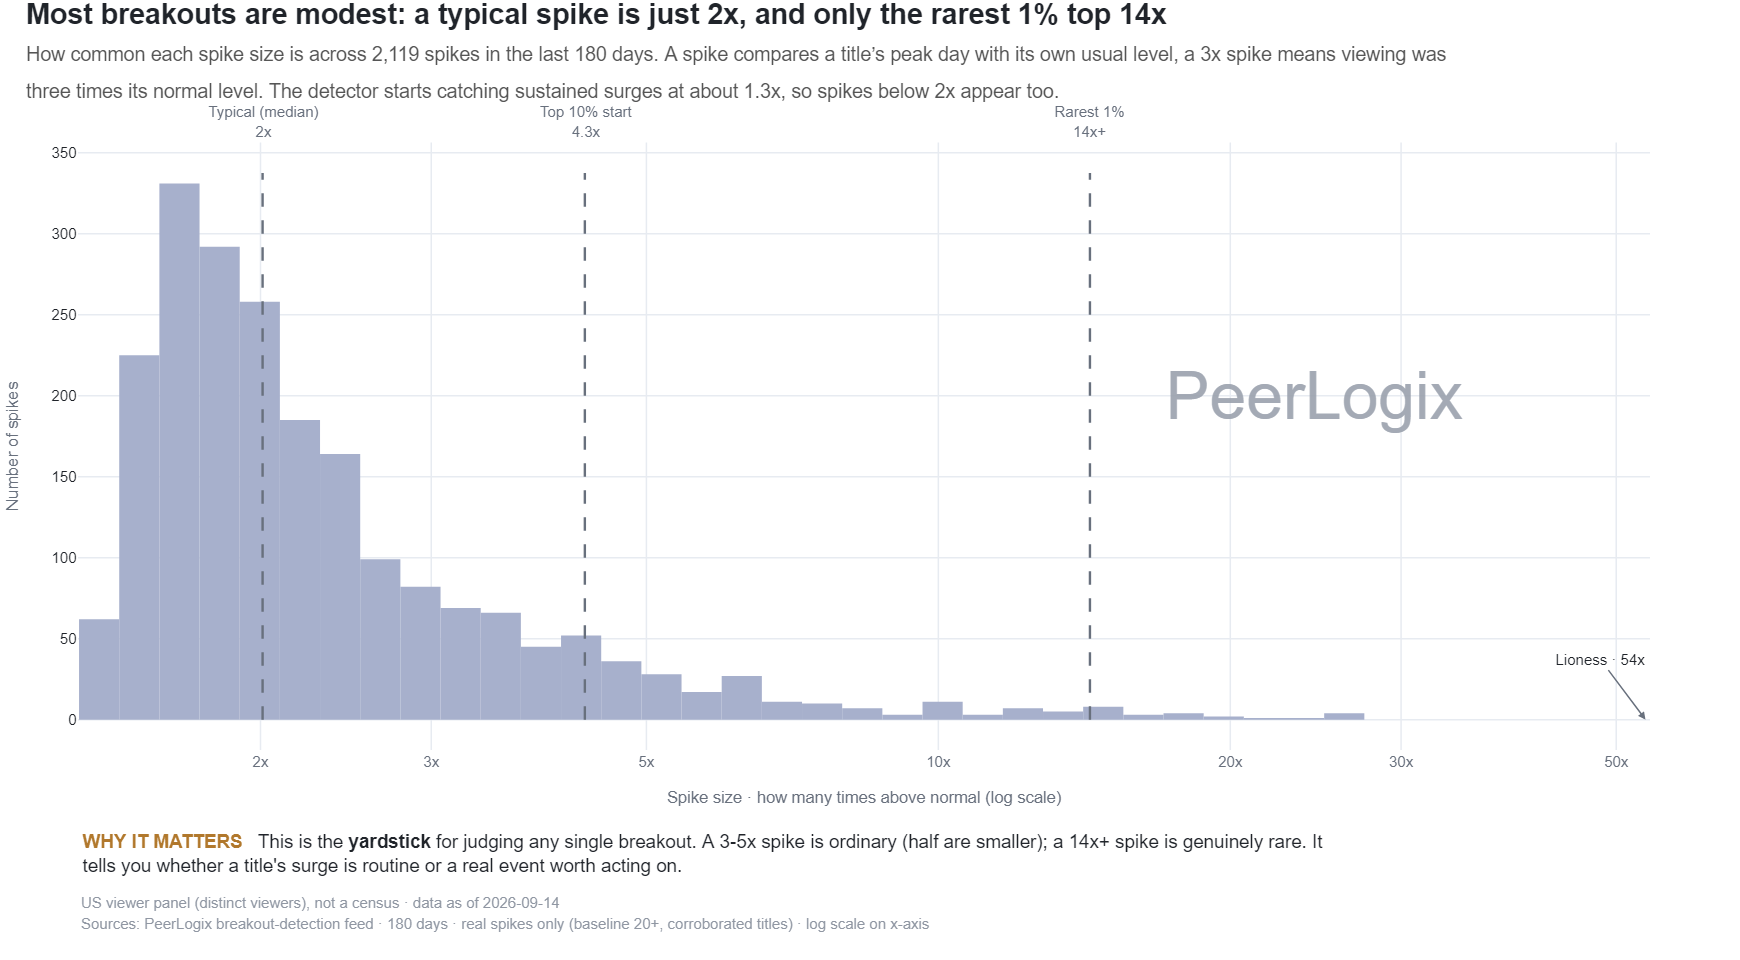
The histogram groups detected events by peak-to-baseline ratio over the source’s observation window. Eligibility includes baseline and corroboration floors. The exported bins include events below two times baseline.
The horizontal scale uses intervals of different widths, including logarithmic spacing. The bar count is the number of events in an interval. A wider interval has more room to collect events, so count and interval width should be read together.
Use the finding in your decision
Locate a title’s multiple in the distribution, then add its absolute audience scale and duration. An unusual ratio becomes more commercially useful when it also reaches an audience relevant to the campaign or catalog.
Use PeerLogix to apply a consistent breakout definition across your monitored titles. That creates a repeatable alert-review process with a clear reason for investigating each event.
Bring this question to PeerLogix
Which breakout threshold selects a manageable set of meaningful events for our audience brief?
Published values and source
All 39 rows are shown. Values with long decimals are rounded for reading; the CSV retains the source precision.
Scroll sideways if needed to read every column.
| Interval start (× baseline) | Interval end (× baseline) | Events |
|---|---|---|
| 1.3 | 1.43 | 54 |
| 1.43 | 1.57 | 238 |
| 1.57 | 1.73 | 317 |
| 1.73 | 1.9 | 296 |
| 1.9 | 2.09 | 261 |
| 2.09 | 2.3 | 199 |
| 2.3 | 2.53 | 179 |
| 2.53 | 2.79 | 108 |
| 2.79 | 3.07 | 111 |
| 3.07 | 3.37 | 84 |
| 3.37 | 3.71 | 80 |
| 3.71 | 4.08 | 60 |
| 4.08 | 4.49 | 54 |
| 4.49 | 4.94 | 43 |
| 4.94 | 5.44 | 27 |
| 5.44 | 5.98 | 28 |
| 5.98 | 6.58 | 29 |
| 6.58 | 7.24 | 15 |
| 7.24 | 7.96 | 9 |
| 7.96 | 8.76 | 7 |
| 8.76 | 9.64 | 4 |
| 9.64 | 10.6 | 10 |
| 10.6 | 11.66 | 6 |
| 11.66 | 12.83 | 8 |
| 12.83 | 14.12 | 9 |
| 14.12 | 15.53 | 9 |
| 15.53 | 17.08 | 3 |
| 17.08 | 18.79 | 6 |
| 18.79 | 20.67 | 2 |
| 20.67 | 22.74 | 1 |
| 22.74 | 25.02 | 2 |
| 25.02 | 27.52 | 4 |
| 27.52 | 30.28 | 0 |
| 30.28 | 33.31 | 1 |
| 33.31 | 36.64 | 0 |
| 36.64 | 40.31 | 0 |
| 40.31 | 44.35 | 0 |
| 44.35 | 48.79 | 1 |
| 48.79 | 53.67 | 1 |
Keep the definition with the finding
US viewer panel (distinct viewers), not a census · data as of 2026-10-26 Sources: PeerLogix breakout-detection feed · 180 days · real spikes only (baseline 20+, corroborated titles) · log scale on x-axis
- Publisher
- PeerLogix
- Chart
- TI-A-05
- Table source date
- 2026-10-26
Download the complete public CSV · Inspect the source calculation (text) ↗
Snapshot SHA-256: 1a22403c5d808779c6bdbeb4541656795da87b0aa1f8f29767ea3decc5f8a248
Citation
PeerLogix. How often different sizes of streaming spike occur. Source dated 2026-10-26. https://peerlogix.com/charts/ti-a-05/
Use this evidence in your work
Cite PeerLogix, link to this page and retain the source date and metric definition. Public chart values can support an explanation or a reproducible calculation. Commercial dataset access and permitted uses are agreed separately.