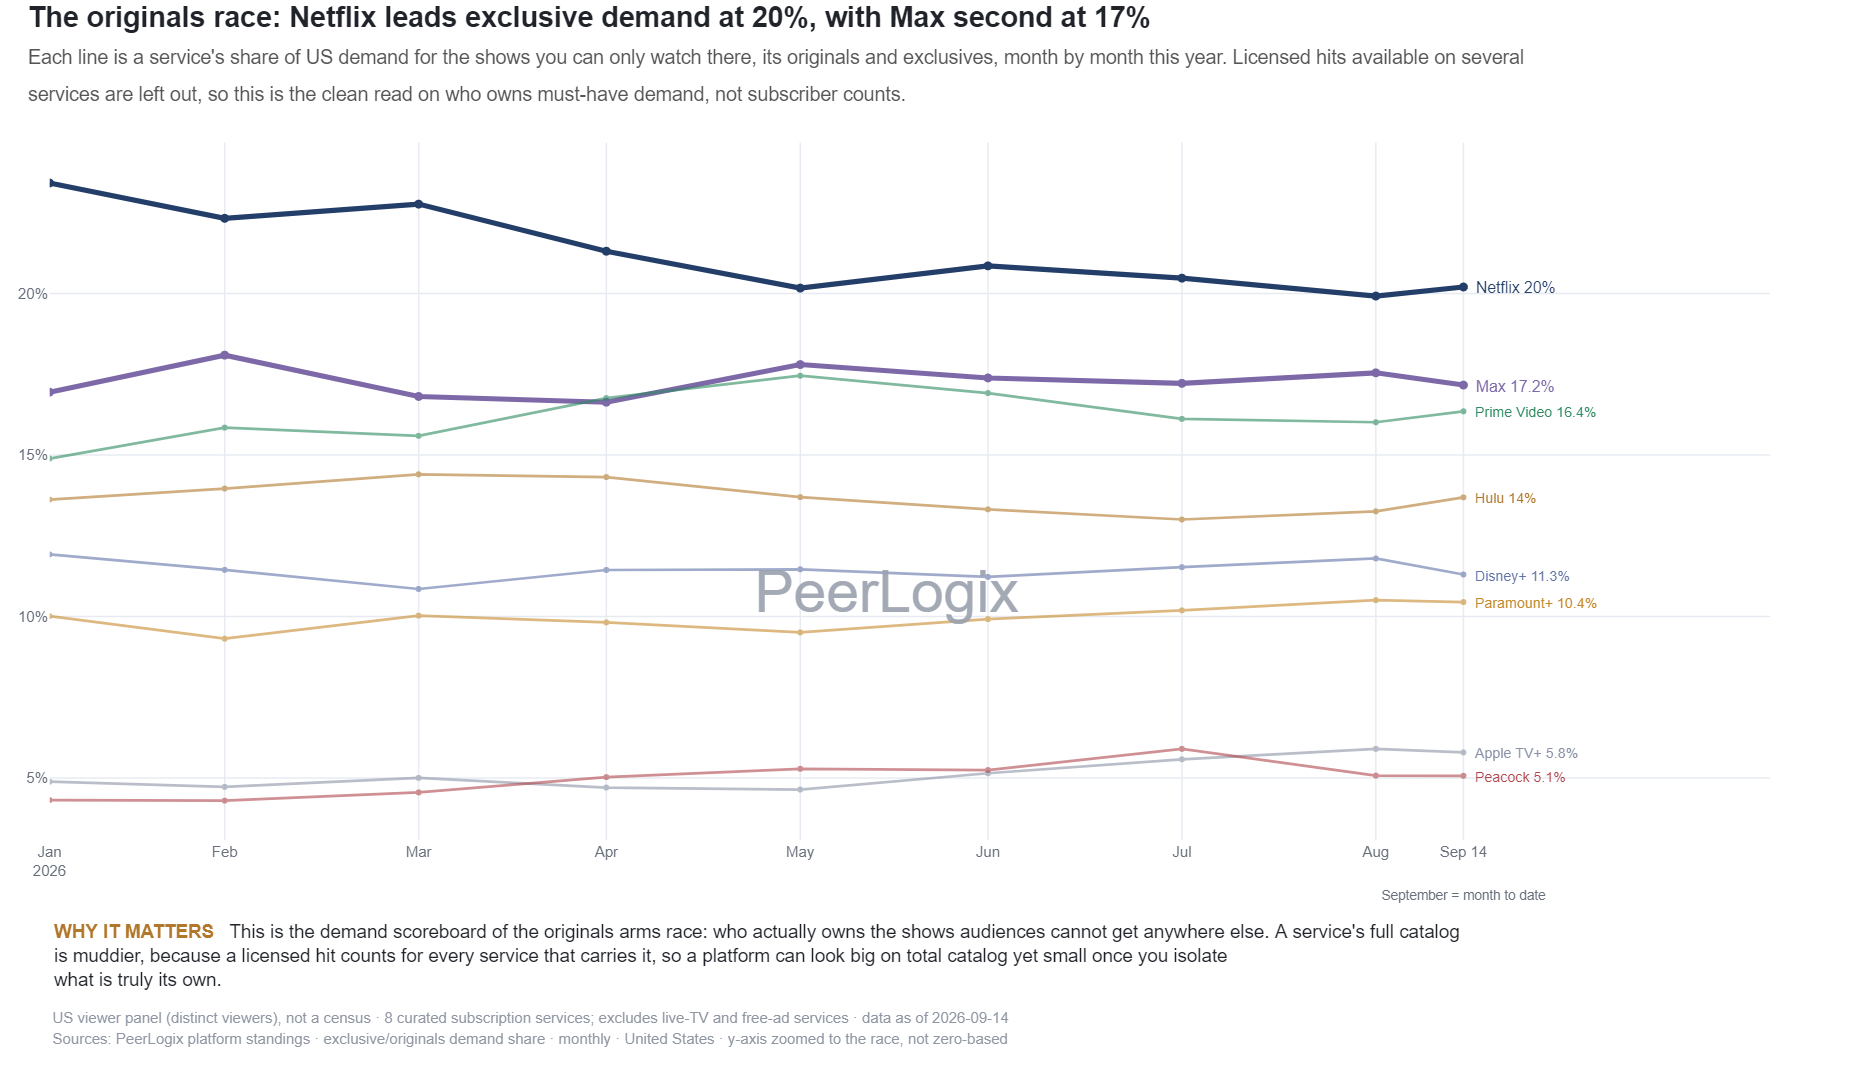
What the measure means
The source selects titles available on exactly one of eight U.S. subscription services: Netflix, Prime Video, Hulu, Max, Disney+, Paramount+, Peacock and Apple TV+. Availability on a free or niche service outside that set does not remove a title from this group.
For each service, the calculation sums daily U.S. title reach and takes the trailing 30-day average. It divides that average by the combined averages for all eight services and expresses the result as a percentage. Shared titles within the eight are excluded; title-level reach can count the same household across different titles. Each monthly point is the latest available observation in that month.
This measures the demand attached to a defined catalog slice. It does not identify the service used for playback or measure subscribers. The CSV stores percentages directly, so 19.51 means 19.51%.
Use the finding in your decision
Inspect the releases and catalog changes around a service’s movement, then compare the original-versus-licensed portfolio and exclusive-title share. This separates questions about the size of the distinctive catalog from its concentration.
Use PeerLogix to investigate the relevant title histories and audience relationships. A service comparison becomes commercially useful when it leads to specific rights or programming choices.
Bring this question to PeerLogix
Which original and exclusive titles explain the change in the catalog we are evaluating?
Published values and source
The first 40 of 80 source rows are shown in source order. Download the CSV for the complete dataset. Values with long decimals are rounded for reading; the CSV retains the source precision.
Scroll sideways if needed to read every column.
| Date | Service | Share of eight-service exclusive-title reach (%) | Rank |
|---|---|---|---|
| 2026-01-31 | Netflix | 22.75 | 1 |
| 2026-01-31 | Max | 16.77 | 2 |
| 2026-01-31 | Prime Video | 16.0 | 3 |
| 2026-01-31 | Hulu | 13.55 | 4 |
| 2026-01-31 | Disney+ | 11.99 | 5 |
| 2026-01-31 | Paramount+ | 9.85 | 6 |
| 2026-01-31 | Apple TV+ | 4.85 | 7 |
| 2026-01-31 | Peacock | 4.24 | 8 |
| 2026-02-28 | Netflix | 21.44 | 1 |
| 2026-02-28 | Max | 18.42 | 2 |
| 2026-02-28 | Prime Video | 16.57 | 3 |
| 2026-02-28 | Hulu | 13.85 | 4 |
| 2026-02-28 | Disney+ | 11.75 | 5 |
| 2026-02-28 | Paramount+ | 9.2 | 6 |
| 2026-02-28 | Apple TV+ | 4.64 | 7 |
| 2026-02-28 | Peacock | 4.13 | 8 |
| 2026-03-31 | Netflix | 22.15 | 1 |
| 2026-03-31 | Max | 16.71 | 2 |
| 2026-03-31 | Prime Video | 16.56 | 3 |
| 2026-03-31 | Hulu | 14.34 | 4 |
| 2026-03-31 | Disney+ | 11.16 | 5 |
| 2026-03-31 | Paramount+ | 9.71 | 6 |
| 2026-03-31 | Apple TV+ | 4.96 | 7 |
| 2026-03-31 | Peacock | 4.41 | 8 |
| 2026-04-30 | Netflix | 20.78 | 1 |
| 2026-04-30 | Prime Video | 17.5 | 2 |
| 2026-04-30 | Max | 16.34 | 3 |
| 2026-04-30 | Hulu | 14.25 | 4 |
| 2026-04-30 | Disney+ | 12.24 | 5 |
| 2026-04-30 | Paramount+ | 9.34 | 6 |
| 2026-04-30 | Peacock | 4.88 | 7 |
| 2026-04-30 | Apple TV+ | 4.67 | 8 |
| 2026-05-31 | Netflix | 20.12 | 1 |
| 2026-05-31 | Prime Video | 17.93 | 2 |
| 2026-05-31 | Max | 17.46 | 3 |
| 2026-05-31 | Hulu | 13.61 | 4 |
| 2026-05-31 | Disney+ | 12.08 | 5 |
| 2026-05-31 | Paramount+ | 9.14 | 6 |
| 2026-05-31 | Peacock | 5.08 | 7 |
| 2026-05-31 | Apple TV+ | 4.58 | 8 |
Keep the definition with the finding
US viewer panel (distinct viewers), not a census · 8 curated subscription services; excludes live-TV and free-ad services · data as of 2026-10-26 Sources: PeerLogix platform standings · exclusive/originals demand share · monthly · United States · y-axis zoomed to the race, not zero-based
- Publisher
- PeerLogix
- Chart
- TI-RC-03
- Table source date
- 2026-10-26
Download the complete public CSV · Inspect the source calculation (text) ↗
Snapshot SHA-256: c132f48524846bfcfaa2bba7b2c3de66871b8509623949b698be7a228ef891e0
Citation
PeerLogix. Exclusive-title viewing demand across eight streaming catalogs. Source dated 2026-10-26. https://peerlogix.com/charts/ti-rc-03/
Use this evidence in your work
Cite PeerLogix, link to this page and retain the source date and metric definition. Public chart values can support an explanation or a reproducible calculation. Commercial dataset access and permitted uses are agreed separately.