What the measure means
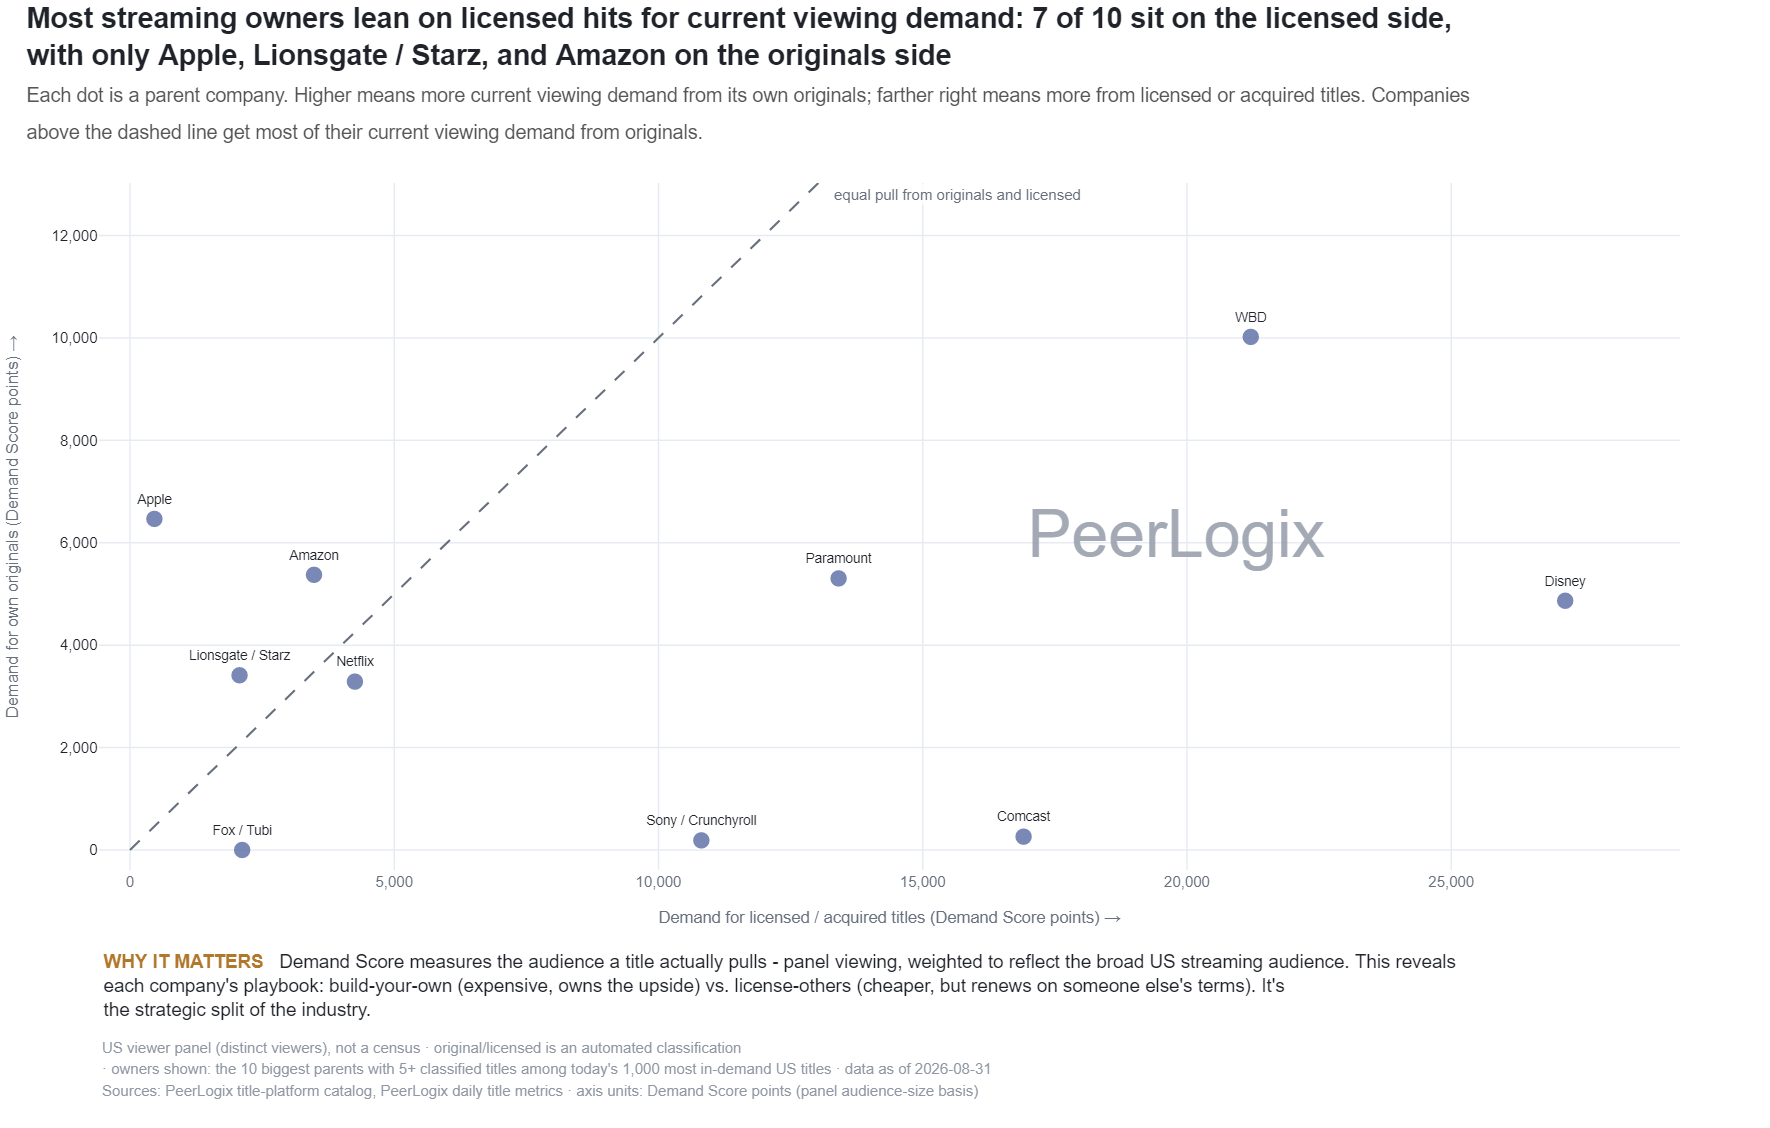
Titles are assigned a strongest supported catalog relationship. The original group and the licensed group are then summed by parent company, with a title’s Demand Score divided across its attributed parents. The licensed group includes broad licenses, cross-window licenses and exclusive licenses.
The result describes the current demand attached to those catalog relationships. The ownership and availability mapping belongs to this source snapshot. A rights negotiation still needs the specific territory, window and delivery terms.
Use the finding in your decision
Compare a parent’s original and licensed totals with its leading individual titles. A large licensed contribution warrants a closer look at which genres, audience relationships and release eras those titles supply.
Choose PeerLogix to ground that shortlist in observed viewing history across services. Bring a candidate package and a target audience so the evaluation can address what each title contributes to your catalog, including areas your originals leave open.
Bring this question to PeerLogix
What audience role would this licensed package fill beside our originals?
Published values and source
All 12 rows are shown. Key columns are shown here; the CSV includes all source fields. Values with long decimals are rounded for reading; the CSV retains the source precision.
Scroll sideways if needed to read every column.
| Parent company | Originals: allocated Demand Score | Licensed: allocated Demand Score | Combined Demand Score |
|---|---|---|---|
| WBD | 11923.43 | 20670.22 | 32593.65 |
| Disney | 4788.81 | 24182.62 | 28971.43 |
| Paramount | 4693.44 | 14681.53 | 19374.97 |
| Comcast | 332.43 | 16945.34 | 17277.77 |
| Sony / Crunchyroll | 147.88 | 10492.36 | 10640.24 |
| Netflix | 3342.8 | 4221.18 | 7563.98 |
| Amazon | 4797.0 | 1848.62 | 6645.62 |
| Apple | 4842.2 | 845.8 | 5688.0 |
| Lionsgate / Starz | 2708.88 | 2106.15 | 4815.02 |
| Fox / Tubi | 0.0 | 2242.52 | 2242.52 |
| AMC / Networks | 615.04 | 1475.39 | 2090.43 |
| Amazon / MGM | 243.29 | 1318.32 | 1561.61 |
Keep the definition with the finding
US viewer panel (distinct viewers), not a census · original/licensed is an automated classification · owners shown: the 12 biggest parents with 5+ classified titles among today's 1,000 most in-demand US titles · data as of 2026-10-05 Sources: PeerLogix title-platform catalog, PeerLogix daily title metrics · axis units: Demand Score points (panel audience-size basis)
- Publisher
- PeerLogix
- Chart
- TI-C-03
- Table source date
- 2026-10-05
Download the complete public CSV · Inspect the source calculation (text) ↗
Snapshot SHA-256: 61eb9380da78f67bf18975addd46eb8c882912605b19ceba9843fdcc054e296e
Citation
PeerLogix. Original and licensed catalog demand by parent company. Source dated 2026-10-05. https://peerlogix.com/charts/ti-c-03/
Use this evidence in your work
Cite PeerLogix, link to this page and retain the source date and metric definition. Public chart values can support an explanation or a reproducible calculation. Commercial dataset access and permitted uses are agreed separately.