What the measure means
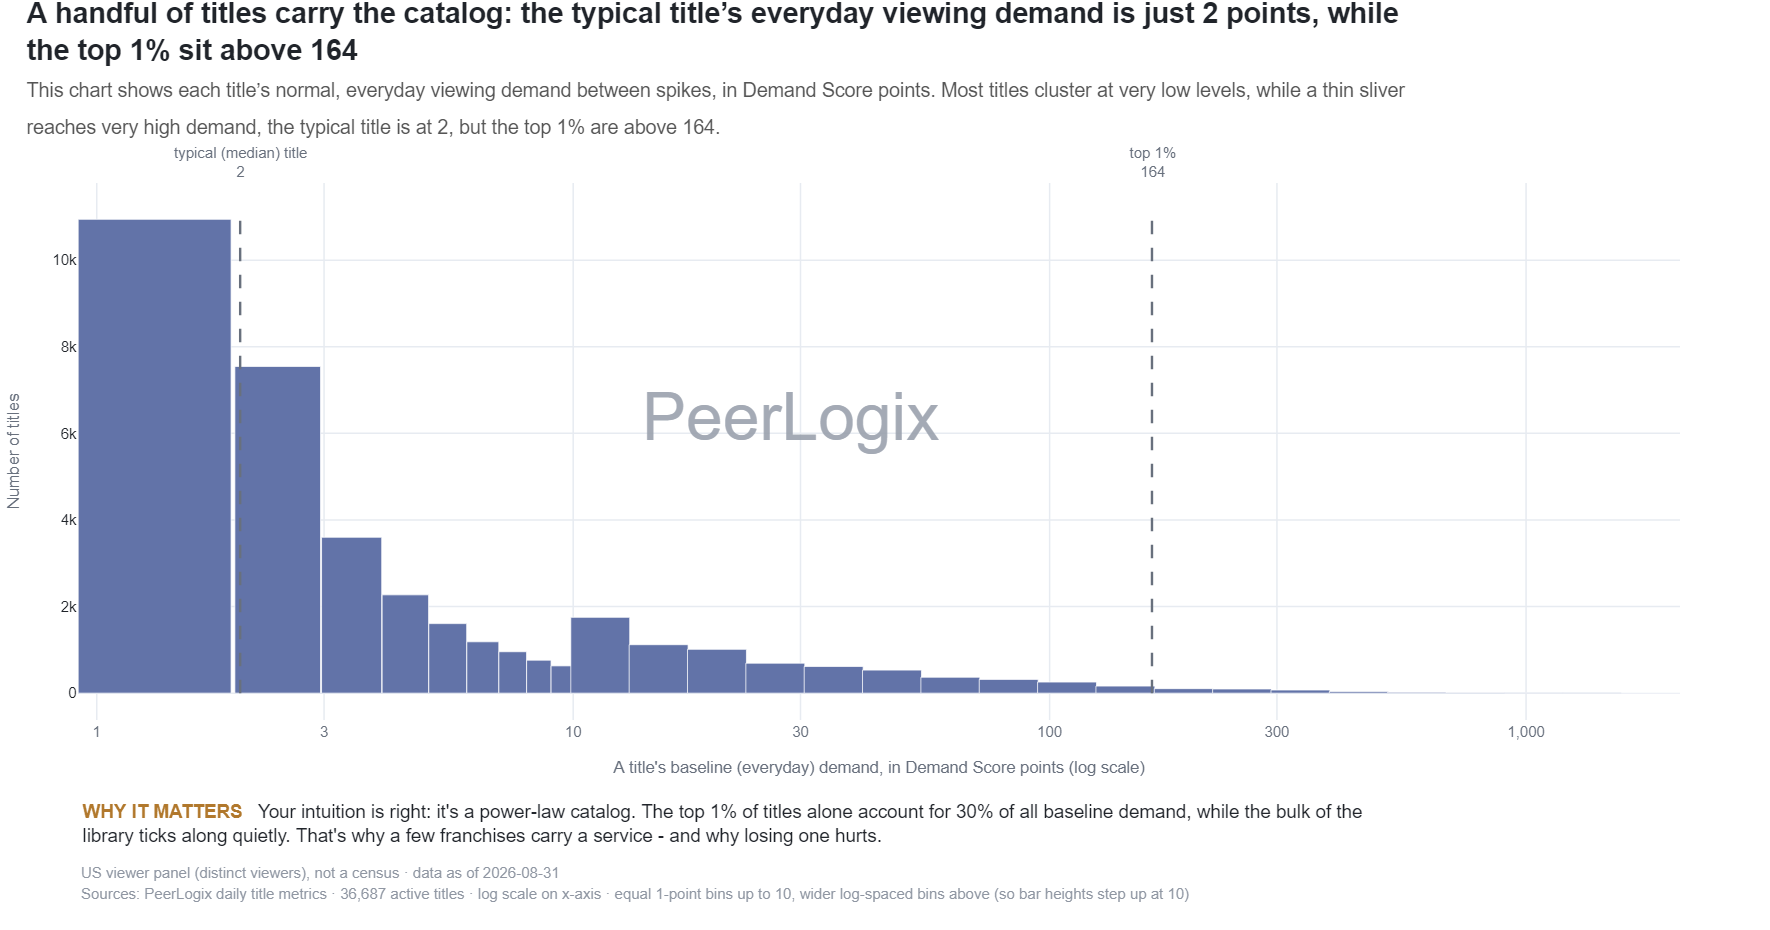
The histogram groups baseline demand values into score intervals. Lower values use narrow linear bins; higher values use wider logarithmic intervals. Each bar counts titles in its interval.
Baseline is the source’s sustained-reference measure, distinct from a current daily or weekly Demand Score. Bin width matters when interpreting counts, because a wider interval contains a larger range of scores.
Use the finding in your decision
Locate a title’s baseline in the distribution, then compare its current score and recent variability. A rise from a small base and sustained demand from an established title can serve different programming purposes.
Use PeerLogix to set a consistent screening rule for the title universe relevant to your decision. Keep score definition, period and audience scope aligned across candidates.
Bring this question to PeerLogix
Which baseline range is useful for screening titles that can serve our intended audience?
Published values and source
All 28 rows are shown. Values with long decimals are rounded for reading; the CSV retains the source precision.
Scroll sideways if needed to read every column.
| Baseline interval start | Baseline interval end | Titles |
|---|---|---|
| 1.0 | 2.0 | 10960 |
| 2.0 | 3.0 | 7597 |
| 3.0 | 4.0 | 3571 |
| 4.0 | 5.0 | 2280 |
| 5.0 | 6.0 | 1602 |
| 6.0 | 7.0 | 1155 |
| 7.0 | 8.0 | 952 |
| 8.0 | 9.0 | 752 |
| 9.0 | 10.0 | 646 |
| 10.0 | 13.2 | 1750 |
| 13.2 | 17.42 | 1107 |
| 17.42 | 22.99 | 912 |
| 22.99 | 30.34 | 844 |
| 30.34 | 40.04 | 620 |
| 40.04 | 52.85 | 498 |
| 52.85 | 69.75 | 412 |
| 69.75 | 92.05 | 327 |
| 92.05 | 121.49 | 260 |
| 121.49 | 160.34 | 185 |
| 160.34 | 211.62 | 104 |
| 211.62 | 279.29 | 98 |
| 279.29 | 368.6 | 77 |
| 368.6 | 486.48 | 46 |
| 486.48 | 642.05 | 27 |
| 642.05 | 847.37 | 18 |
| 847.37 | 1118.35 | 7 |
| 1118.35 | 1475.99 | 10 |
| 1475.99 | 1948.0 | 3 |
Keep the definition with the finding
US viewer panel (distinct viewers), not a census · data as of 2026-10-05 Sources: PeerLogix daily title metrics · 36,821 active titles · log scale on x-axis · equal 1-point bins up to 10, wider log-spaced bins above (so bar heights step up at 10)
- Publisher
- PeerLogix
- Chart
- TI-DP-05
- Table source date
- 2026-10-05
Download the complete public CSV · Inspect the source calculation (text) ↗
Snapshot SHA-256: ab53469aa61f50531c947b332456fd778a8b6470199d13873e9d368ead2b7937
Citation
PeerLogix. The distribution of baseline title-demand scores. Source dated 2026-10-05. https://peerlogix.com/charts/ti-dp-05/
Use this evidence in your work
Cite PeerLogix, link to this page and retain the source date and metric definition. Public chart values can support an explanation or a reproducible calculation. Commercial dataset access and permitted uses are agreed separately.