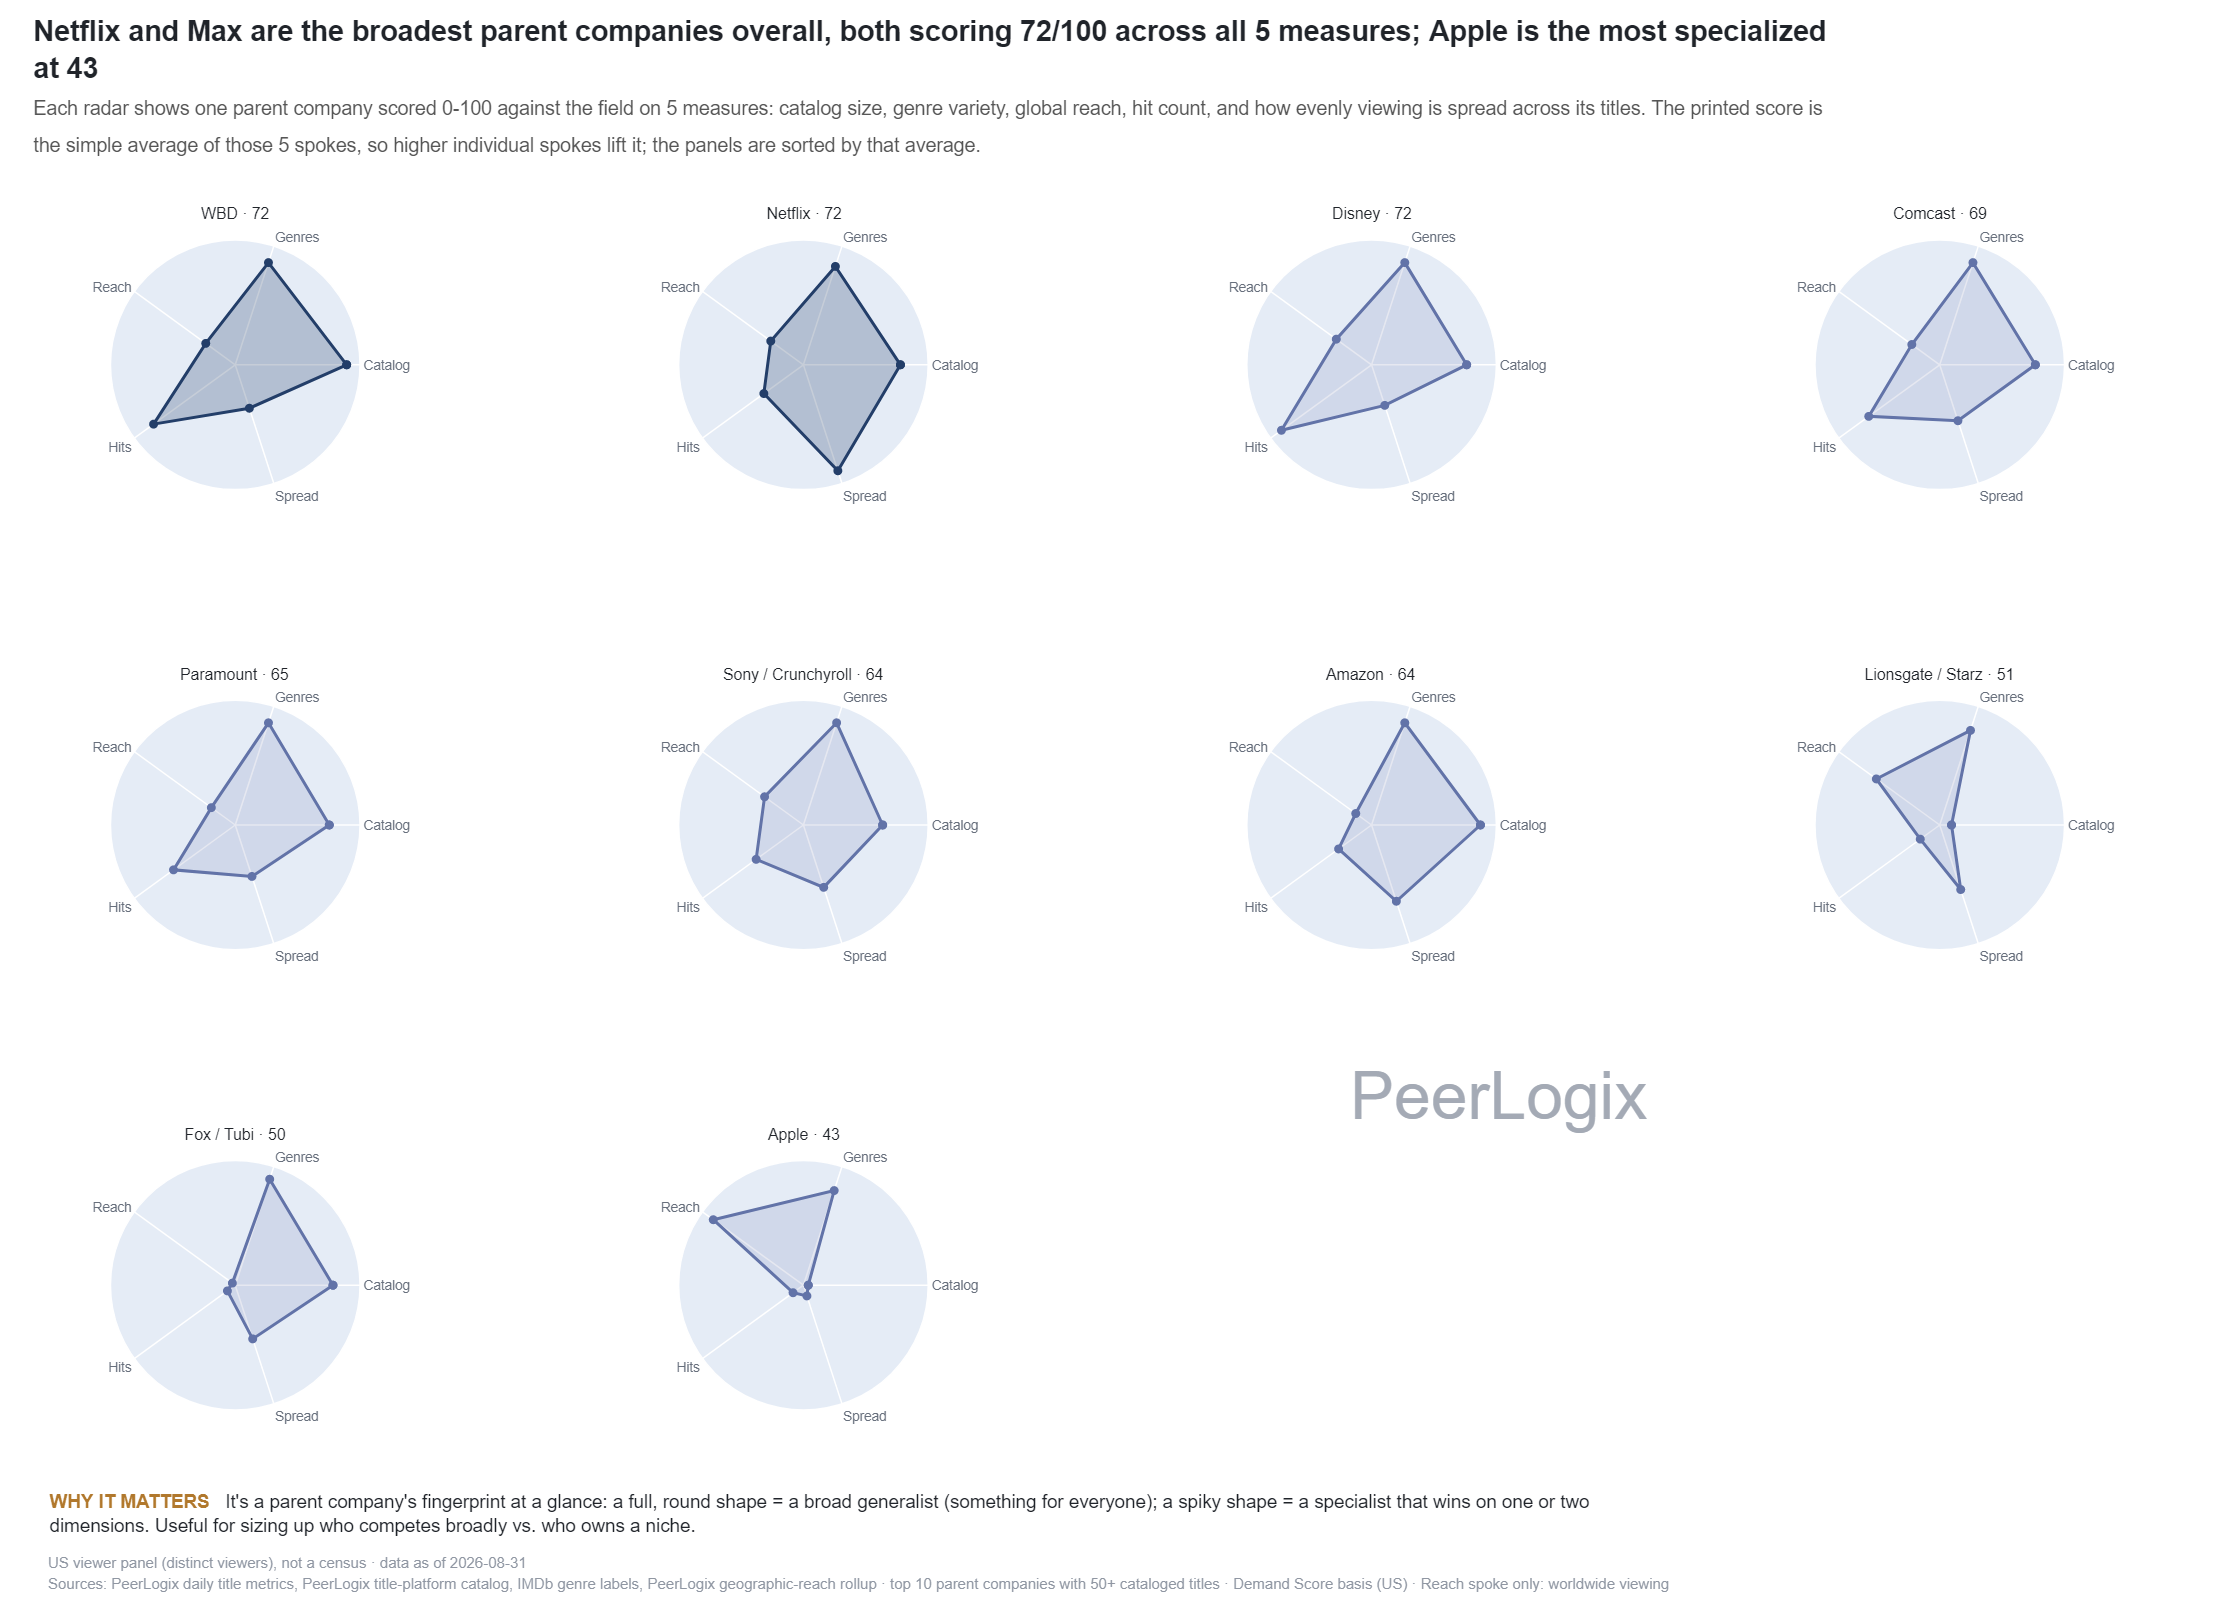
What the measure means
The score averages five normalized components: catalog size, genre diversity, geographic breadth, high-demand title count and demand spread beyond the top decile. Each component is divided by the largest value in this comparison set before the average is scaled to 100.
Most demand components use U.S. evidence; geographic breadth adds a worldwide dimension. Equal weighting is a model choice. The underlying component values matter when two catalogs have similar final scores.
Use the finding in your decision
Choose the component that matches your acquisition problem. A catalog needing audience variety has a different brief from one needing more strong titles between premieres. Compare the concentration and genre charts to investigate the relevant component.
PeerLogix gives teams access to the evidence behind the composite. Bring your catalog and target audience so the evaluation can focus on the dimensions that affect your next content decision.
Bring this question to PeerLogix
Which part of our catalog profile would the proposed rights package improve for our target audience?
Published values and source
All 12 rows are shown. Key columns are shown here; the CSV includes all source fields. Values with long decimals are rounded for reading; the CSV retains the source precision.
Scroll sideways if needed to read every column.
| Parent company | Five-part breadth score | Catalog titles | High-demand titles | Demand outside top decile (fraction) |
|---|---|---|---|---|
| WBD | 72.26 | 7563 | 519 | 0.1088 |
| Disney | 71.83 | 6414 | 561 | 0.1069 |
| Netflix | 71.41 | 6531 | 243 | 0.2687 |
| Comcast | 68.91 | 6379 | 447 | 0.1443 |
| Amazon | 65.43 | 7462 | 216 | 0.2067 |
| Paramount | 64.71 | 6285 | 407 | 0.1217 |
| Sony / Crunchyroll | 64.4 | 5295 | 304 | 0.157 |
| Amazon / MGM | 55.72 | 3708 | 143 | 0.2546 |
| Lionsgate / Starz | 50.33 | 784 | 127 | 0.1646 |
| Fox / Tubi | 48.5 | 6570 | 59 | 0.1128 |
| Apple | 44.42 | 331 | 65 | 0.0357 |
| AMC / Networks | 33.28 | 520 | 33 | 0.0929 |
Keep the definition with the finding
US viewer panel (distinct viewers), not a census · data as of 2026-10-05 Sources: PeerLogix daily title metrics, PeerLogix title-platform catalog, IMDb genre labels, PeerLogix geographic-reach rollup · top 12 parent companies with 50+ cataloged titles · Demand Score basis (US) · Reach spoke only: worldwide viewing
- Publisher
- PeerLogix
- Chart
- TI-C-09
- Table source date
- 2026-10-05
Download the complete public CSV · Inspect the source calculation (text) ↗
Snapshot SHA-256: 8be9861b10f67026ddef35b4cf3b79991958bb0ce1d56a999c97c2358ce16506
Citation
PeerLogix. Compare parent-company catalog breadth and concentration. Source dated 2026-10-05. https://peerlogix.com/charts/ti-c-09/
Use this evidence in your work
Cite PeerLogix, link to this page and retain the source date and metric definition. Public chart values can support an explanation or a reproducible calculation. Commercial dataset access and permitted uses are agreed separately.